Social
To sign up to receive the latest Canadian Energy Centre research to your inbox email: research@canadianenergycentre.ca
Download the PDF here
Download the charts here
Overview
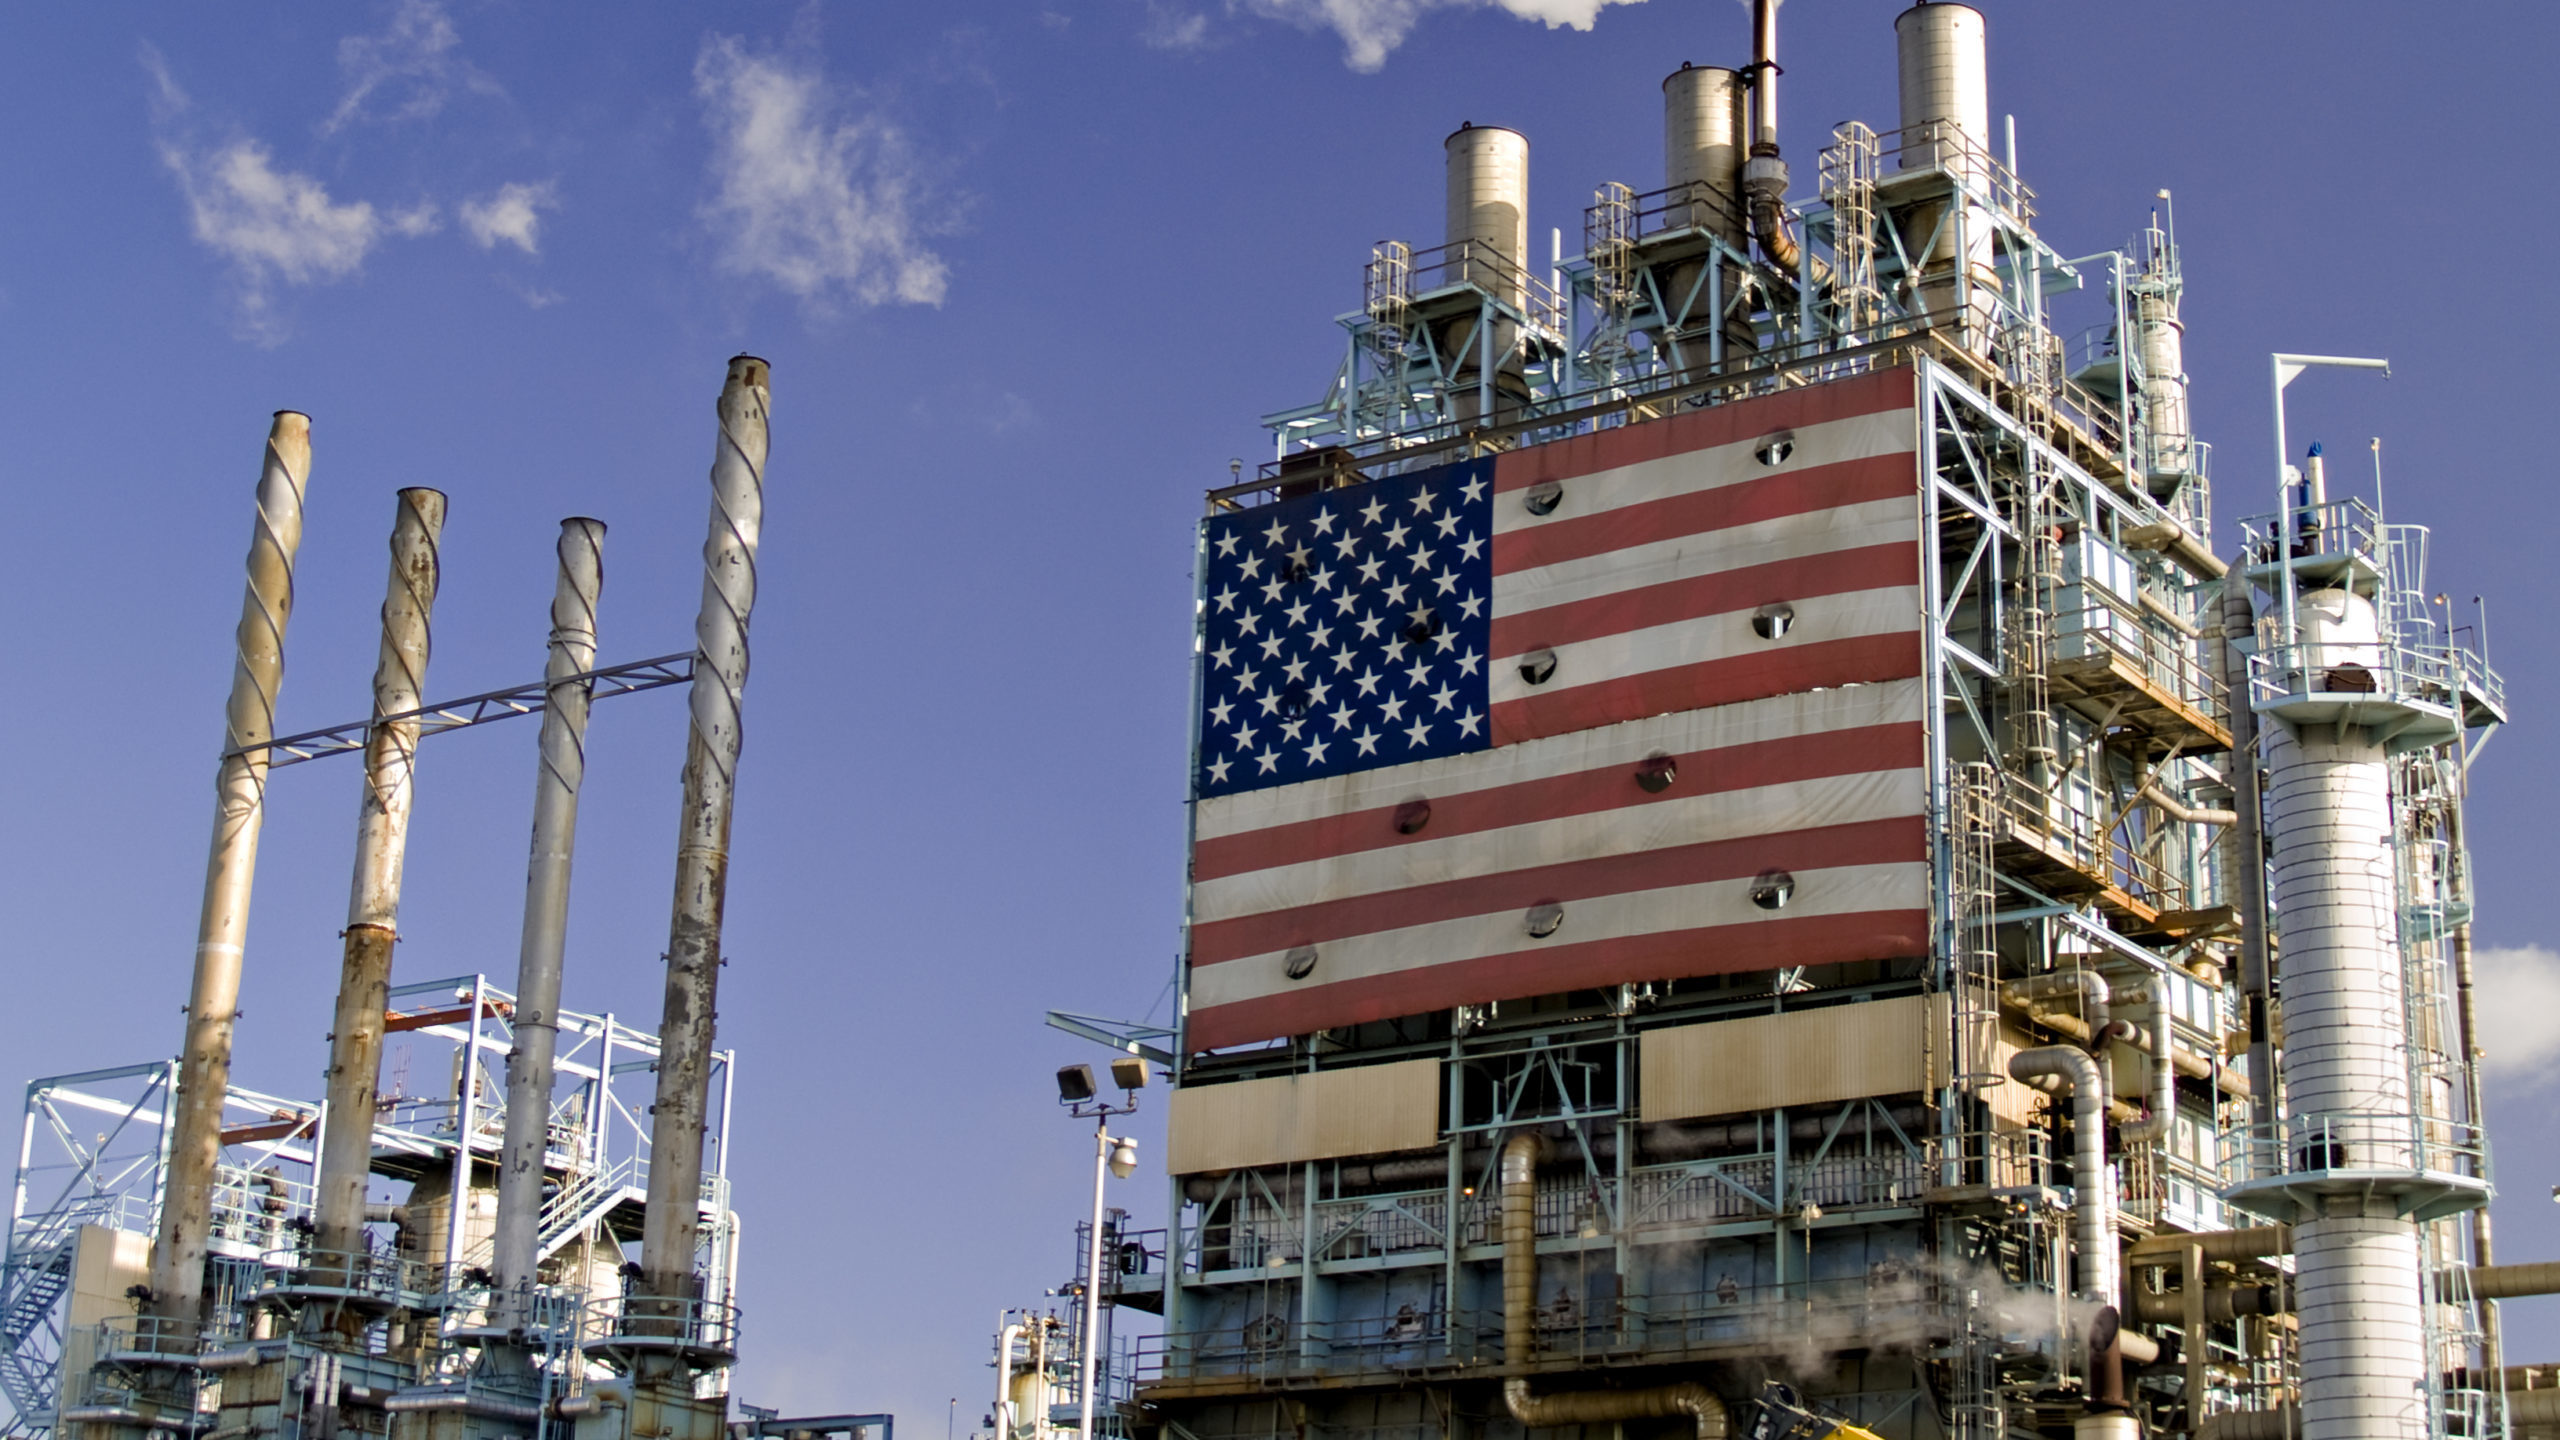
A strong American oil and gas industry is a critical element of economic prosperity and the North American energy security network linking Canada, the United States, and Mexico. In this CEC Fact Sheet, we analyze the direct and indirect economic impacts of the oil and gas industry in the United States.¹
The U.S. oil and gas industry comprises establishments engaged in oil and gas extraction, drilling oil and gas wells, support activities for oil and gas operations, natural gas distribution, petroleum refineries, petroleum lubricating oil and grease manufacturing, pipeline transportation, petroleum and petroleum products merchant wholesalers, and retail gasoline stations. The U.S. oil and gas industry also includes activities related to asphalt paving mixture and block manufacturing, asphalt shingle and coating materials manufacturing, and fuel dealers. Unfortunately, due to methodological differences between NAICS (the North American Industry Classification System) and IMPLAN (Impact Analysis for Planning, an economic impact assessment software system), these latter activities are difficult to separate out for the oil and gas industry and are not included in this analysis. Thus, the direct and indirect impacts of the U.S. oil and gas industry detailed in this CEC Fact Sheet are somewhat understated.
Before looking at the details of the analysis, it is helpful to know that there is a significant Canadian presence in the U.S. oil and gas industry; a reality of which both Americans and Canadians should be aware. It includes the following facts:
• Between 2000 and 2019, the cumulative aggregate value of the total energy products trade between Canada and the United States was nearly $2 trillion, including $138 billion in 2019 alone.
• Crude oil (including bitumen) has been the highest value commodity in the Canada-U.S. energy products trade flow, at a total value of $1.1 trillion over the 20-year period examined, including nearly $102 billion in 2019.
• Natural gas is the second highest value commodity in the cross-border energy products trade flow, representing a cumulative total trade value of over $426 billion over two decades, and over $12 billion in 2019.
• The percentage of total exports of Canadian heavy oil (i.e., with an API gravity of 25.0 degrees or less) that has been shipped to U.S. refineries has more than doubled over the past two decades, from 25.1 per cent of all Canadian oil exported in 2000 to 55.8 per cent in 2019.
• Overall, Canadian exports of crude oil to the U.S. for processing² have risen from nearly 1.3 million barrels per day in 2000 to over 3.8 million barrels per day in 2019, an increase of over 194 per cent.
The benefit to the United States from the operations of the Canadian oil and gas industry, in terms of importing Canadian oil and gas and supplying goods and services to the Canadian oil and gas industry, are significant. In 2019, the Canadian Energy Research Institute (CERI) estimated that for the forecast period of 2019-2029, the total impact on the US gross state product would amount to almost US$15 billion or CAN$20.3 billion (using the exchange rate of US$0.75 per CAN$1), while the total employment impact in creating or sustaining those operations would be around 133,000 full-time equivalent jobs (CERI, 2019).
1. See “About the IMPLAN model” in the Notes at the end of this Fact Sheet.
2. The American Petroleum Institute uses the word “processing,” but this can also be read as “refining.”
Summary Analysis
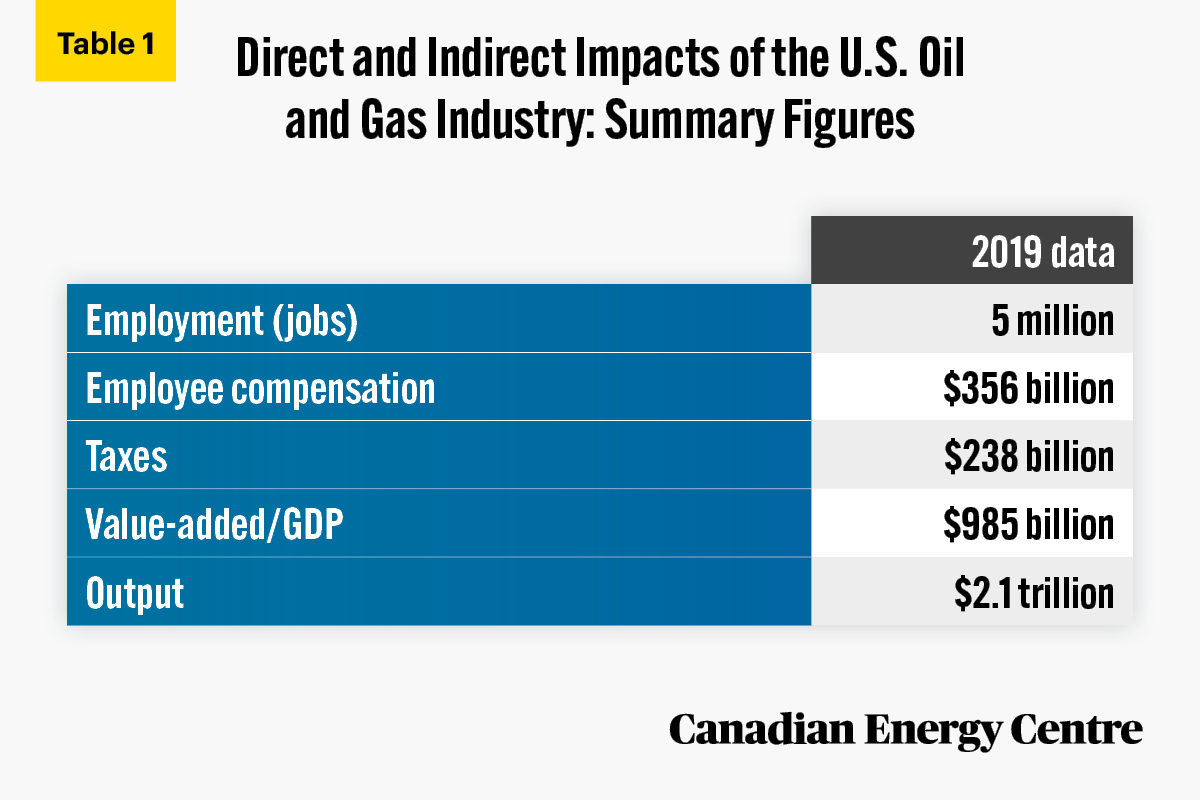
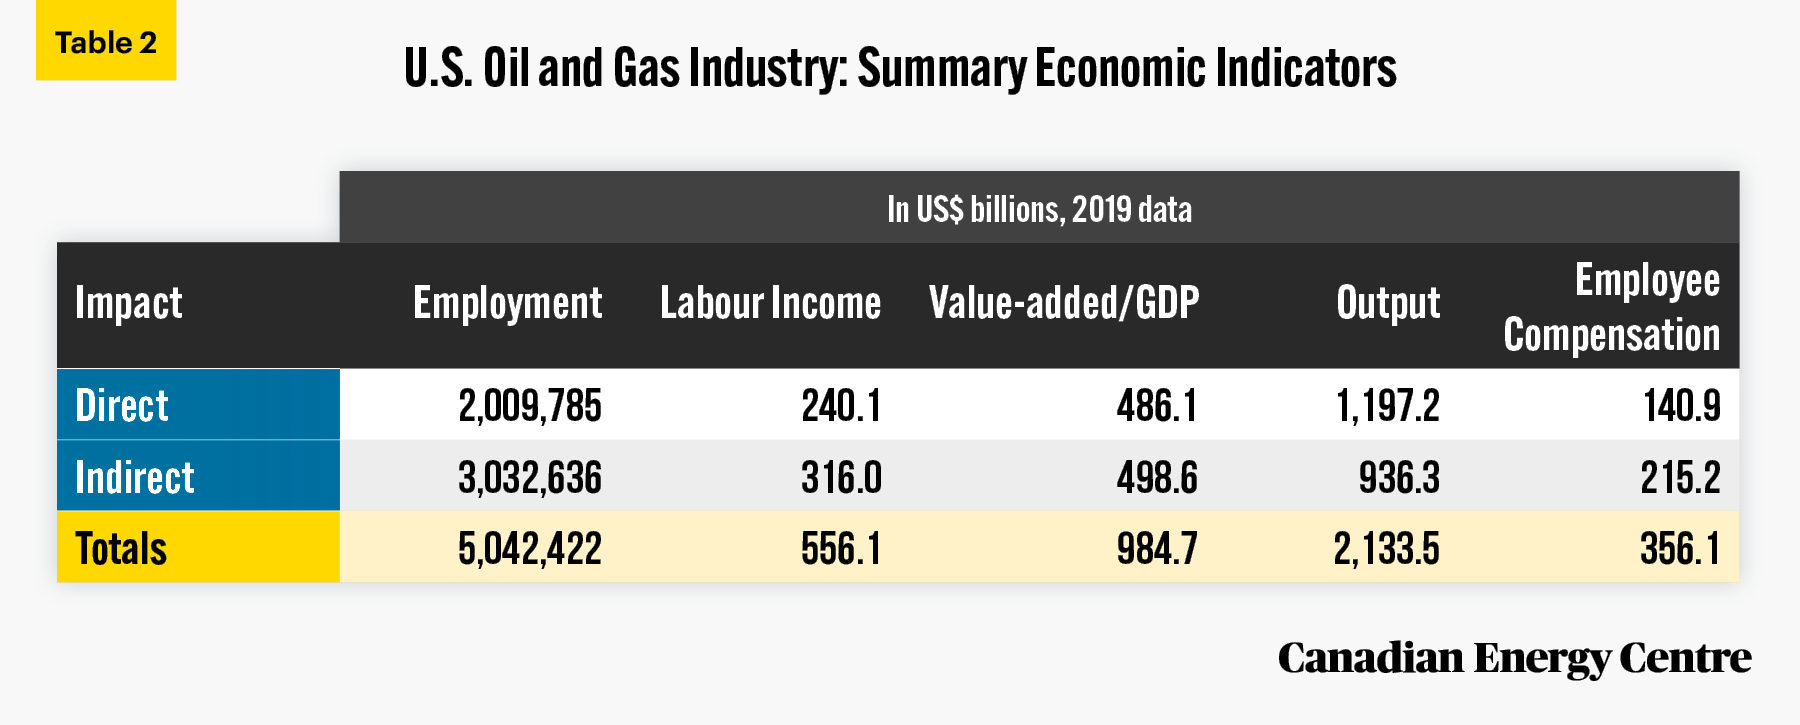
Tables 1 and 2 summarize the direct and indirect economic impacts on employment (jobs), employee compensation, labour income, output, value-added/GDP, and taxes from the operations of the U.S. oil and gas industry in 2019. Direct impacts are measured as the jobs, labour income, employee compensation, value-added/GDP and output within the U.S. oil and gas industry; indirect impacts are measured as the jobs, labour income, employee compensation, value-added/GDP and output throughout the supply chain of the U.S. oil and gas industry, i.e., not just direct spending by the oil and gas industry but spending by those in their supply chain.
Source: IMPLAN, 2021.
The direct and indirect economic impacts of the U.S. oil and gas industry in 2019 included two million direct jobs, three million indirect jobs, $356 billion in employee compensation,³ over $238 billion in direct and indirect federal, state, and county taxes, $985 billion in direct and indirect value-added/GDP, and $2.1 trillion in what is known as “outputs,” i.e., the value of goods and services produced by an industry (see Tables 1 and 2).
3. Note that employee compensation is total payroll paid to employees, including wages, salaries, and benefits. Labor income is the sum of employee compensation and proprietor income. Proprietor income is payments received by self-employed individuals and/or unincorporated business owners.
Source: IMPLAN, 2021.
Source: IMPLAN, 2021.
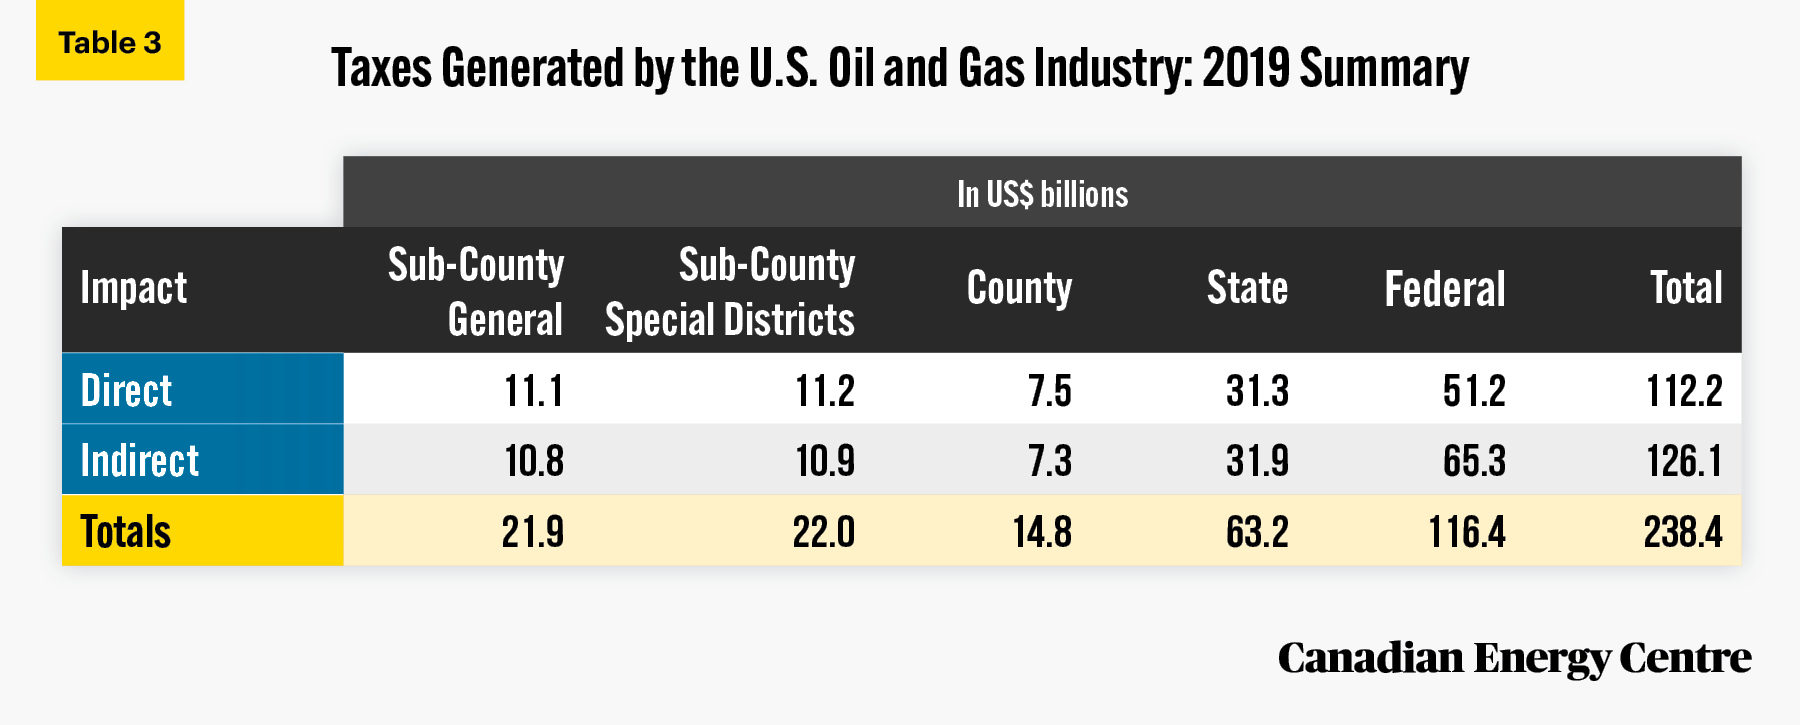
Note: See “Appendix: Definitions” for an explanation of sub-county general and special districts
Two million direct jobs; three million indirect jobs
In 2019, the U.S. oil and gas sector directly generated two million jobs. However, each direct job in the U.S. oil and gas industry supported an additional 1.51 indirect jobs elsewhere in the broad U.S. economy for another three million jobs — five million jobs in total in 2019.
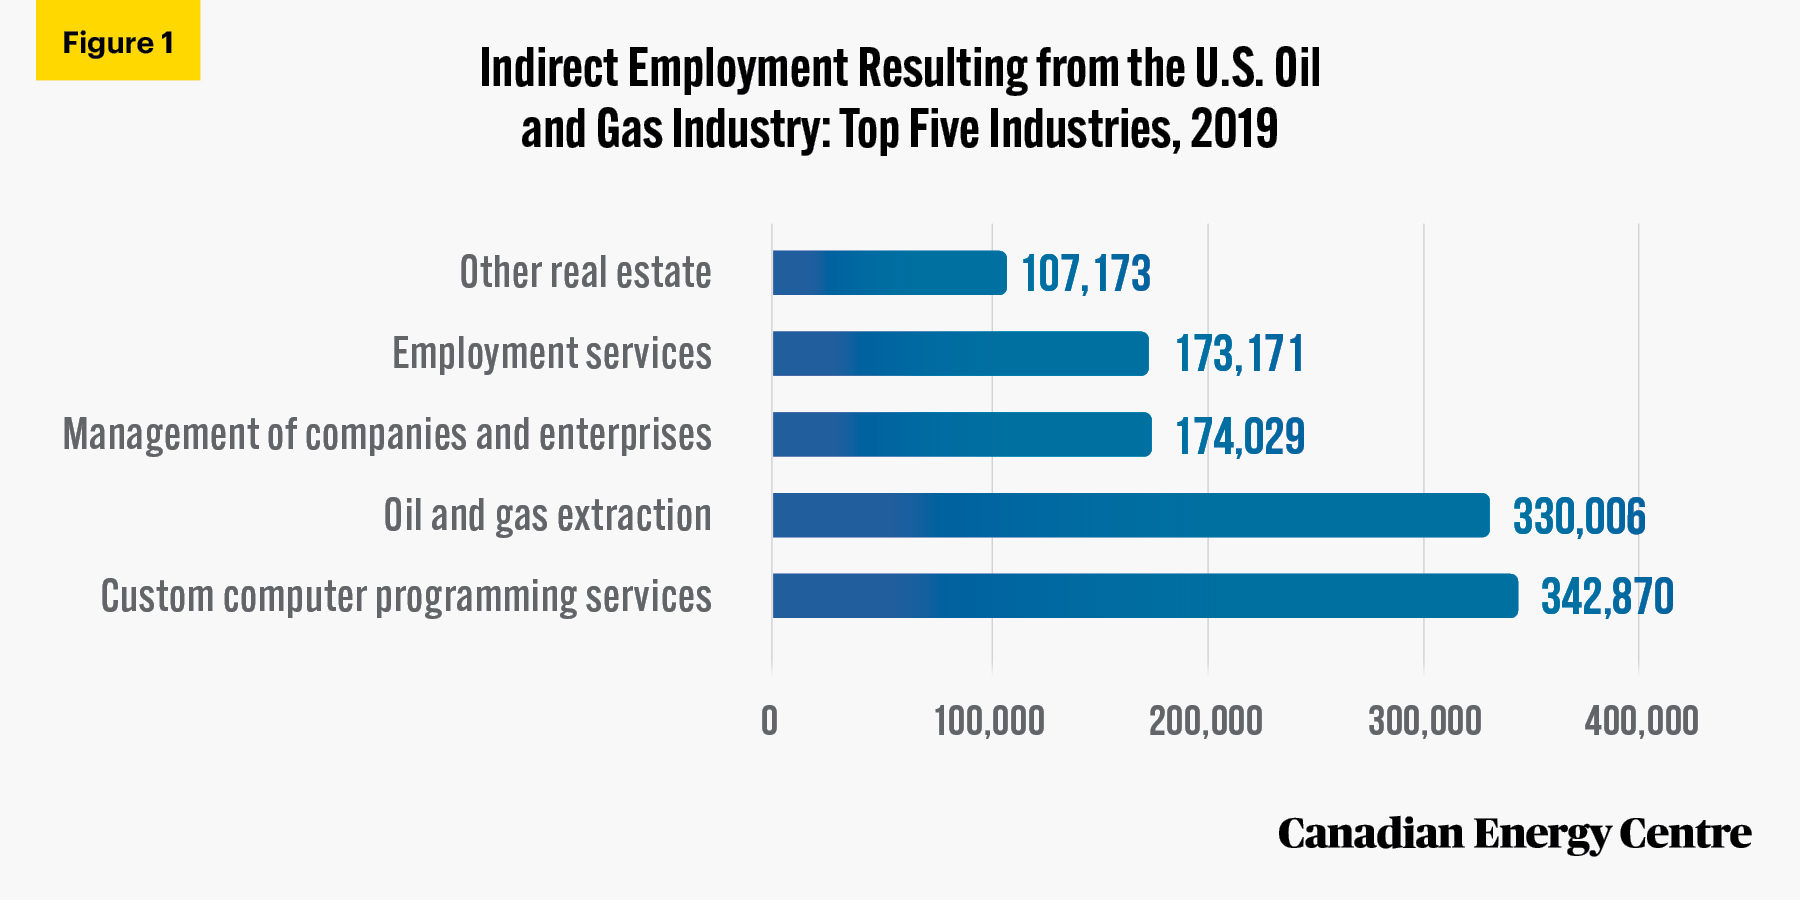
Here, we look at the top five industries that benefit indirectly⁴ from the oil and gas sector. They range from other real estate, which includes the value of operations for residential property managers, lessors of non-residential buildings, and offices of real estate agents and brokers (offering services other than residential leasing) at 107,173 jobs, to custom computer programming services at 342,870 jobs. The top five industries alone accounted for about 1.1 million of the 3 million total indirect jobs that resulted from the U.S. oil and gas industry in 2019 (see Figure 1).
4. Industries that benefit indirectly from oil and gas extraction include those that purchase goods and services throughout the oil and gas industry supply chain. For a detailed explanation of the oil and gas industry supply chain, see “Appendix: Definitions” at the end of this brief.
Source: IMPLAN, 2021.
Employee compensation: $140.9 billion direct and $215.2 billion indirect totaling $356.1 billion
In 2019, the U.S. oil and gas sector generated $140.9 billion in direct employee compensation. However, each direct dollar of employee compensation supported an additional $1.53 in indirect employee compensation elsewhere in the U.S. economy that year, or another $215.2 billion.
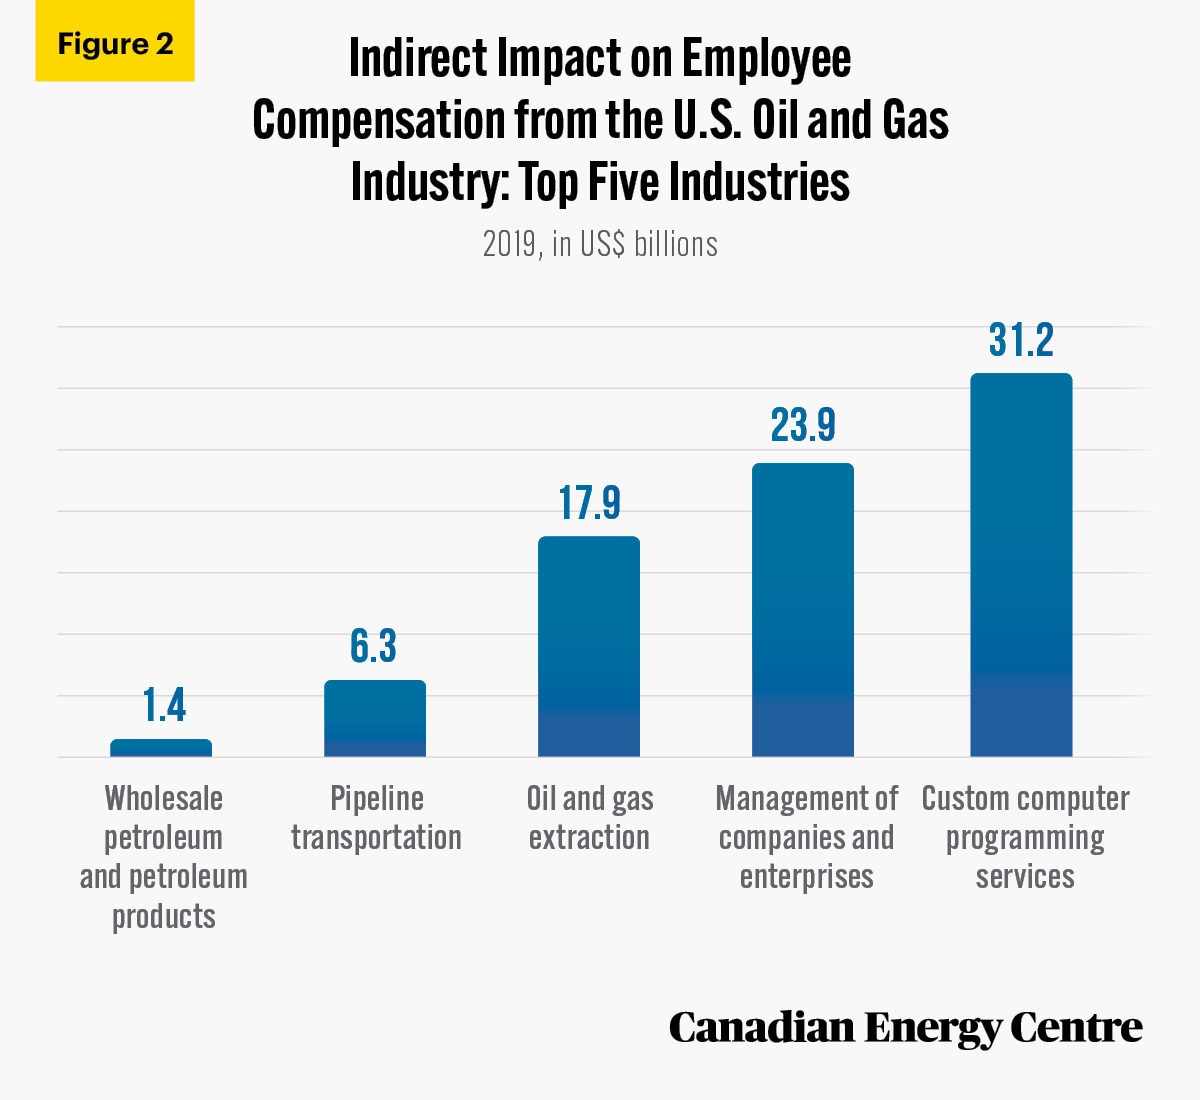
The top five industries that received indirect employee compensation from the oil and gas sector ranged from wholesale petroleum and petroleum products at $1.4 billion to custom computer programming services at $31.2 billion, with pipeline transportation, oil and gas extraction, and management of companies and enterprises in between those totals. The top five industries alone accounted for $81 billion of the $215 billion in total indirect employee compensation that resulted from the U.S. oil and gas industry (see Figure 2).
Source: IMPLAN, 2021.
U.S. oil and gas industry’s direct and indirect value-added/GDP: $985 billion
The direct value-added/GDP (see “Appendix: Definitions”) of the oil and gas sector was worth $486 billion in 2019. Each direct dollar of value added/GDP in the U.S. oil and gas industry supported an additional $1.03 of indirect value-added/GDP elsewhere in the U.S. economy in 2019, or $498 billion.
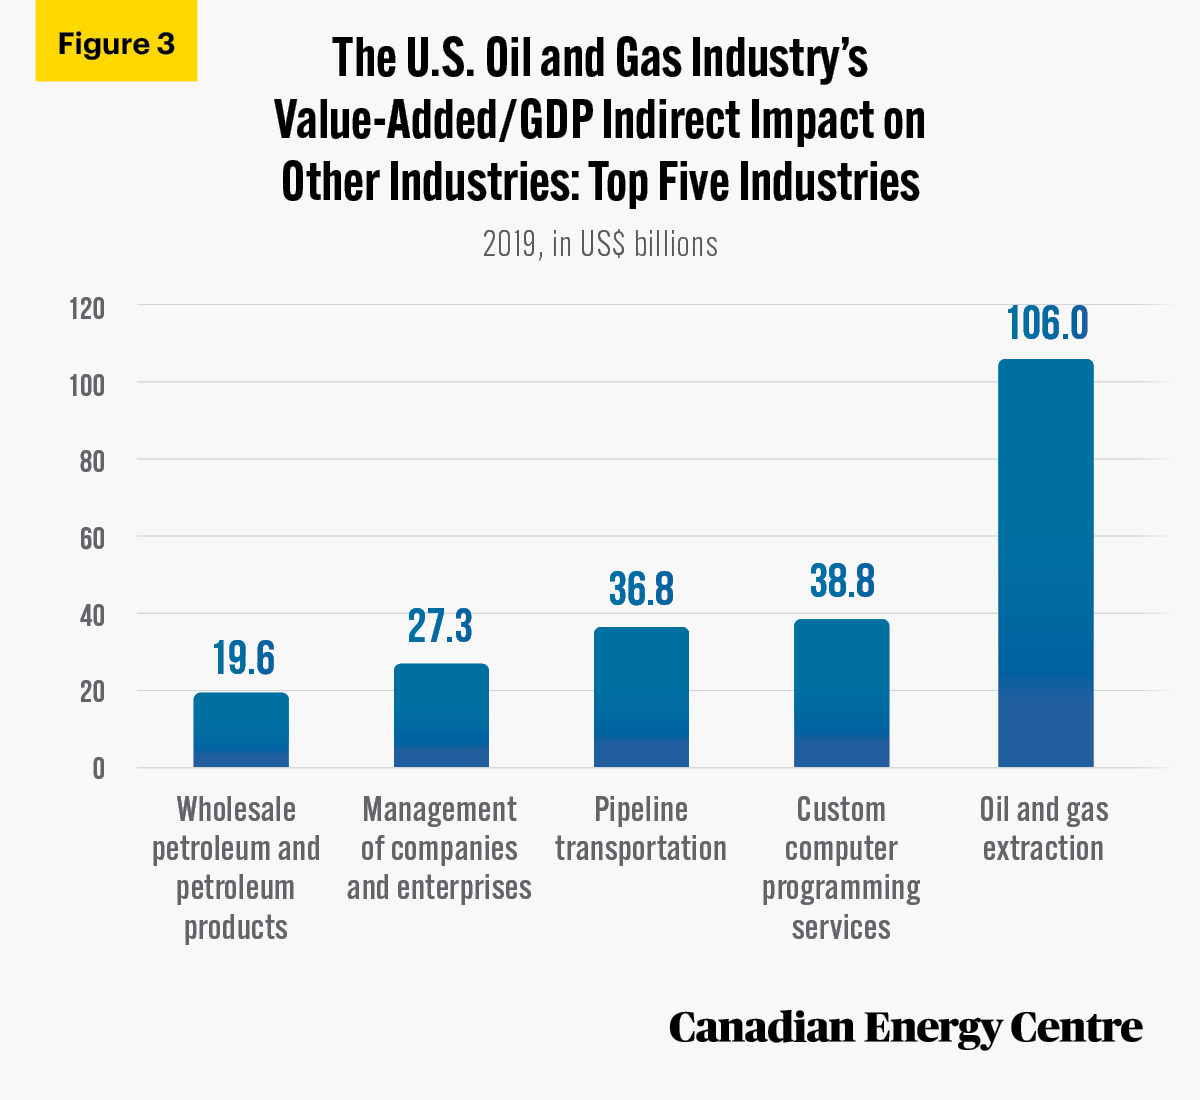
The top five industries for indirect value-added/GDP ranged from wholesale petroleum and petroleum products ($19.6 billion) to oil and gas extraction ($106.0 billion), with custom computer programming services, pipeline transportation, and management of companies and enterprises within that range. In total, the indirect value-added/GDP impact from the oil and gas sector on these five sectors alone was nearly $229 billion of the $498 billion in total indirect value-added/GDP from the U.S. oil and gas industry (see Figure 3).
Source: IMPLAN, 2021.
Direct and indirect output in the U.S. economy: Over $2.1 trillion
The “output” of an industry is the value of goods and services that industry produces. For the U.S. oil and gas industry, the direct output value was over $1.2 trillion in 2019. In addition, each direct dollar of output in the industry supported an additional 78 cents of indirect output elsewhere in the U.S. economy, or $936 billion in 2019, for a total direct and indirect output value of over $2.1 trillion.
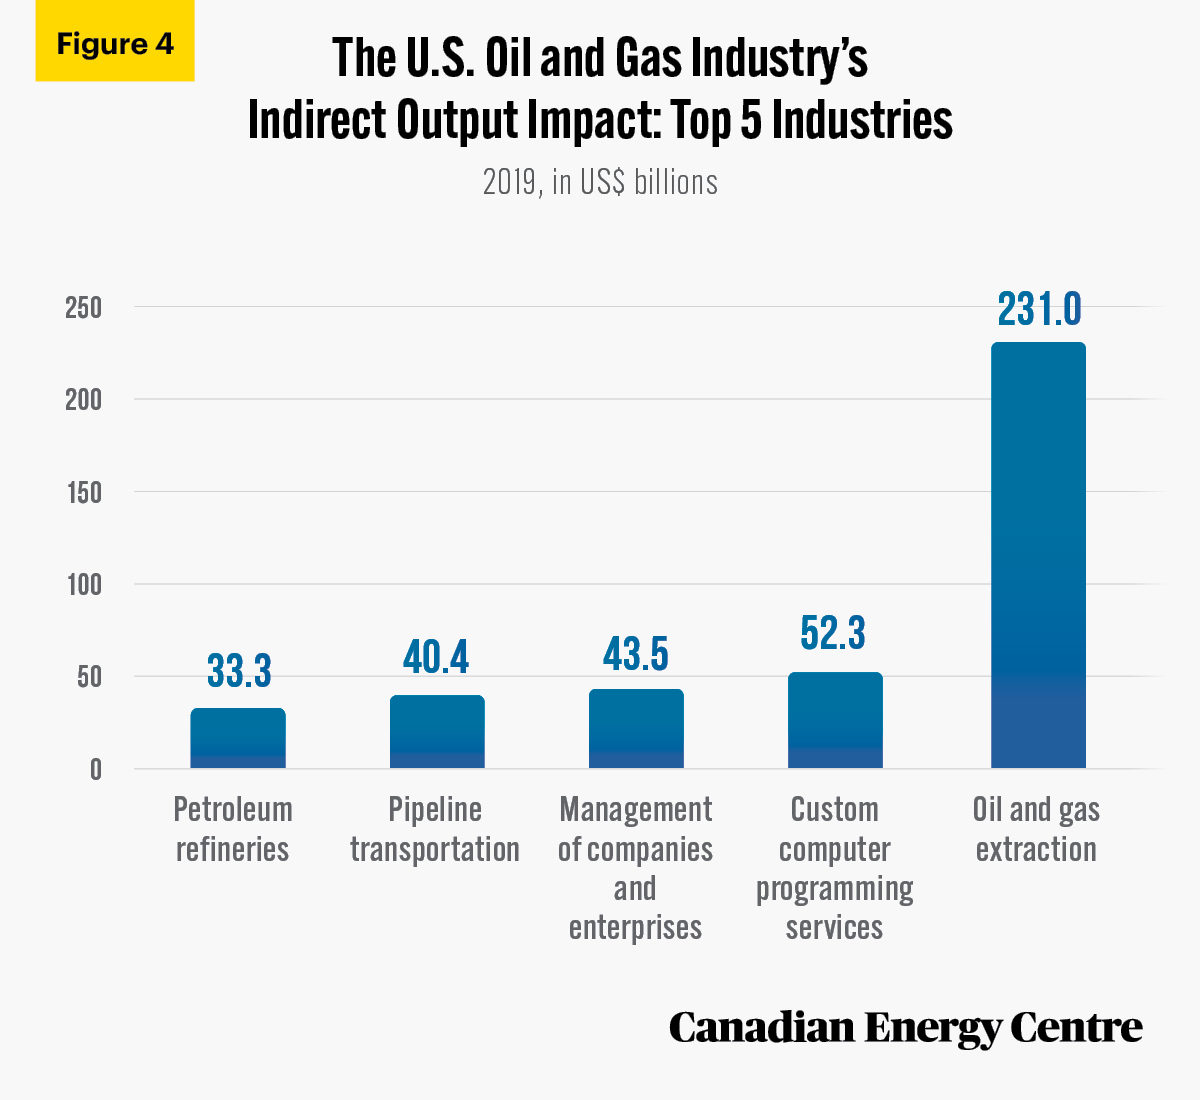
In 2019, the top five industries whose indirect output was attributable to the U.S. oil and gas sector range from petroleum refineries ($33.3 billion) to oil and gas extraction ($231.0 billion) with custom computer programming services, management of companies and enterprises, and pipeline transportation ($40.4 billion) within that range. The total indirect impact on just these five industries alone is over $400 billion of the $936 billion in total indirect output of the U.S. oil and gas industry (see Figure 4).
Source: IMPLAN, 2021.
Conclusion
The U.S. oil and gas industry plays a significant role in the broad U.S. economy, employing over 5 million people, providing over $356 billion in employee compensation, contributing nearly $985 billion to value-added/GDP, and generating over $238 billion in taxes for federal, state, and county governments.
The operations of the U.S. oil and gas industry generate spin-off effects for the whole U.S. economy.
- Each direct job in the U.S. oil and gas industry supported an additional 1.51 indirect jobs elsewhere in the American economy in 2019.
- Each direct dollar of employee compensation in the U.S. oil and gas industry supported an additional $1.53 in indirect employee compensation elsewhere in the U.S. economy in 2019.
- Each direct dollar of value added/GDP in the U.S. oil and gas industry supported an additional $1.03 of indirect valueadded/GDP elsewhere in the U.S. economy in 2019.
- Each direct dollar of taxes generated in the U.S. oil and gas industry supported an additional $1.12 of indirect taxes elsewhere in the U.S. economy in 2019.
Appendix: Definitions (IMPLAN, 2021)
Total output equals the value of Industry production, which is equal to sales plus net inventory change.
Value-added-GDP represents the difference between output and the cost of intermediate inputs throughout a defined economy during a specified period of time. Value-added is equivalent to the industry’s contribution to GDP.
Exports are a component of final demand and measure the value of goods and services that are produced in one region and sold to another. Foreign exports flow to countries outside the U.S. while domestic exports flow to other regions within the United States. Exports of goods and services include sales, barter, or gifts or grants of goods and services from residents to non-residents.
Employee compensation is the total payroll cost of an employee including wages and salaries, all benefits (e.g., health and retirement), and payroll taxes.
Labour income is the sum of employee compensation (wages and benefits) and proprietor income. Labour income represents the total value of all forms of employment income paid in a specific economy during a specified period of time. It reflects the combined cost of total payroll paid to employees (i.e., wages and salaries, benefits, payroll taxes) and payments received by self-employed individuals and/or unincorporated business owners across that economy.
Proprietor income consists of payments received by selfemployed individuals and unincorporated business owners. More specifically, it represents the current production income of sole proprietorships, partnerships, and tax-exempt cooperatives. It excludes dividends, monetary interest received by nonfinancial business, and rental income received by persons not primarily engaged in the real estate business. Note that labour income can be negative if there is a net loss to the proprietor.
Taxes capture all tax revenue in an economy across all levels of government (county, state, and federal) that exist in that area for the specific industry. Sub County General includes city and township governments while Sub County Special includes fire and public school districts.
Oil and gas extraction comprises establishments that operate and/or develop oil and gas field properties. Such activities may include exploration for crude petroleum and natural gas; drilling, completing, and equipping wells; operating separators, emulsion breakers, desilting equipment, and field gathering lines for crude petroleum and natural gas; and all other activities in the preparation of oil and gas up to the point of shipment from the producing property. The also include the production of crude petroleum, the mining and extraction of oil from oil shale and oil sands, and the production of natural gas, sulphur recovery from natural gas, and recovery of hydrocarbon liquids. Establishments include those that operate oil and gas wells on their own account or for others on a contract or fee basis.
Drilling oil and gas wells comprises establishments primarily engaged in drilling oil and gas wells for others on a contract or fee basis. This includes contractors that specialize in spudding in, drilling in, redrilling, and directional drilling.
Support activities for oil and gas operations includes establishments primarily engaged in performing support activities on a contract or fee basis for oil and gas operations (except site preparation and related construction activities). Services included are exploration (except geophysical surveying and mapping); excavating slush pits and cellars, well surveying; running, cutting, and pulling casings, tubes, and rods; cementing wells, shooting wells; perforating well casings; acidizing and chemically treating wells; and cleaning out, bailing, and swabbing wells.
Natural gas distribution comprises (1) establishments primarily engaged in operating gas distribution systems (e.g., mains, meters); (2) establishments known as gas marketers that buy gas from the well and sell it to a distribution system; (3) establishments known as gas brokers or agents that arrange the sale of gas over gas distribution systems operated by others; and (4) establishments primarily engaged in transmitting and distributing gas to final consumers. Both privately and publicly owned establishments are included.
Petroleum refineries comprise establishments primarily engaged in refining crude petroleum into refined petroleum. Petroleum refining involves one or more of the following activities: (1) fractionation; (2) straight distillation of crude oil; and (3) cracking.
Petroleum lubricating oil and grease manufacturing comprises establishments primarily engaged in blending or compounding refined petroleum to make lubricating oils and greases and/or re-refining used petroleum lubricating oils.
Pipeline transportation includes establishments that transport products such as crude oil, natural gas, refined petroleum products, and slurry through transmission pipelines. It also includes the storage of natural gas because the storage is usually done by the pipeline establishment and because a pipeline is inherently a network in which all the nodes are interdependent.
Oil and gas industry includes establishments engaged in oil and gas extraction, drilling oil and gas wells, support activities for oil and gas operations, natural gas distribution, petroleum refineries, petroleum lubricating oil and grease manufacturing, pipeline transportation, petroleum and petroleum products merchant wholesalers, and retail gasoline stations. The U.S. oil and gas industry also includes activities related to asphalt paving mixture and block manufacturing, asphalt shingle and coating materials manufacturing, and fuel dealers. Unfortunately, due to methodological differences between NAICS and IMPLAN (see About the IMPLAN model” below), these activities are difficult to separate out for the oil and gas industry and are not included in this analysis. Thus, the direct and indirect impacts of the U.S. oil and gas industry detailed in this CEC Fact Sheet are somewhat understated.
Oil and gas industry supply chain includes domestic and international transport, trading, shipping, ordering, and inventory visibility and control. Other supply chain elements include material handling, import/export facilities, and the distribution of refined energy products from points of origin to market. Typically, the supply chain is divided into three segments. The upstream segment finds and produces crude oil and natural gas. The midstream segment handles the processing, storing and transporting of energy commodities. And the downstream segment encompasses oil refineries, retail outlets and natural gas distribution companies.
Notes
This CEC Fact Sheet was compiled by Lennie Kaplan and Mark Milke at the Canadian Energy Centre (www.canadianenergycentre.ca). Percentages in this report are calculated from the original data, which can run to multiple decimal points. They are not calculated using the rounded figures that may appear in charts and in the text, which are more reader friendly. Thus, calculations made from the rounded figures (and not the more precise source data) will differ from the more statistically precise percentages we arrive at using source data. The authors and the Canadian Energy Centre would like to thank and acknowledge the assistance of Dennis Sundgaard in reviewing the data and research for this Fact Sheet. Image credits: Terry McGraw
About the IMPLAN model
IMPLAN combines a set of extensive databases, economic factors, multipliers, and demographic statistics with a highly refined, customizable modeling system. IMPLAN allows detailed insights into an industry’s contribution to the U.S. and its states and counties. The U.S. oil and natural gas industry encompasses many activities that span separate industry classifications under the North American Industry Classification System (NAICS) and IMPLAN. In this report, the oil and gas industry is defined to include oil and natural gas extraction, drilling of oil and gas wells, support activities for oil and gas, petroleum refining, pipeline transportation, natural gas distribution, petroleum lubricating oil and grease manufacturing, wholesale petroleum and petroleum products, and retail gasoline stores. The U.S. oil and gas industry also includes activities related to asphalt paving mixture and block manufacturing, asphalt shingle and coating materials manufacturing, and fuel dealers. Unfortunately, due to methodological differences between NAICS and IMPLAN, these latter activities are difficult to separate out for the oil and gas industry and are not included in this analysis. Thus, the direct and indirect impacts of the U.S. oil and gas industry in this CEC Fact Sheet are somewhat understated.
References (All links live as of June 8, 2021)
American Petroleum Institute (2017), Impacts of the Natural Gas and Oil Industry on the US Economy in 2015 <https://bit.ly/2R3R4yh>; Canadian Energy Research Institute (2019), Canadian Oil Sands Supply Costs and Development Projects (2019-2039) <https://bit.ly/3qczWmX>; Enbridge (undated), Line 3 Replacement Project <https://bit.ly/2SRvu0x>; IMPLAN (2021), Oil and Gas Industry: Regions and Results, Custom Tabulation <https://bit.ly/3oPIdN4>; Morning Consult (2019), North American Energy Security Depends on Modern Pipeline Expansion <https://bit.ly/3oNX3nf>.
Creative Commons Copyright
Research and data from the Canadian Energy Centre (CEC) is available for public usage under creative commons copyright terms with attribution to the CEC. Attribution and specific restrictions on usage including non-commercial use only and no changes to material should follow guidelines enunciated by Creative Commons here: Attribution-NonCommercial-NoDerivs CC BY-NC-ND.