
Social
To sign up to receive the latest Canadian Energy Centre research to your inbox email: research@canadianenergycentre.ca
Download the PDF here
Download the charts here
Executive Summary
The flow of trade between Canada and the United States in energy over the past two decades has been significant and is critical to maintaining North America’s continuing energy security.
Over the past two decades, the cumulative aggregate value of the energy products trade between Canada and the United States was $1.96 trillion, including $138 billion in 2019.
Source: Statistics Canada, Table 12-10-0133-01
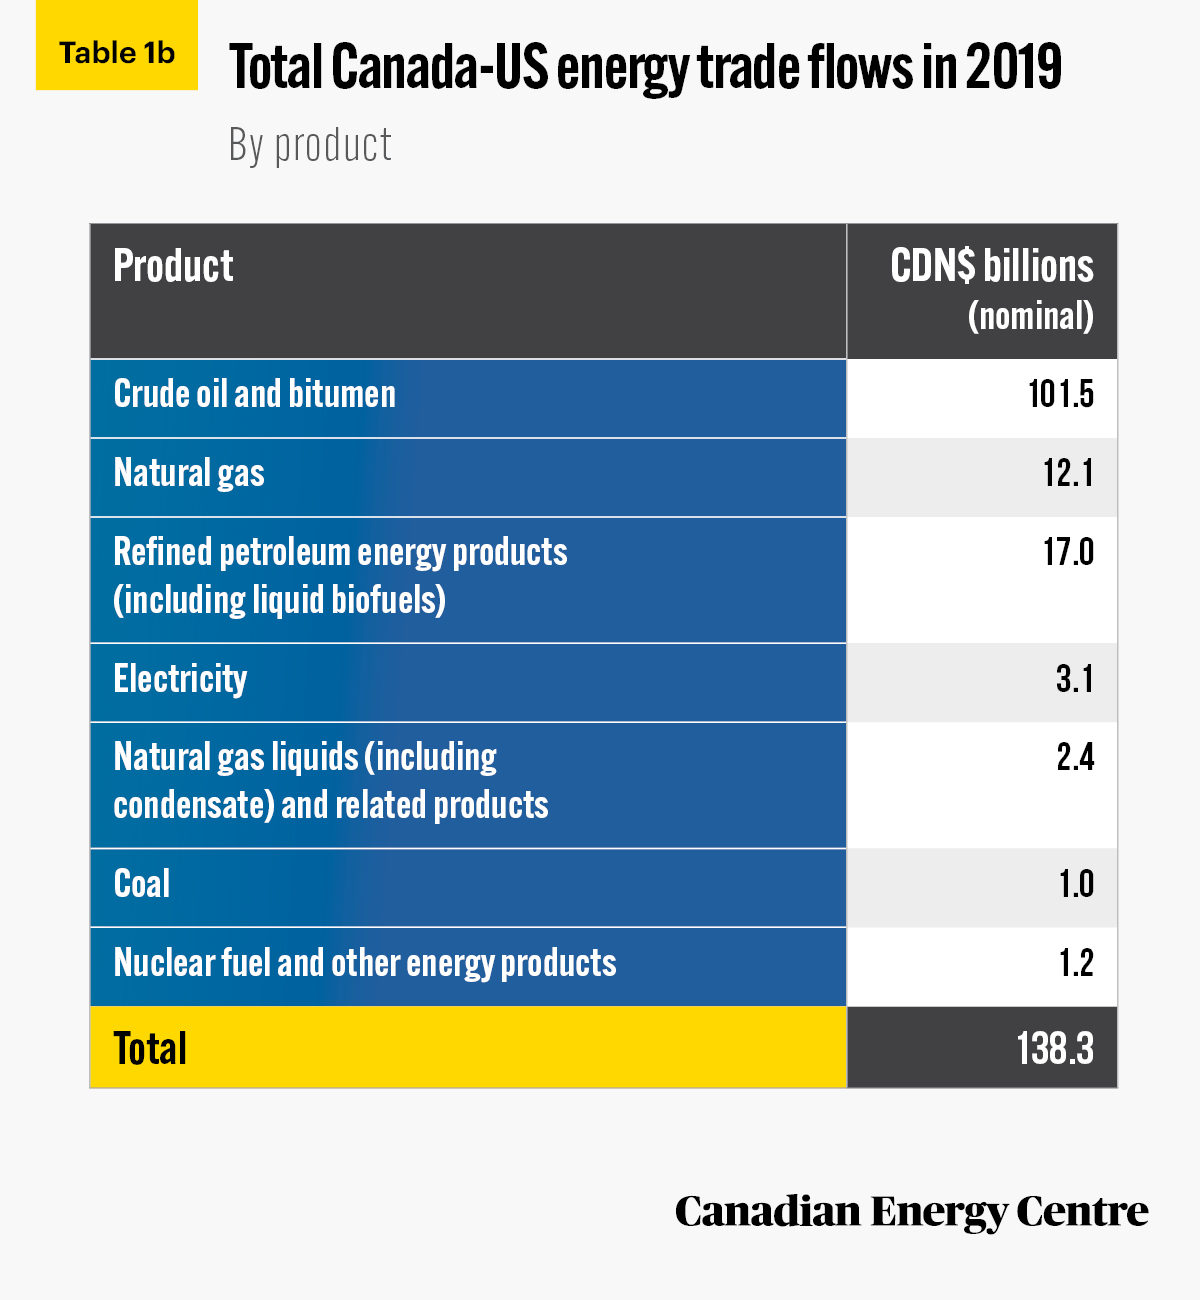
- Crude oil (including bitumen) has been the largest commodity in the Canada-United States energy products trade flow; a total of $1.12 trillion in crude oil and bitumen has flowed between the two countries from 2000 to 2019, including $101.5 billion in 2019.
- The second largest commodity in the Canada-United States energy products trade flow over the past two decades is natural gas; a cumulative total trade value of $426.3 billion in that product has passed between the two countries, including $12.1 billion in 2019.
- The third largest commodity in the Canada-United States energy products trade flow is refined petroleum energy products with a cumulative trade value of $253.7 billion between 2000 and 2019, including $17 billion in 2019. (Refined petroleum energy products replaced natural gas in second place as of 2019).
Cross-border pipelines transport crude oil, bitumen, refined petroleum products, and natural gas between Canada and the United States, and the construction of new projects such as the Line 3 Replacement and Keystone XL (currently shelved by the Biden Administration) will be critical to maintaining these energy trade flows.
Source: Statistics Canada, Table 12-10-0133-01.
Overview
The trade in energy products between Canada and the United States has been instrumental to the growth and prosperity of both countries over the past two decades, and in fact each country has done a great deal of work to harmonize approaches and standards. For example, as the Centre for Strategic and International Studies (CSIS) notes:
for decades, as part of the quest for greater energy security, the United States and Canada, along with Mexico, have worked together to cultivate the kind of economic and security advantages that come with an integrated, close-proximity market for energy trade. Trade arrangements have been signed, cross-border infrastructure has been built, various consultative working groups, mechanisms, and dialogues were formed to raise energy policy and regulatory issues, and even efforts have been made to harmonize standards relating to electricity reliability and security, offshore drilling safety, and a host of other issues. (Centre for Strategic and International Studies, 2018)
Maintaining and enhancing North American energy security should be a policy priority for the Biden administration. Canadian-American energy trade is closely intertwined and supports the goals and objectives of North American energy security, including the development of sustainable economic and environmental policies.
This CEC Research Brief examines trends in energy products trade flows between Canada and the United States over the past two decades to illustrate the importance of maintaining the bi-lateral relationship to bolster North America’s future energy security.
Total Canada-U.S. trade flows in energy products: Nearly $2 trillion over the past two decades
Over the past two decades, the cumulative aggregate value¹ of the trade in energy products between Canada and the United States was $1.96 trillion², or an average of nearly $98 billion per year³. Energy products include crude oil and crude bitumen; natural gas, natural gas liquids and related products; refined petroleum energy products; coal; nuclear fuel, and other energy; and electrical energy.
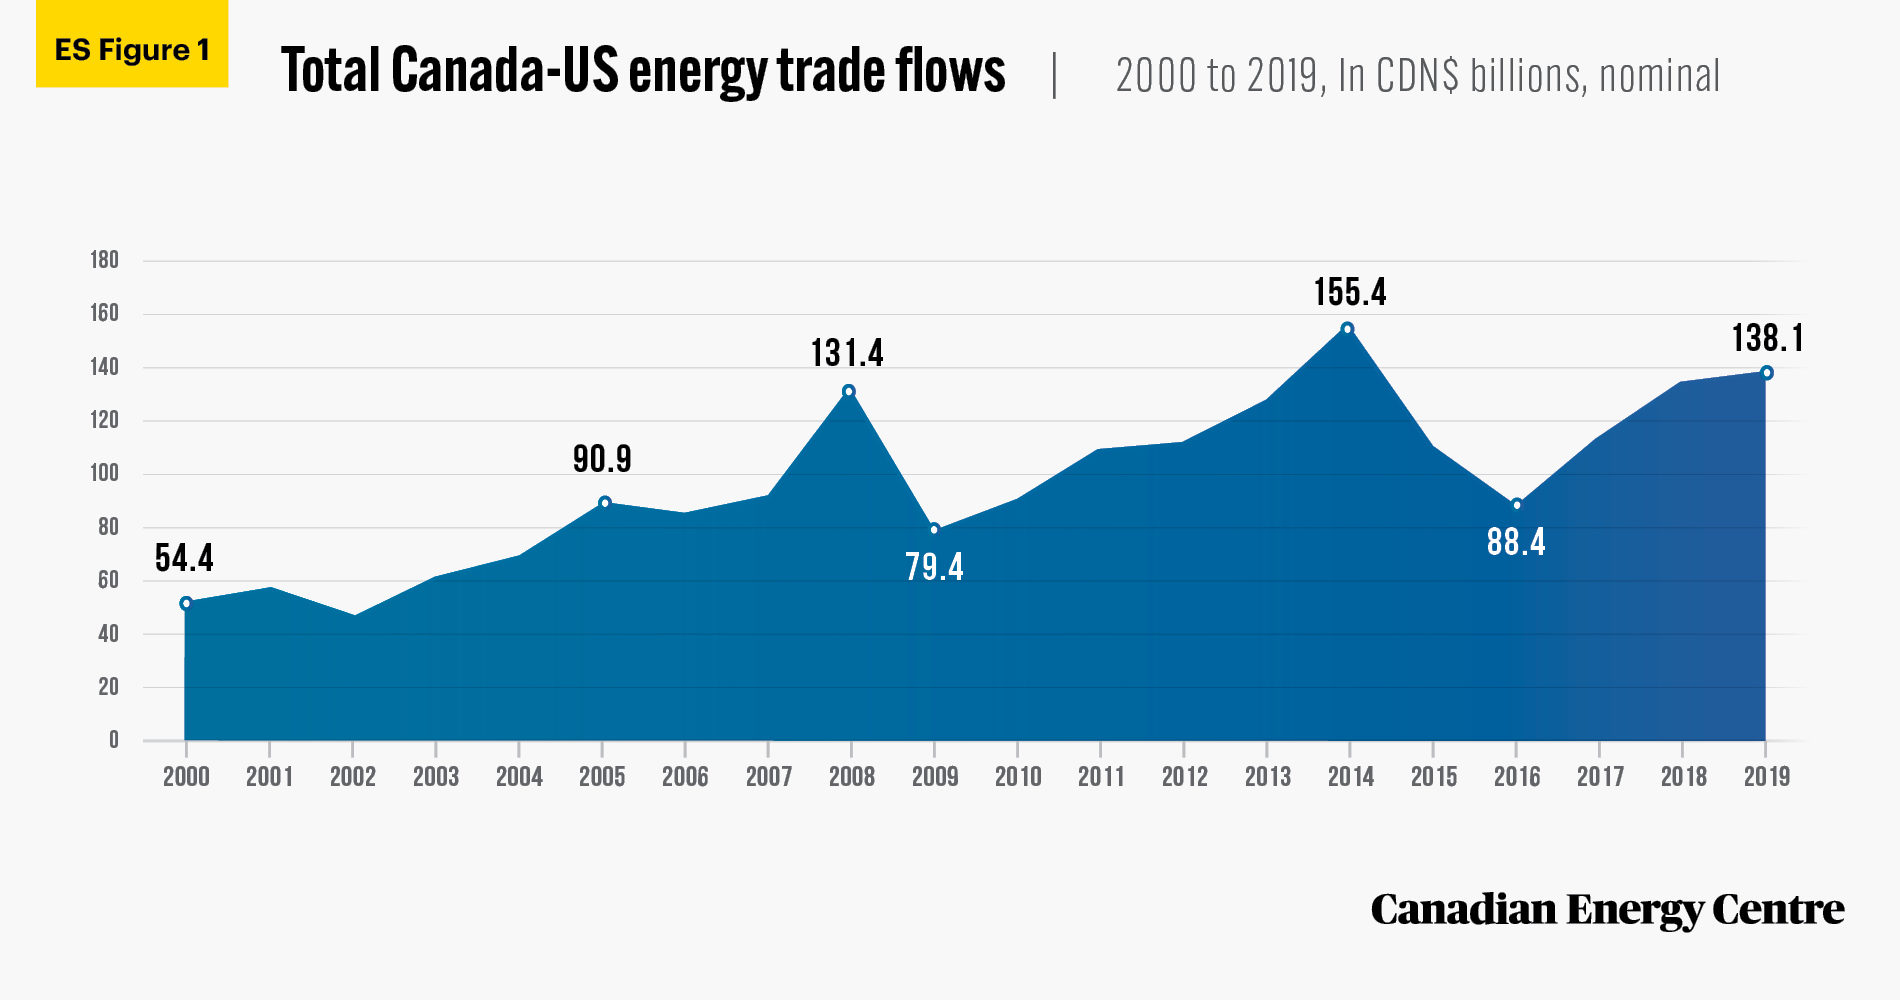
- In 2019, the aggregate value of energy products trade (imports and exports) between Canada and the United States was over $138 billion (see Figure 1a).
- The aggregate value of the trade in energy products between Canada and the United States grew from $54.4 billion in 2000 to $155.4 billion in 2014, sliding back to $88.4 billion in 2016 as the result of the economic downturn and lower energy prices, before rising to $138.1 billion in 2019.
- Overall, between 2000 and 2019, the value of the energy products trade between the two countries increased by nearly 154 per cent.
1. Energy product values can fluctuate dramatically due to the changes in prices of energy commodities, with the price of oil having the most significant impact on these values.
2. Figures in this Research Brief are in nominal dollars.
3. Note that all percentages in this report are calculated from the original data which can run to multiple decimal points. They are not calculated using the rounded figures that may appear in charts and in the text, which are more reader-friendly. Thus, calculations made from the rounded figures (and not the more precise source data) will differ from the more statistically precise percentages we arrive at using source data.

Source: Statistics Canada, Table 12-10-0133-01
Energy products sales from Canada to the US
Over the past two decades, the cumulative aggregate value of exports of energy products from Canada to the United States was nearly $1.69 trillion, or an average of over $84.5 billion per year.
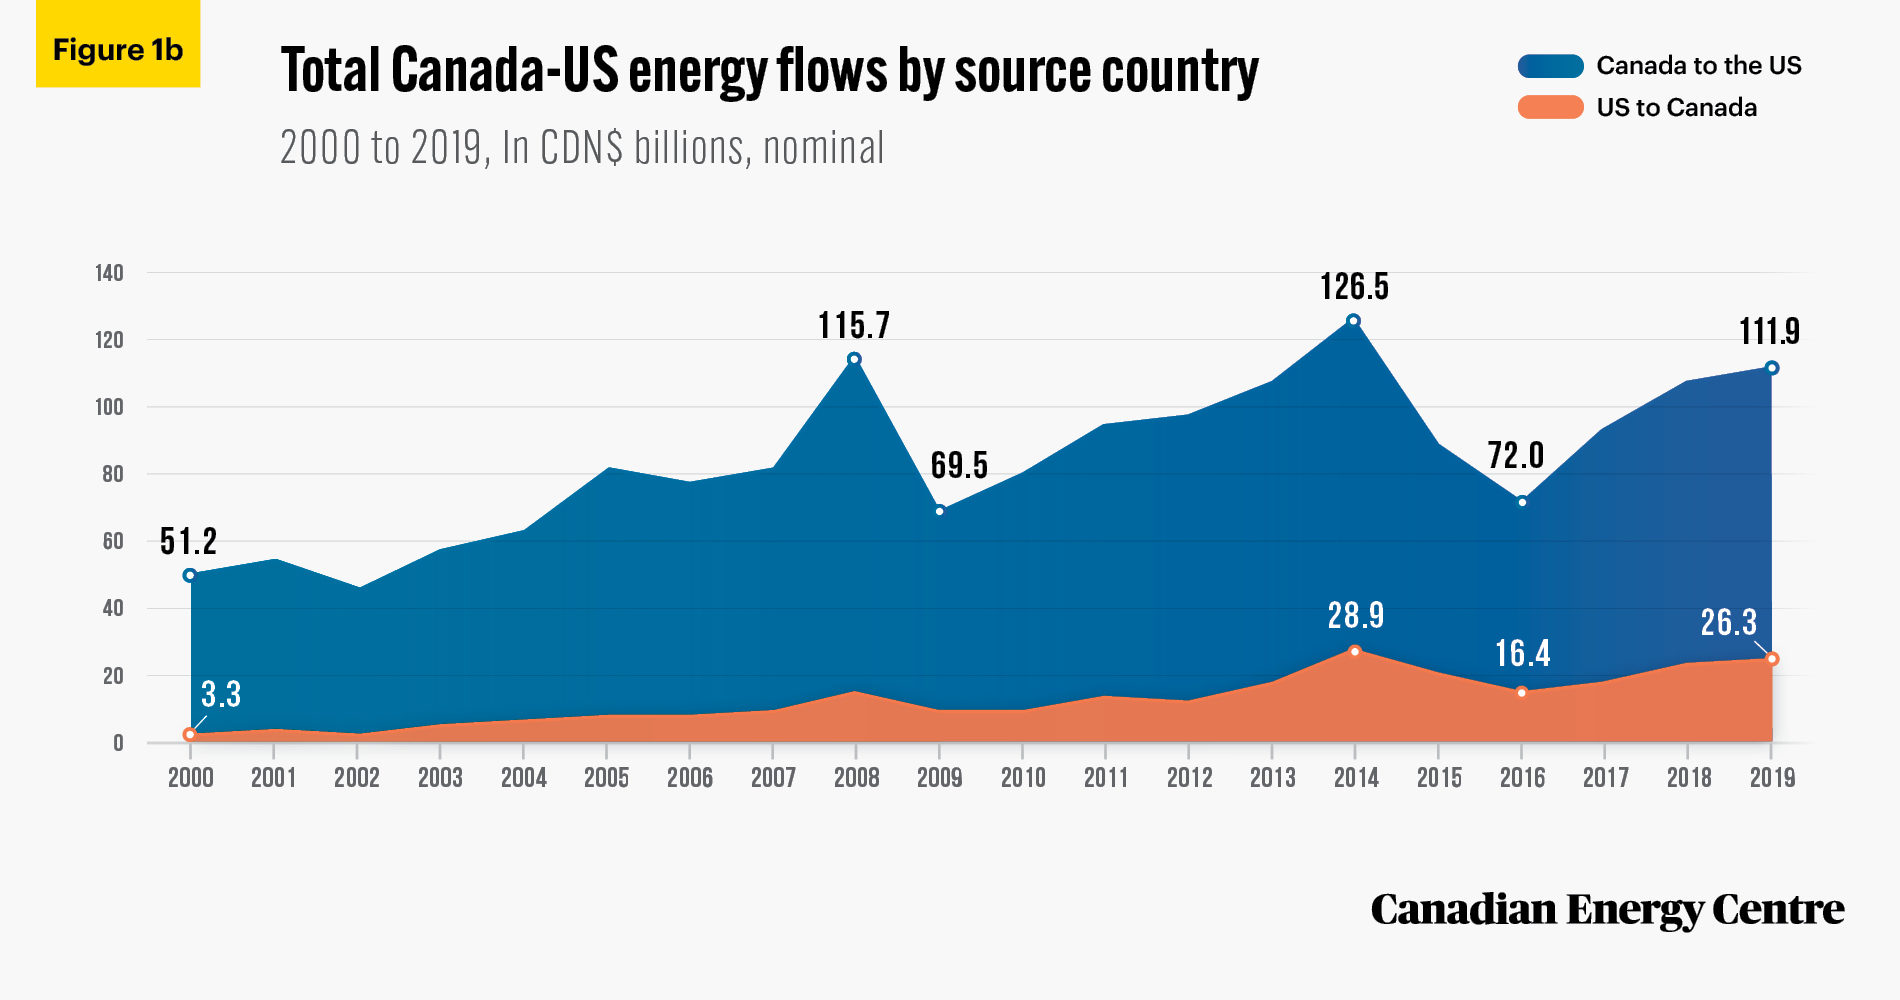
- In 2019 alone, the value of energy exports from Canada to the United States was nearly $111.9 billion.
- The value of energy exports from Canada to the United States grew from $51.2 billion in 2000 to $126.5 billion in 2014, sliding back to $72 billion in 2016 before rising to $111.9 billion in 2019 (see Figure 1b).
- Overall, between 2000 and 2019, the value of energy exports from Canada to the United States increased by nearly 119 per cent.
Energy products sales from the US to Canada
Over the past two decades, the cumulative aggregate value of exports of energy products from the United States to Canada was over $271.8 billion, or an average of about $13.6 billion per year.
- In 2019 alone, the value of energy exports from the United States to Canada was nearly $26.3 billion (see Figure 1b).
- The aggregate value of energy exports from the United States to Canada grew from nearly $3.3 billion in 2000 to $28.9 billion in 2014, sliding back to $16.4 billion in 2016, before rising to nearly $26.3 billion in 2019.
- Overall, between 2000 and 2019, the value of the energy exports from the United States to Canada increased by about 700 per cent.
Source: Statistics Canada, Table 12-10-0133-01.
Energy products trade by type
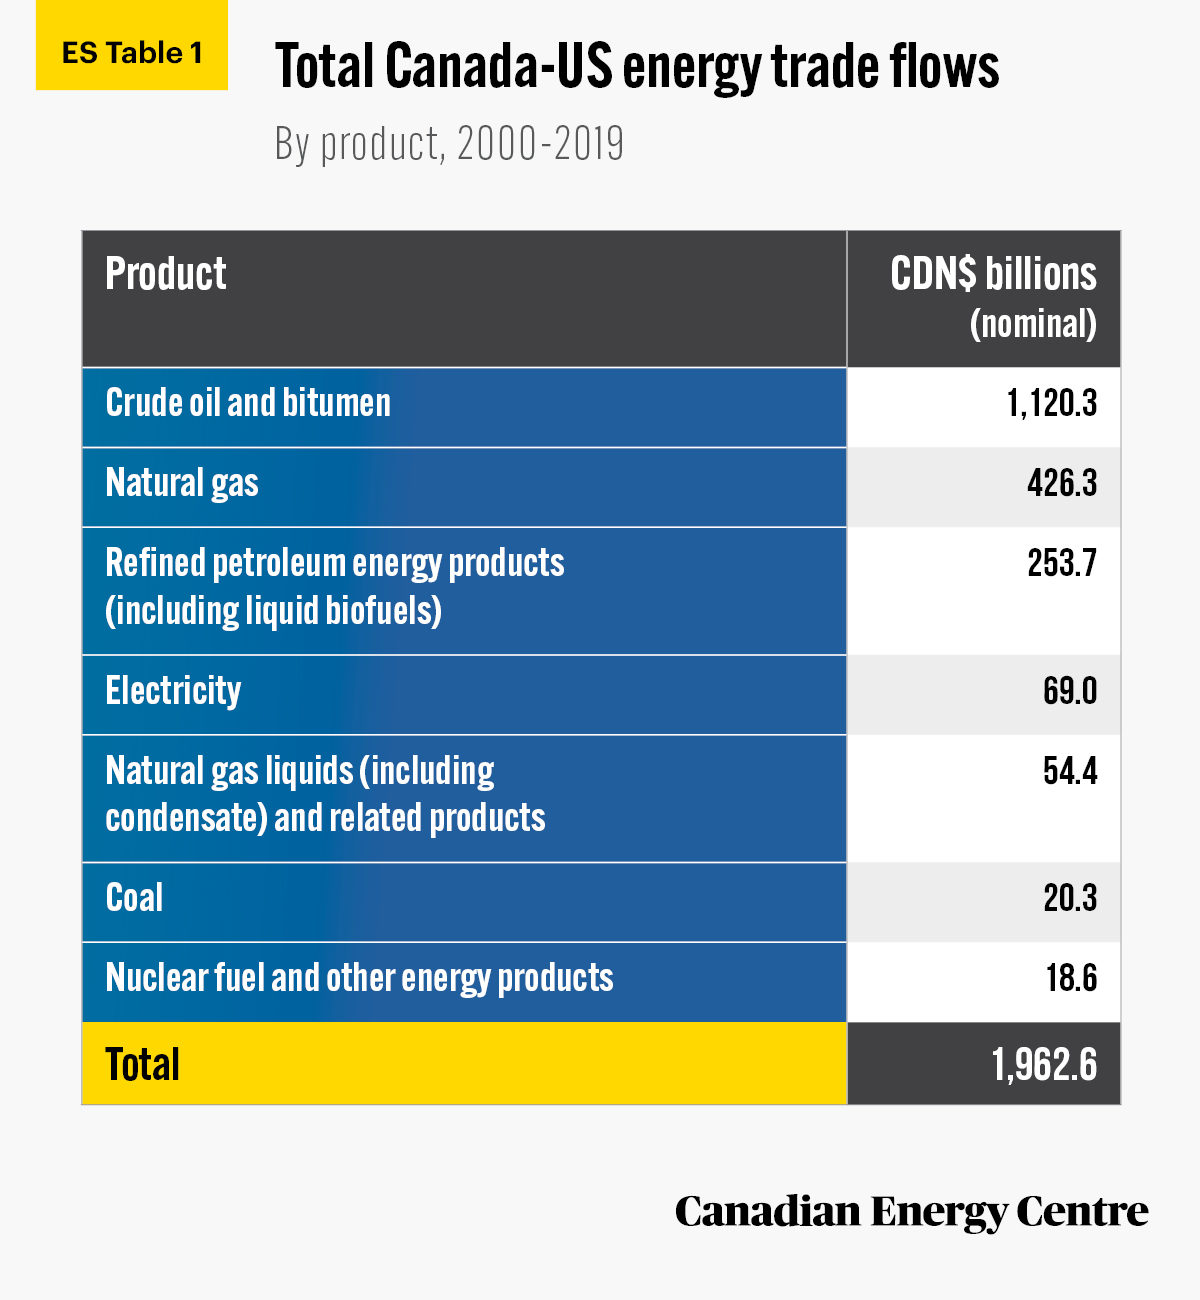
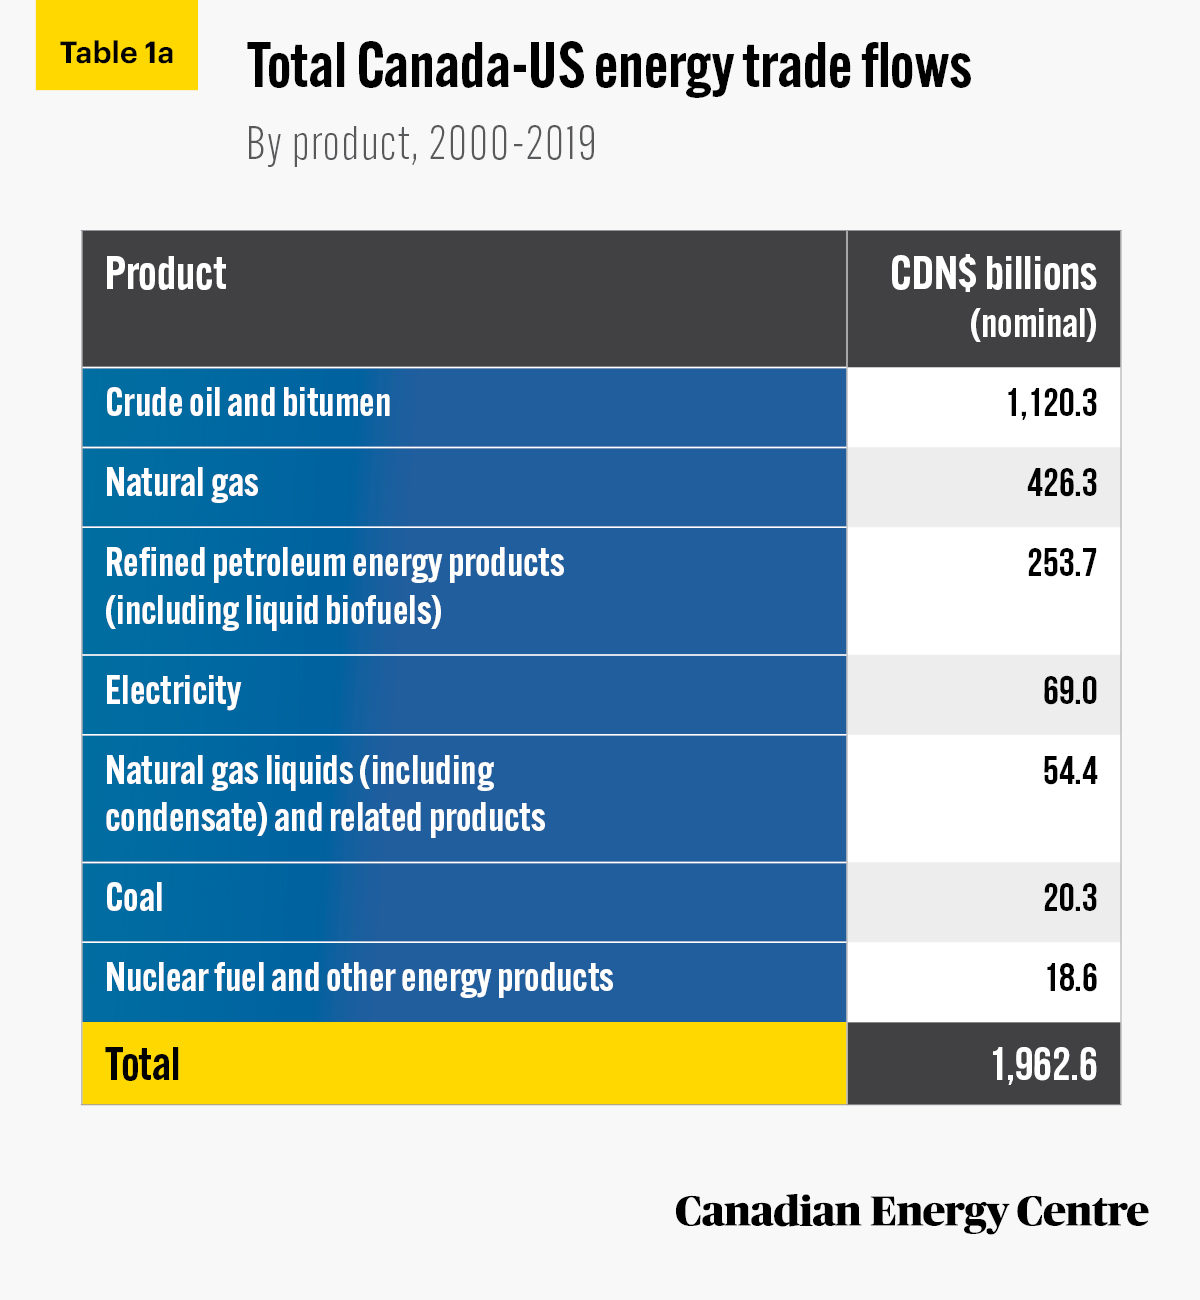
Over the past two decades, crude oil and bitumen was the largest commodity in the Canada-United States energy trade flow at a value of over $1.1 trillion, followed by natural gas ($426.3 billion), and refined petroleum energy products ($253.7 billion) (see Table 1a).
According to the United States Energy Information Administration:
Canada is the largest source of U.S. energy imports and the second-largest destination for U.S. energy exports behind only Mexico. Energy is an important component of trade between Canada and the United States. In 2019, based on the latest annual Standard International Trade Classification (SITC) data from the U.S. Census Bureau, energy accounted for U.S. $85 billion, or 27%, of the value of all U.S. imports from Canada. Crude oil and petroleum products accounted for 91% of the value of U.S. energy imports from Canada and 89% of the value of U.S. energy exports to Canada (US Energy Information Administration, 2020).
Crude oil and bitumen
Over the past two decades, crude oil and bitumen have been the largest commodity in the Canada-United States energy products trade flow at a cumulative aggregate value of $1.12 trillion, including $101.5 billion in 2019 (see Tables 1a and 1b).
- Between 2000 and 2014, the aggregate value of crude oil and bitumen grew from $19.6 billion to $106.1 billion, sliding back to $58.6 billion in 2016 as the result of the economic downturn and low crude oil prices, before rising to over $101.5 billion in 2019.
- Between 2000 and 2019, the aggregate trade value of crude oil and bitumen has increased by over 418 per cent.
Natural gas
The second largest commodity in the Canada-United States energy products trade flow over the past two decades is natural gas at a cumulative aggregate trade value of $426.3 billion including $12 billion in 2019 (see Tables 1a and 1b).
• Between 2000 and 2008, the value of natural gas grew from $20.8 billion to $37.1 billion, sliding back to $10.8 billion in 2016 as the result of falling natural gas prices before rising marginally back to $12.1 billion in 2019.
• In fact, due to falling natural gas prices, the 2008 economic downturn, and the growth in US natural gas production, the value of natural gas exports has fallen by over 42 per cent.
Refined petroleum energy products
The third largest commodity in the Canada-United States energy products trade flow over the past two decades is refined petroleum energy products (including liquid biofuels) at a cumulative aggregate trade value of $253.7 billion, including $17 billion in 2019. Refined petroleum energy products have replaced natural gas in second place as of 2019 (see Tables 1a and 1b).
- Between 2000 and 2008, the aggregate value of refined petroleum energy products (including liquid biofuels) grew from $5.8 billion to $14.4 billion, sliding back to $9.1 billion in 2009, rising to $20.2 billion in 2013, falling back to $12 billion in 2016, and then rising to $17.6 billion in 2019.
- Between 2000 and 2019, the aggregate trade value of refined petroleum energy products (including liquid biofuels) grew by over 193 per cent.
Electricity
The fourth largest commodity in the Canada-United States energy products trade flow over the past two decades is electricity at a cumulative aggregate trade value of $69 billion, including $3.1 billion in 2019 (see Tables 1a and 1b).
- The total value of electricity rose from $621 million to $6.0 billion in 2001, sliding to $2.2 billion in 2012, rising to $3.6 billion in 2014, and falling to $3.1 billion in 2019.
- Between 2002 and 2019, the aggregate trade value of electricity grew by nearly 35 per cent (or 398 per cent between 2000 and 2019).
Other
- Other commodities comprising the Canada-United States energy trade flow over the past two decades include natural gas liquids (NGLs) valued at $54.4 billion, coal at $20.3 billion, and nuclear fuel and other energy products at $18.6 billion (see Tables 1a and 1b).
Source: Statistics Canada, Table 12-10-0133-01.
Source: Statistics Canada, Table 12-10-0133-01.
Energy products trade flows by country
An examination of the trade flow data on the exports and imports of key energy product commodities between Canada and the United States over the past two decades reveals some interesting trends.
Oil flows by country
From Canada to the US: Crude oil and bitumen exports up 354 per cent
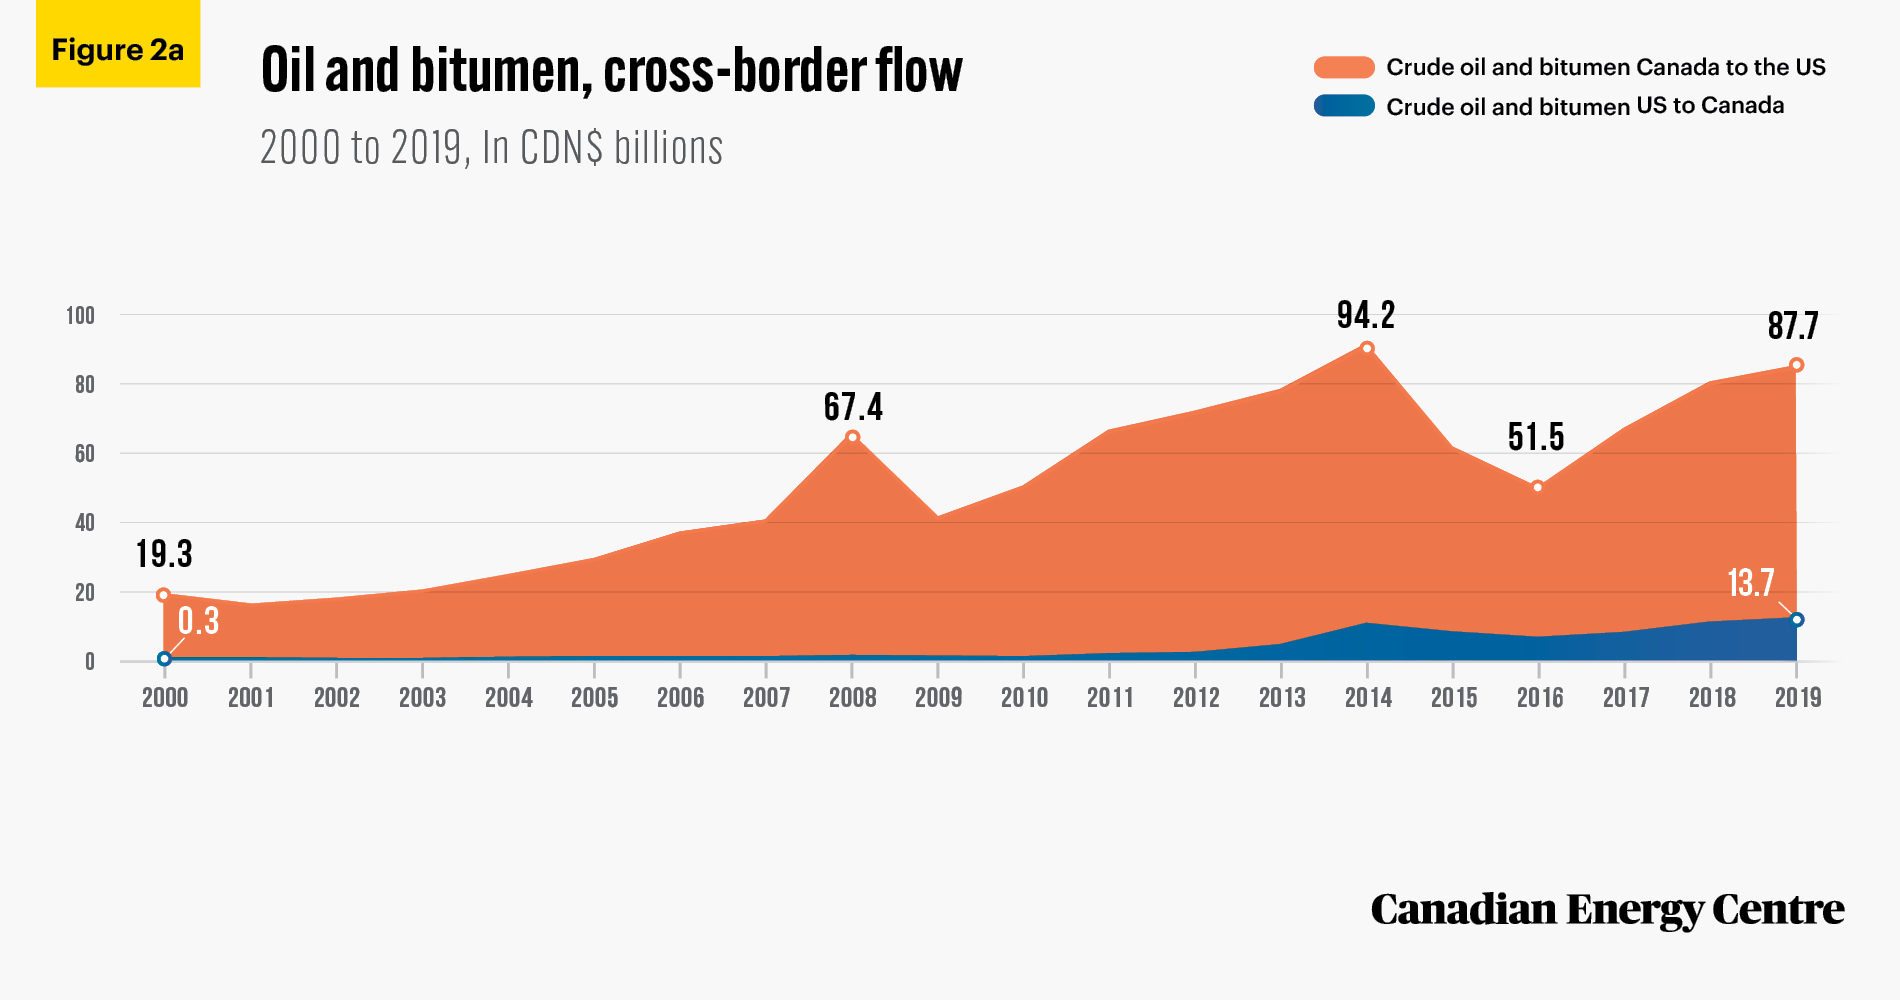
Over the past two decades, the cumulative aggregate value of crude oil and bitumen exports from Canada to the United States was over $1.04 trillion, or an average of $52.1 billion per year.
- The value of crude oil and bitumen exports from Canada to the United States grew from $19.3 billion in 2000 to $94.2 billion in 2014, sliding back to $51.5 billion in 2016 before rising to $87.7 billion in 2019 (see Figure 2a).
- Overall, between 2000 and 2019, the value of crude oil and bitumen exports from Canada to the United States increased by over 354 per cent.
From the US to Canada: Crude oil and bitumen exports up 5,172 per cent
Over the past two decades, the cumulative aggregate value of crude oil and bitumen exports from the United States to Canada was $78.1 billion, or an average of $3.9 billion per year.
- The value of crude oil and bitumen exports from the United States to Canada grew from nearly $300 million in 2000 to $13.7 billion in 2019 (see Figure 2a).
- Overall, between 2000 and 2019, the value of crude oil and bitumen exports from the United States to Canada increased by nearly 5,172 per cent.
Source: Statistics Canada, Table 12-10-0133-01.
Natural gas flows by country
Canada to the US: Natural gas exports down 56 per cent
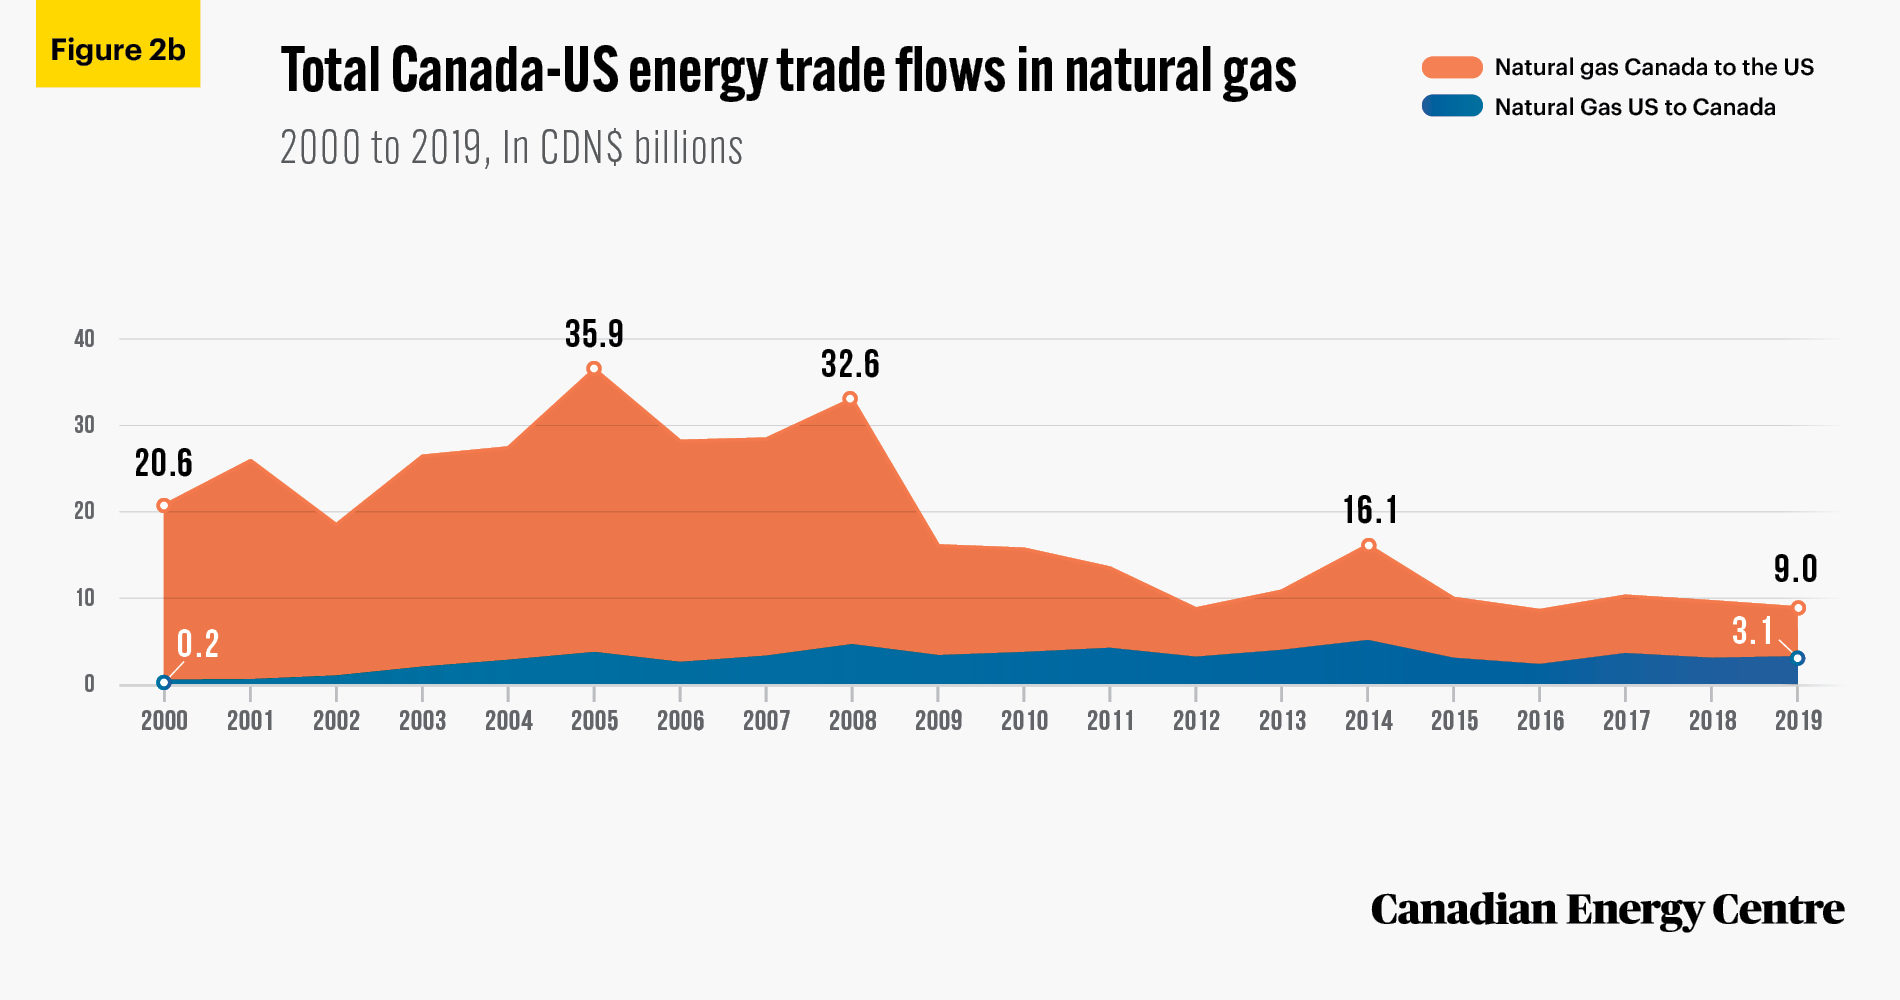
Over the past two decades, the cumulative aggregate value of natural gas exports from Canada to the United States was $370.4 billion, or an average nearly $18.5 billion per year.
- The value of natural gas exports from Canada to the United States grew from nearly $20.6 billion in 2000 to a high of nearly $35.9 billion in 2005, decreasing to $32.6 billion in 2008, before mostly declining in subsequent years, and reaching a low of $9.0 billion in 2019 (see Figure 2b).
- In fact, overall, between 2000 and 2019, the value of natural gas exports from Canada to the United States dropped by over 56 per cent.
From the US to Canada: Natural gas exports up 1,248 per cent
Over the past two decades, the cumulative aggregate value of natural gas exports from the United States to Canada was $55.9 billion, or an average nearly $2.8 billion per year.
- The aggregate value of natural gas exports from the United States to Canada grew from just $227 million in 2000 to nearly $5.0 billion in 2014, before sliding back to just under $3.1 billion in 2019 (see Figure 2b).
- Overall, between 2000 and 2019, the value of natural gas exports from the United States to Canada increased by over 1,248 per cent.
Source: Statistics Canada, Table 12-10-0133-01.
Refined petroleum energy products by country
From Canada to the US: Refined petroleum energy products exports up 100 per cent
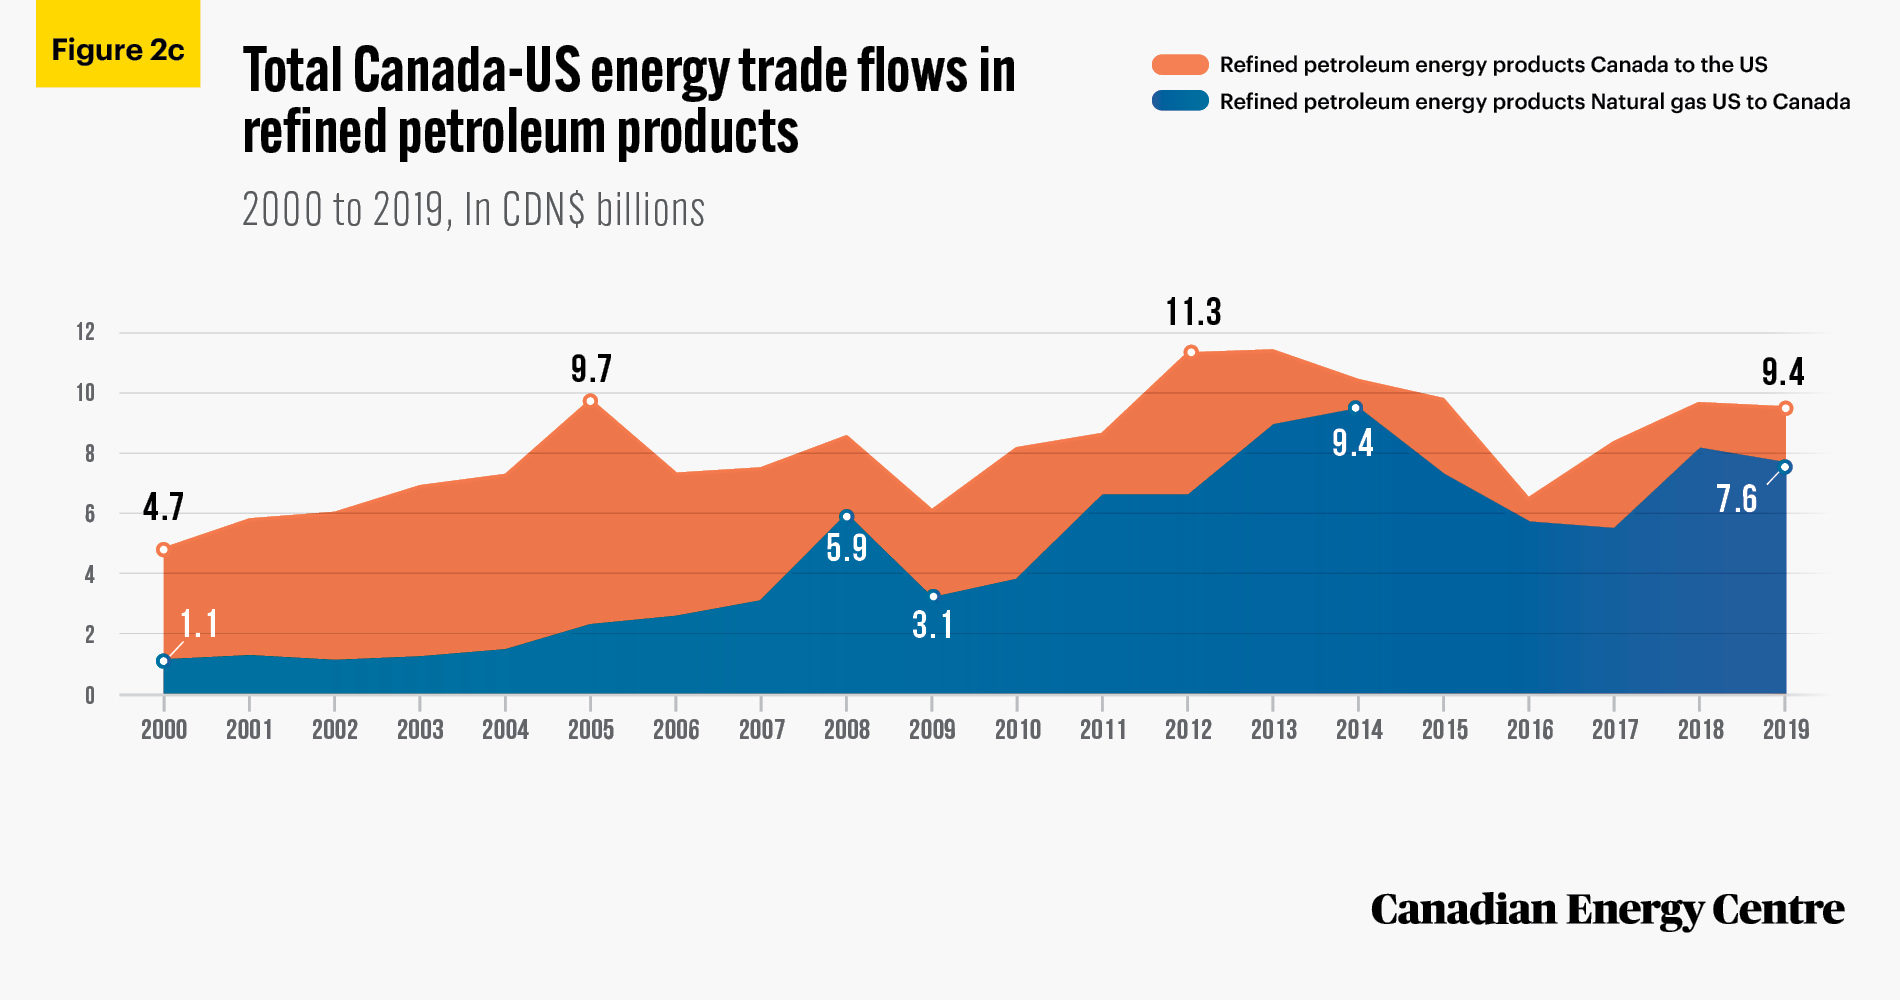
Over the past two decades (see Figure 2c), the cumulative aggregate value of refined petroleum energy products exported from Canada to the United States was nearly $162 billion, or an average of nearly $8.1 billion per year.
- The value of refined petroleum products ranged from a low of $4.7 billion in 2000 to as high as $11.3 billion in 2013.
- In 2019, the value of refined petroleum exports from Canada to the United States was over $9.4 billion.
- Overall, between 2000 and 2019, the value of refined petroleum exports from Canada to the United States increased by about 100 per cent.
From the US to Canada: Refined petroleum energy products exports up 600 per cent
Over the past two decades (see Figure 2c), the cumulative aggregate value of refined petroleum energy products exported from the United States to Canada was over $91.7 billion, or an average of nearly $4.6 billion per year.
- The value of refined petroleum energy product exports from the United States to Canada ranged from nearly $1.1 billion in 2000 to nearly $9.4 billion in 2014.
- In 2019, the value of refined petroleum energy products exports from the United States to Canada was nearly $7.6 billion.
- Overall, between 2000 and 2019, the value of refined petroleum energy products exports from the United States to Canada increased by 600 per cent.
Source: Statistics Canada, Table 12-10-0133-01.
The significant increase in imports by Canada of refined petroleum products from the United States over the past two decades is largely attributable to the large refining industry in the latter country.
In fact, in 2019, exports of refined petroleum products from the United States comprised over 55 per cent of the value of US energy exports to Canada. In contrast, that same year, exports of crude oil and bitumen comprised over 78 per cent of the value of Canadian energy exports to the United States.⁴
The United States has a competitive advantage at processing Canadian crude oil and bitumen into finished products that are either consumed domestically or exported abroad, including to the Canadian market (Centre for Strategic and International Studies, 2018).
Cross-border pipelines transport crude oil and bitumen and refined petroleum products between Canada and the United States, and the construction of new projects such as the Line 3 Replacement and Keystone XL (currently shelved by the Biden Administration) will be critical to maintaining these trends in Canada-US energy products trade flows.
4. Readers should not mistake this recitation of the rise in crude exports for refining in the United States as a call for more refinery capacity in Canada. There are various reasons why refining may be economic in one jurisdiction and not another. See Extracting the Most Value from Canada’s Petroleum by Philip Cross (2013).
Values and key states in the Canada-U.S. trade flow
In this section, we examine trends in the Canada-US energy trade flow by looking at key commodities for individual US states in 2019.⁵
Crude oil and bitumen exports from Canada to the United States: Worth almost $88 billion in 2019
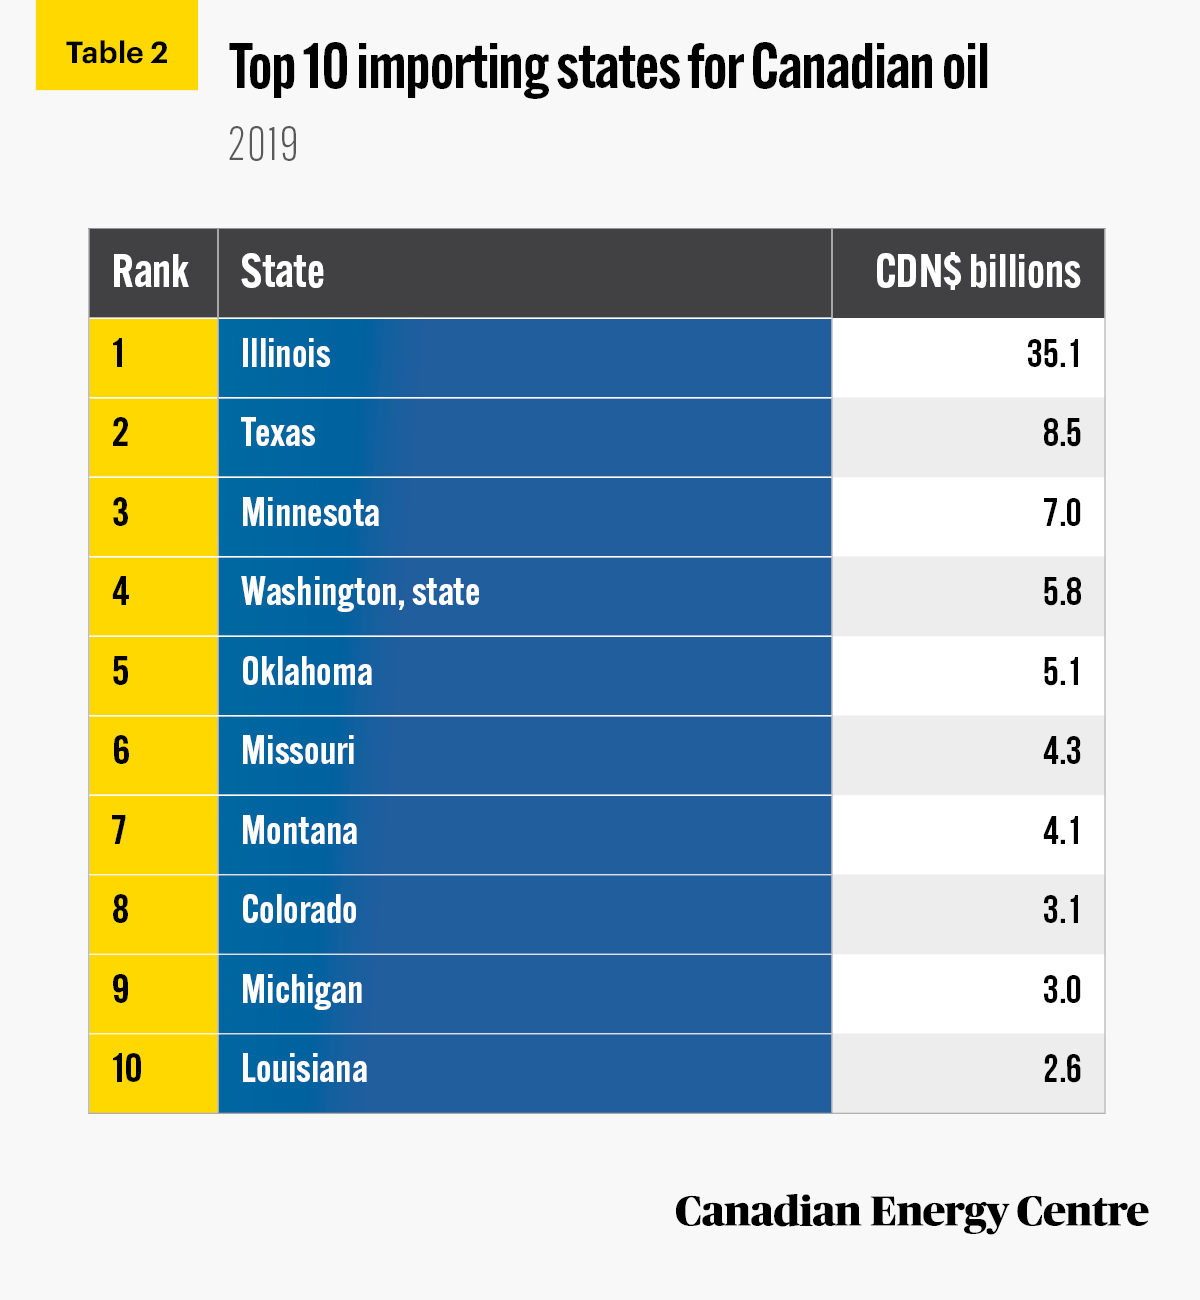
Key states in the Canada-United States 2019 energy trade flow include Illinois, Texas, Minnesota, Washington State, Oklahoma, Missouri, Montana, Colorado, Michigan, Louisiana, North Dakota, Vermont, and New York (see Table 2).
• The ten US states that were the top importers of Canadian crude oil and bitumen ranged from Illinois, which imported $35.1 billion worth of the product, to Louisiana, which imported $2.6 billion worth. Eight other states imported crude oil valued between those amounts.
• The value of crude oil and bitumen exports from Canada to the United States (to all the states) was over $87.7 billion in 2019.
5. CSIS notes that “geographical proximity plays an important role in determining how reliant a U.S. state is on the U.S.-Canada energy trade relationship, with states that are more heavily reliant typically located close to the border. However, with the advent of cross-border pipelines, states that are well connected to the Canadian market by pipeline also tend to be the ones to rank highly on reliance on the Canada-United States energy trade because they have the required infrastructure to import and export natural gas and petroleum, economically” (Centre for
Strategic and International Studies, 2018).
Source: Statistics Canada, Canadian International Merchandise Trade Database.
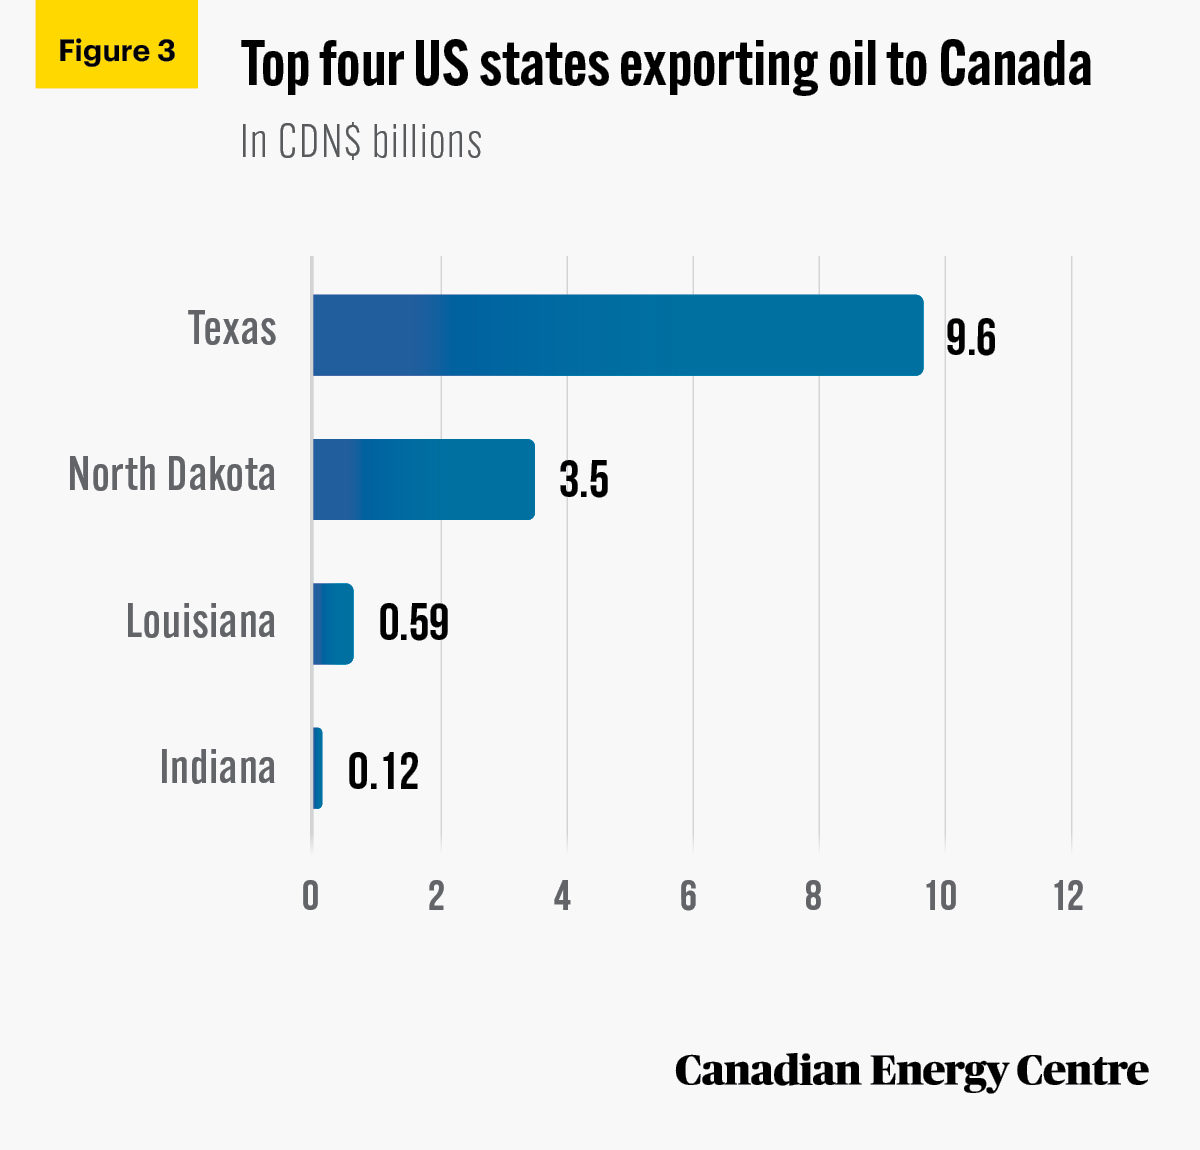
Exports of US oil to Canada: Worth about $13.8 billion in 2019
The value of crude oil and bitumen imports flowing into Canada from the United States was about $13.8 billion in 2019. The top four US states exporting crude oil and bitumen to Canada in 2019 were Texas ($9.6 billion), North Dakota ($3.5 billion), Louisiana ($590 million), and Indiana ($120 million) (see Figure 3).
Source: Statistics Canada, Canadian International Merchandise Trade Database.
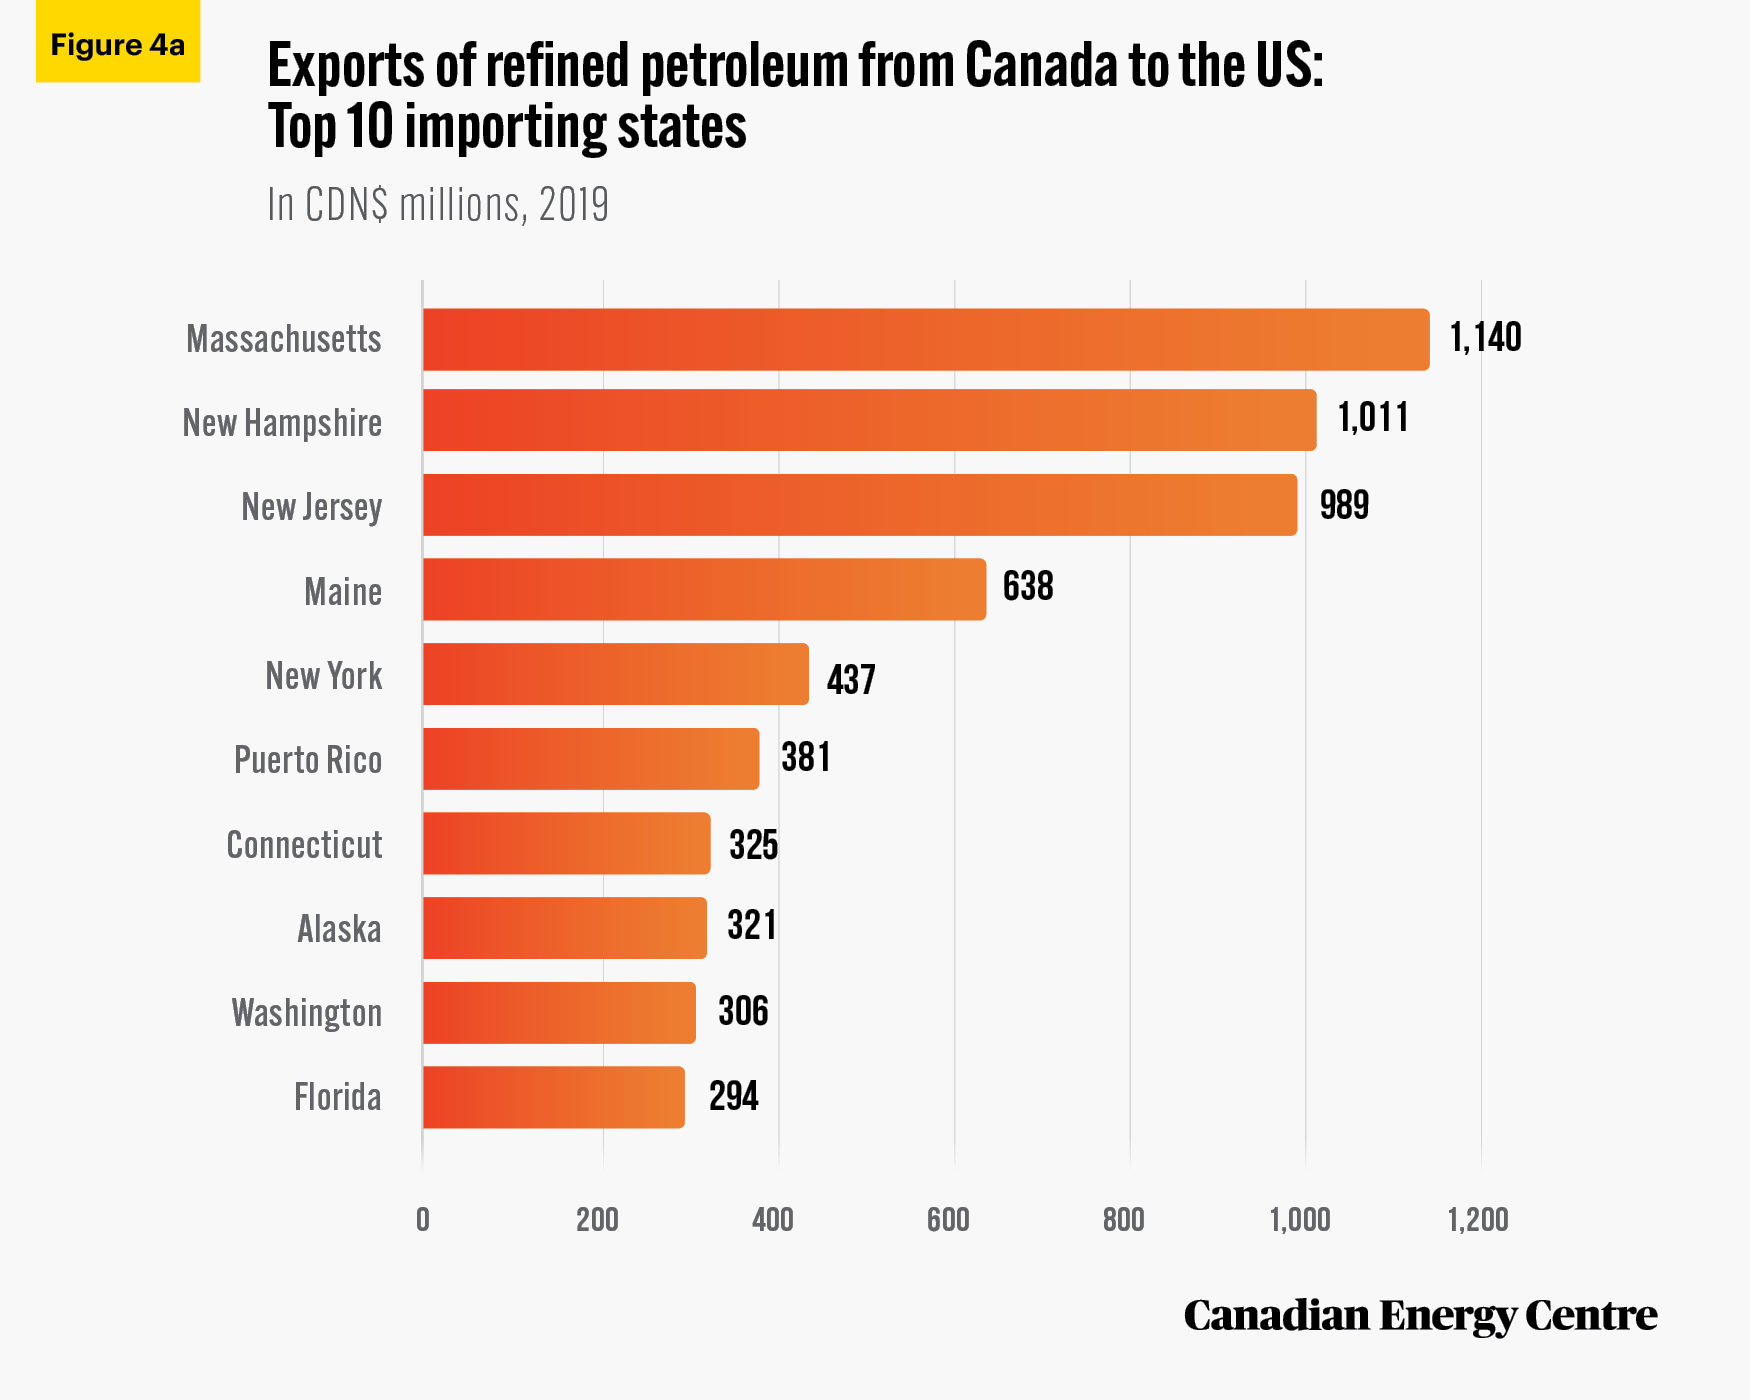
Canada’s exports of refined petroleum products to the US: Worth $9.4 billion in 2019
In 2019, the top 10 recipient states of Canada’s refined petroleum products⁶ ranged from Massachusetts ($1.1 billion) to Florida ($294 million), with the other eight states out of the top ten importing amounts that ranged in value between Florida and Massachusetts. (see Figure 4a).
- The total value of refined petroleum products exported from Canada to the United States was over $9.4 billion in 2019.
Source: Statistics Canada, Canadian International Merchandise Trade Database.
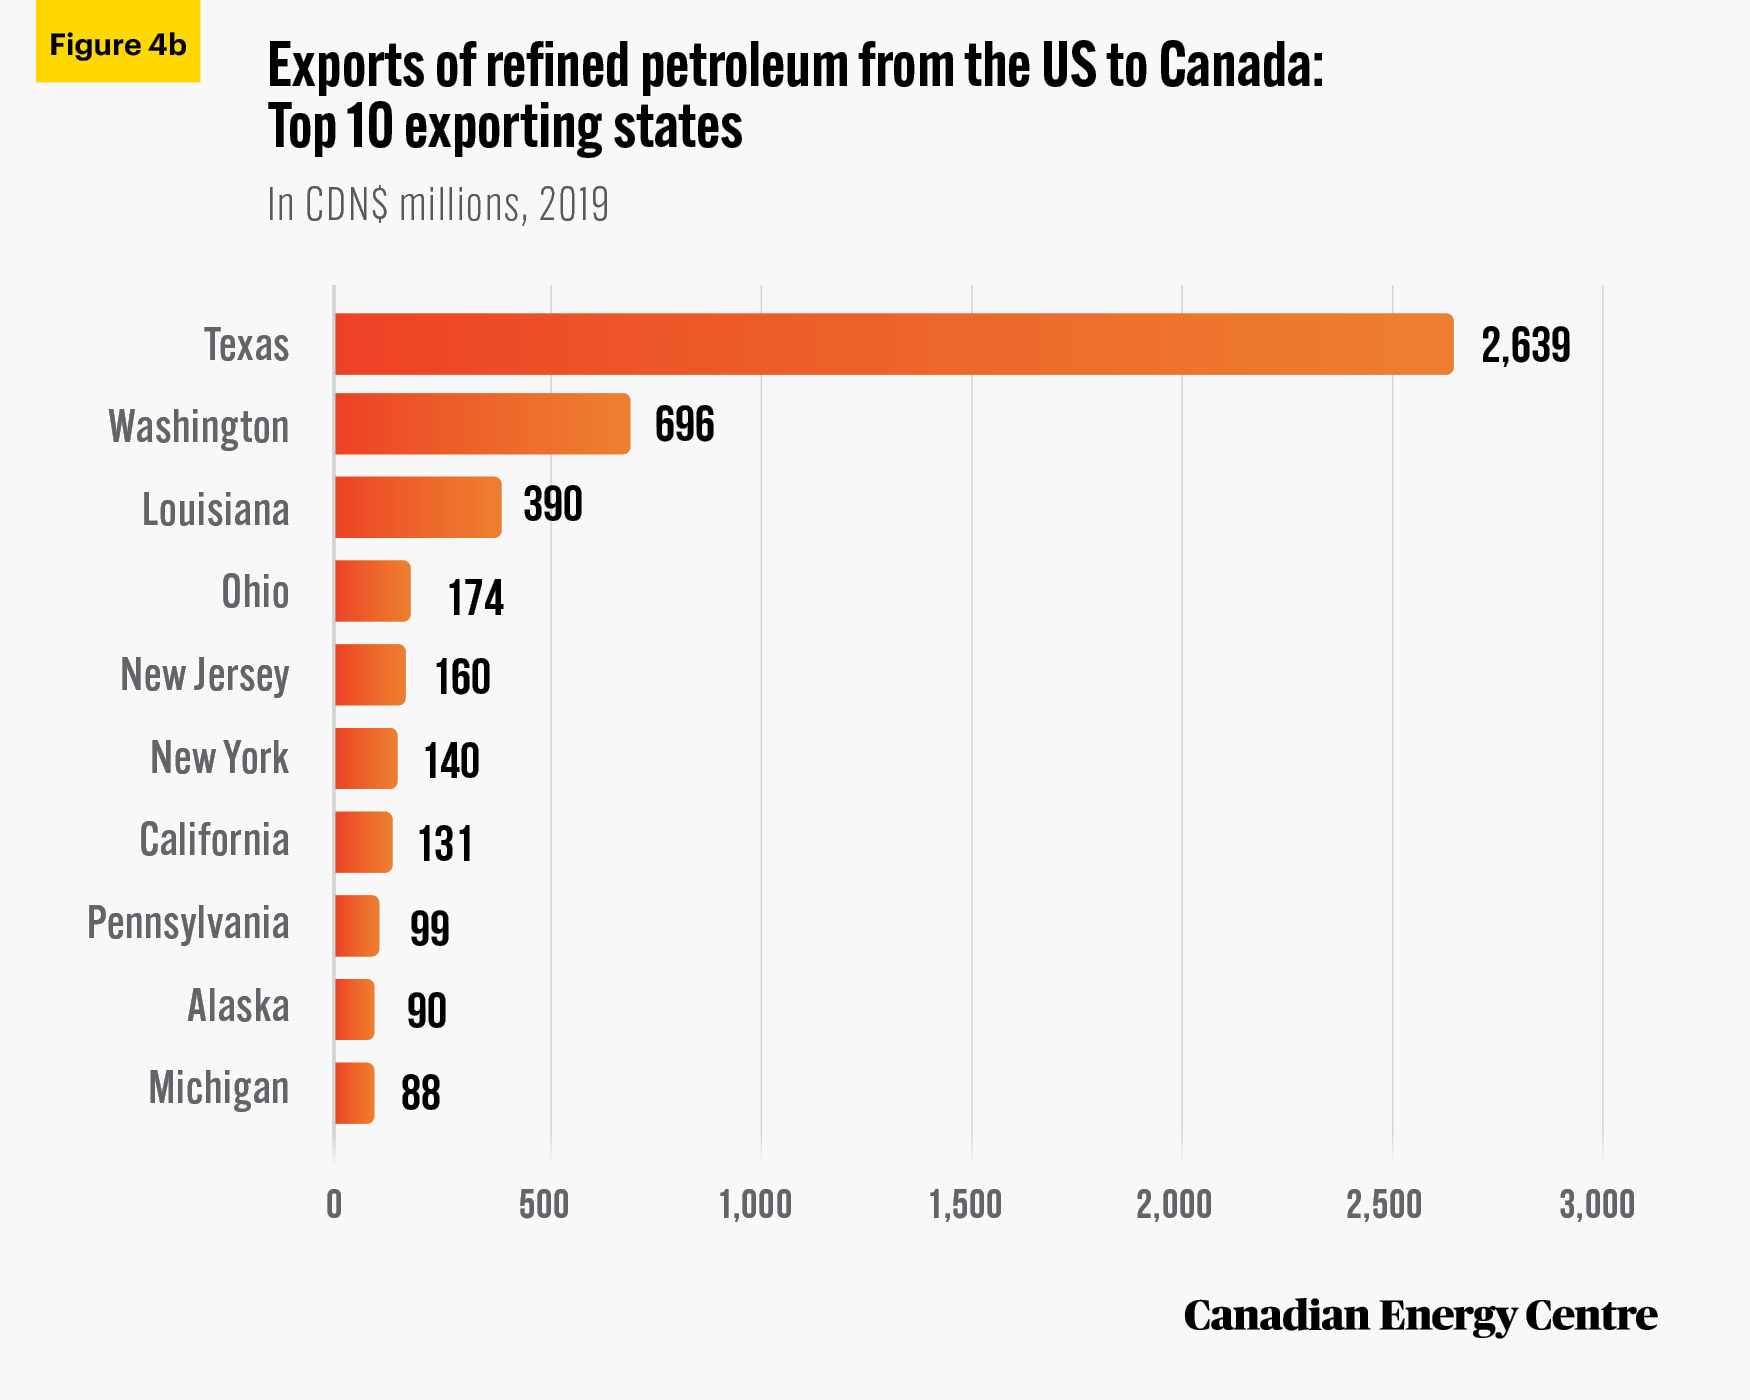
US exports of refined petroleum products to Canada: Worth $7.6 billion in 2019
In 2019, the 10 US states that were the top exporters to Canada of refined petroleum products⁷ ranged from Texas ($2.6 billion) to Michigan ($88 million) with the other eight (of the top ten exporting states) within that range (see Figure 4b).
- The value of refined petroleum product exports from the US to Canada was worth over $7.6 billion in 2019.
Source: Statistics Canada, Canadian International Merchandise Trade Database.
6. That is, petroleum oils and oils obtained from bituminous minerals (other than crude) and preparations not elsewhere specified or included, containing by weight 70% or more of petroleum oils or of oils obtained from bituminous minerals, these oils being the basic constituents of the preparations, containing biodiesel, other than waste oils products.
7. That is, petroleum oils and oils obtained from bituminous minerals (other than crude) and preparations not elsewhere specified or included, containing by weight 70% or more of petroleum oils or of oils obtained from bituminous minerals, these oils being the basic constituents of the preparations, containing biodiesel, other than waste oils products.
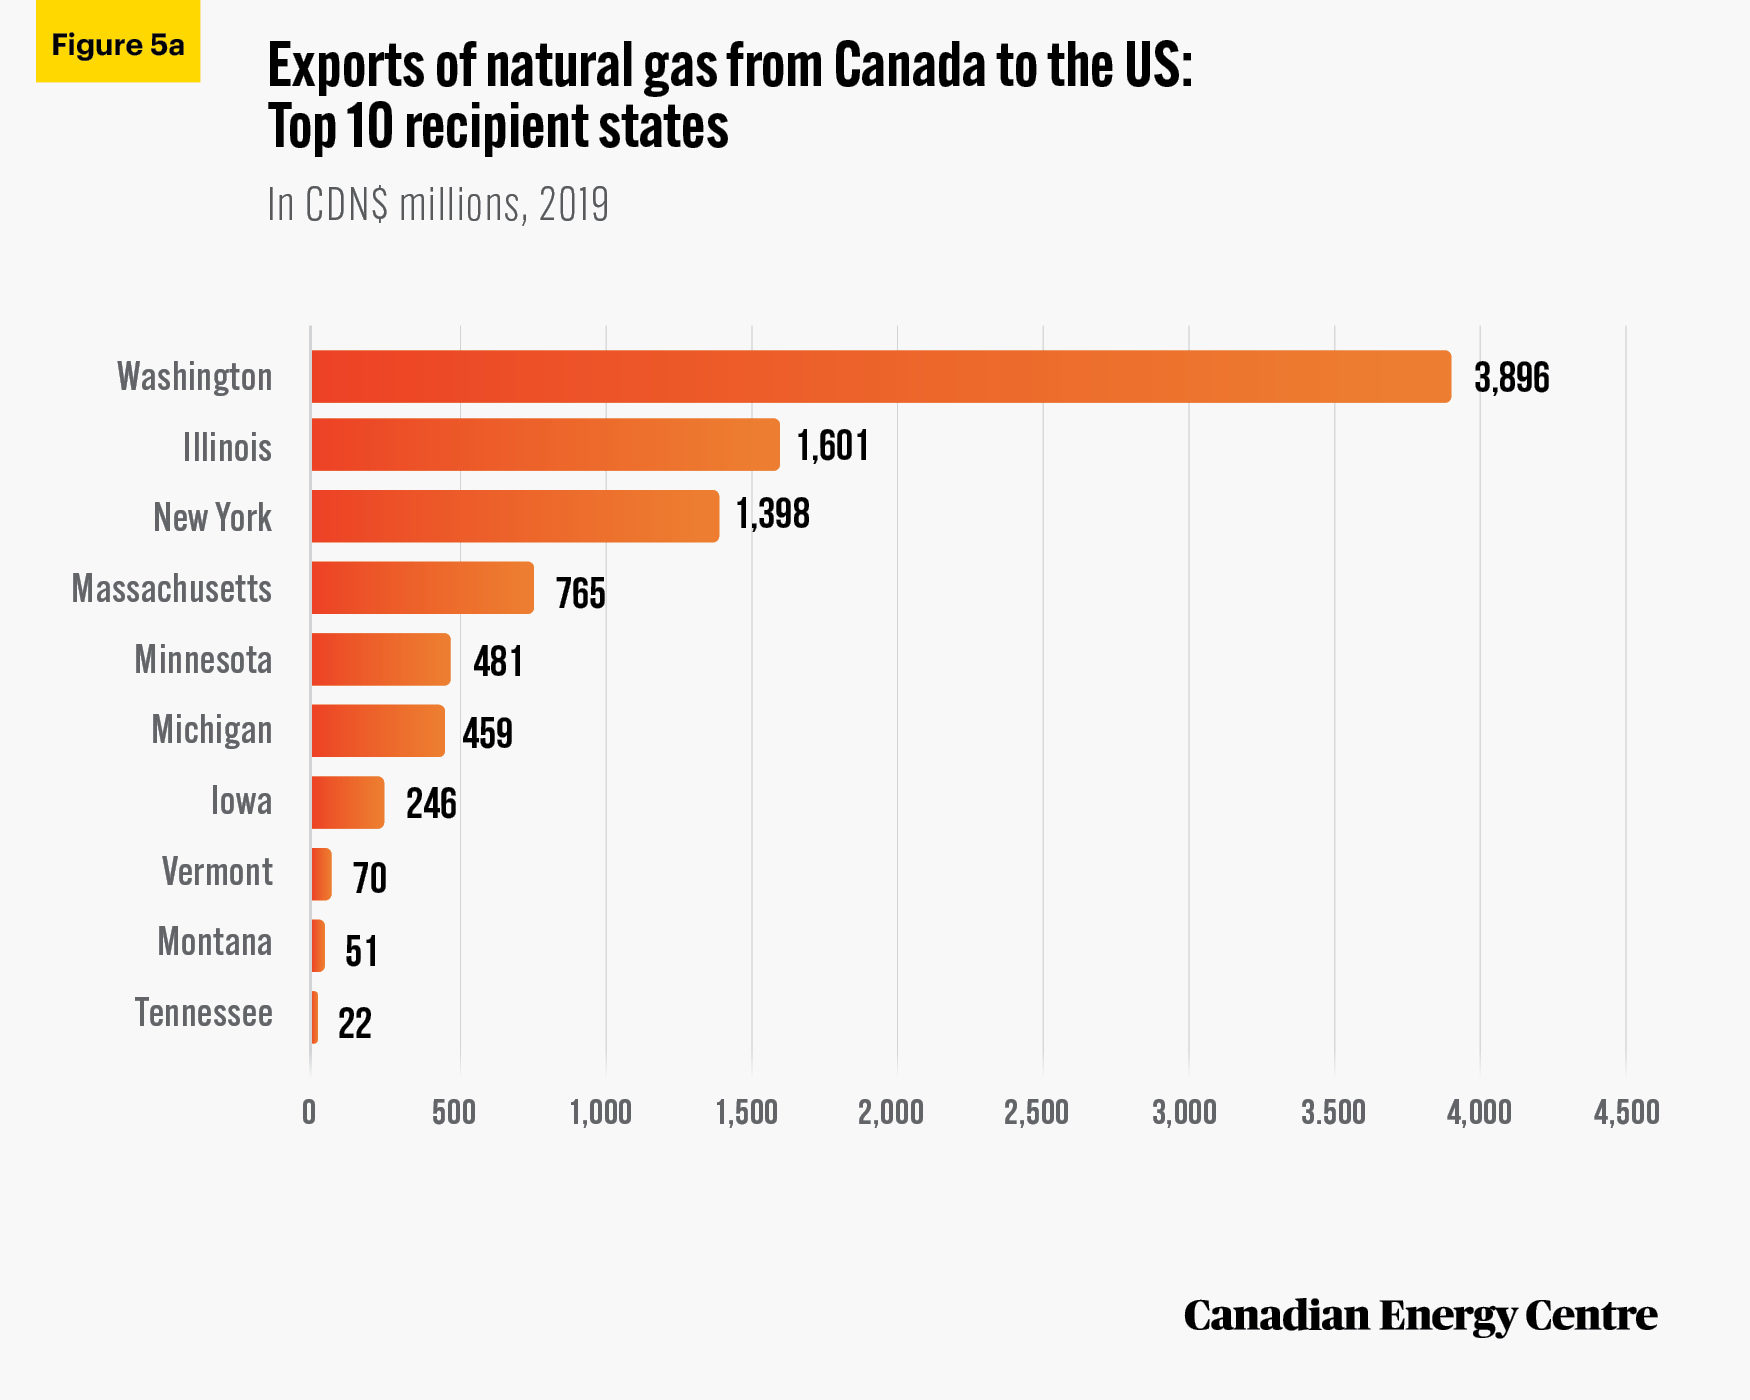
Canada’s natural gas exports to the US: Worth $9 billion in 2019
The value of Canada’s natural gas exports to the United States was nearly $9.0 billion in 2019. The value by state for the top ten recipient states ranged from $3.9 billion (Washington) to $22 million (Tennessee) (see Figure 5a).
Source: Statistics Canada, Canadian International Merchandise Trade Database.
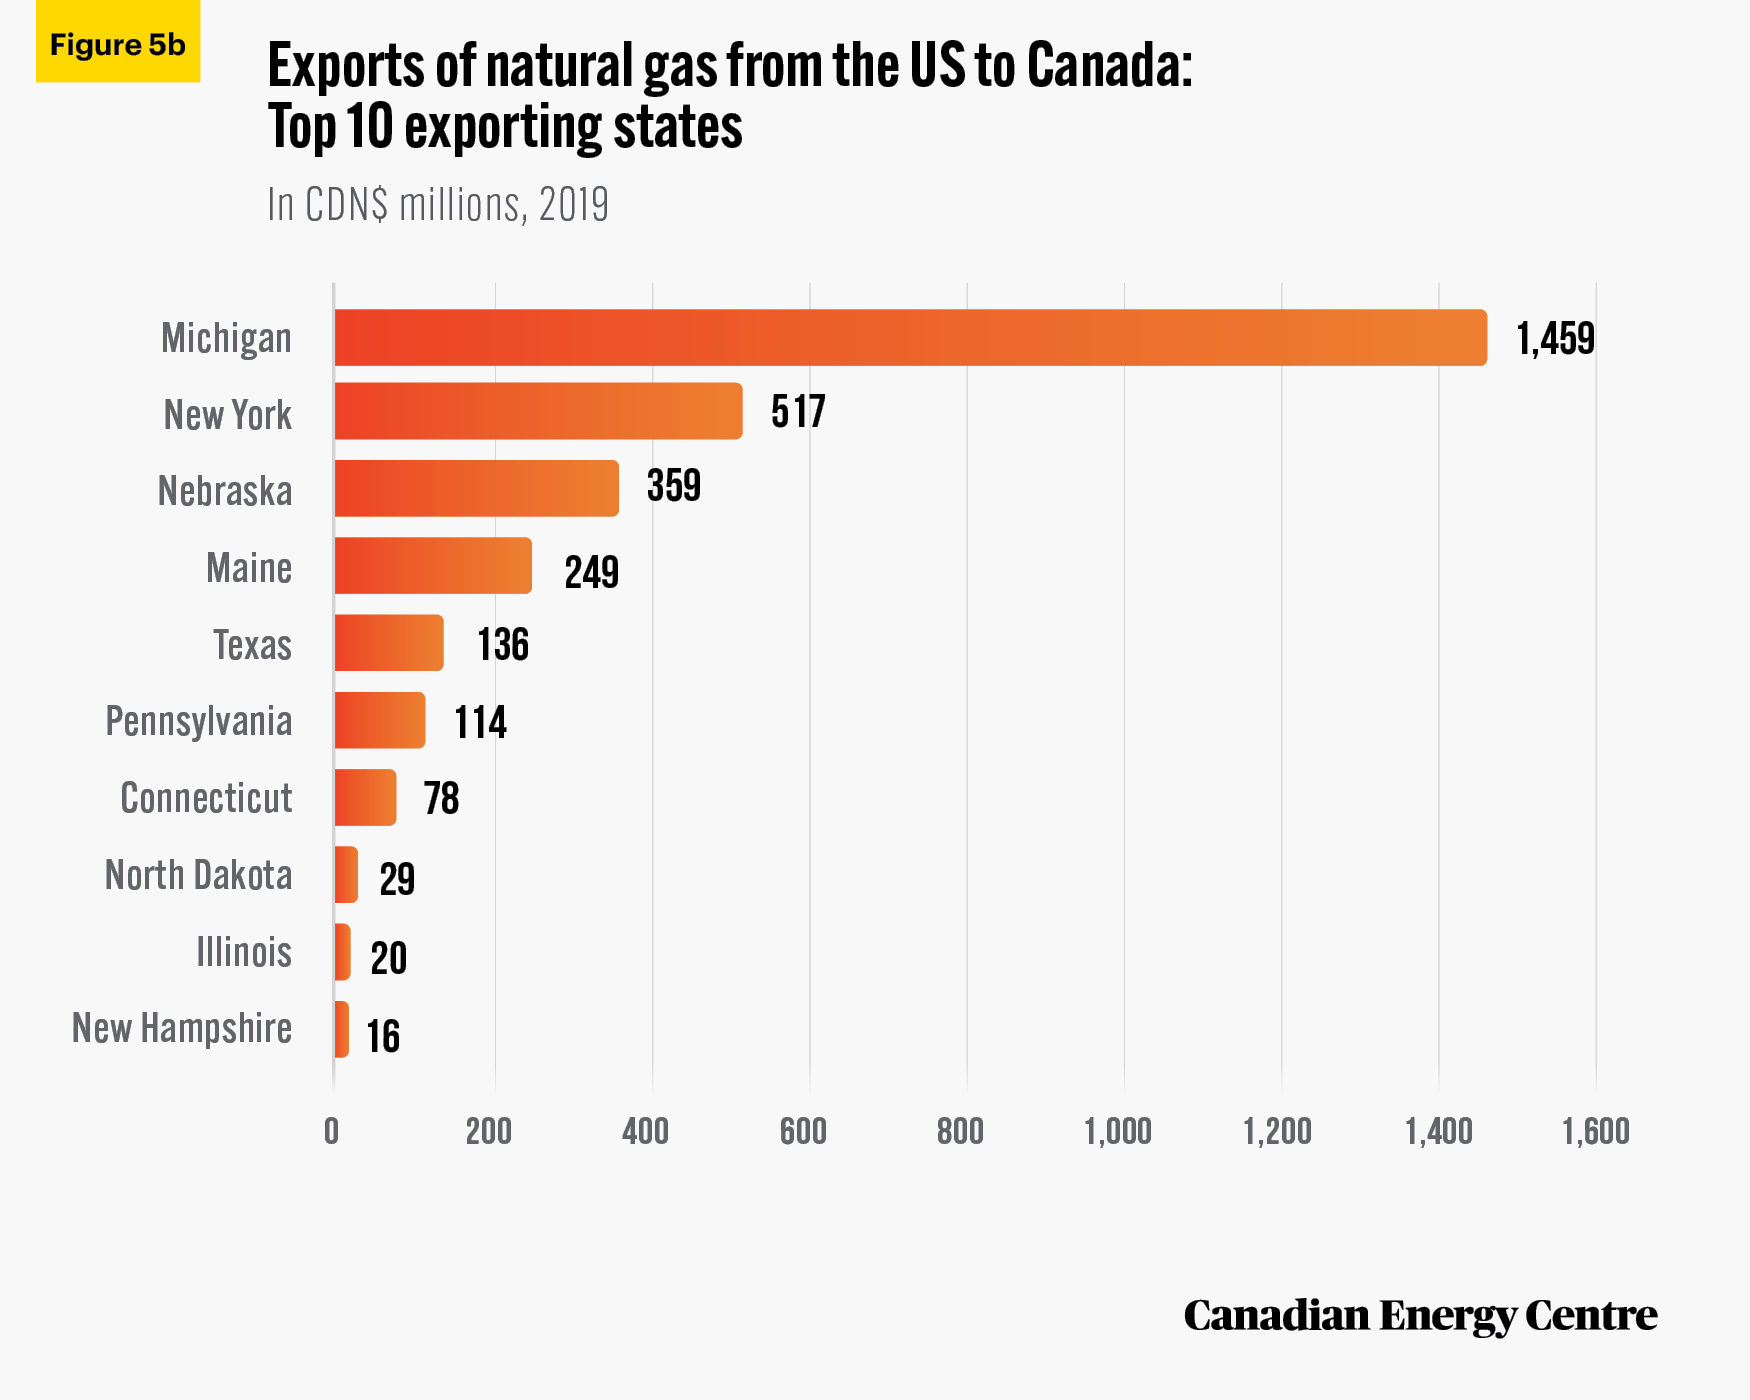
US natural gas exports to Canada: Worth $3.1 billion in 2019
The value of US natural gas exports to Canada was almost $3.1 billion in 2019. The 10 US states that were the top exporters of natural gas to Canada ranged from Michigan (nearly $1.5 billion) to New Hampshire ($16 million) (see Figure 5b).
Source: Statistics Canada, Canadian International Merchandise Trade Database.
US electricity exports to Canada: Worth $578 million in 2019
The value of US electricity exports to Canada was worth $578 million in 2019 and $14.5 billion in total between 2000 and 2019 inclusive. No breakdown by exporting state is available.
Canada’s electricity exports to the US: Worth $2.5 billion in 2019
Canada’s electricity exports to the United States were valued at $54.5 billion between 2000 and 2019 inclusive and over $2.5 billion in 2019 alone.
The 10 US states that were the top recipients of Canada’s electricity in 2019 ranged from Vermont ($585.2 million) to Oregon ($50.5 million) with the other eight states (in the top ten) within that range.
Summary
Energy trade flows between Canada and the United States over the past two decades have been significant and are critical to maintaining North America’s future energy security. They include a cumulative aggregate value of energy products trade between Canada and the United States between 2000 and 2019 of $1.96 trillion—$138 billion in 2019 alone.
- Crude oil (including bitumen) has been the largest commodity in the Canada-United States energy products trade flow; a total of $1.12 trillion in crude oil and bitumen has flowed between the two countries from 2000 to 2019, including $101.5 billion in 2019.
- The second largest commodity in the Canada-United States energy products trade flow over the past two decades is natural gas; a cumulative total trade value of $426.3 billion of that product has passed between the two countries, including $12.1 billion in 2019.
- The third largest commodity in the Canada-United States energy products trade flow is refined petroleum energy products with a cumulative trade value of $253.7 billion between 2000 and 2019, including $17 billion in 2019. (Refined petroleum energy products replaced natural gas in second place as of 2019).
Cross-border pipelines transport crude oil and bitumen and refined petroleum products between Canada and the United States, and the construction of new projects such as the Line 3 Replacement and Keystone XL (currently shelved by the Biden Administration) will be critical to maintaining these energy trade flows between Canada and the United States.
References (as of February 3, 2021)
Butane Propane News (undated). Canada is the United tates Largest Energy Trade Partner. <http://bit.ly/36CrZ1Q>.
Centre for Strategic and International Studies (2018). Mapping the U.S.-Canada Energy Relationship. <https://bit.ly/39K5Sss>.
Cross, Philip (2013). Extracting the Most Value from Canada’s Petroleum. MacDonald-Laurier Institute. <https://bit.ly/2NZxTE1>.
Statistics Canada (2020a). Canadian International Merchandise Trade Database. <http://bit.ly/3bcc1yJ>.
Statistics Canada (2020b). Table 12-10-0133-01: Canadian international merchandise trade by province and country, and by product sections, customs-based, annual (x 1,000). <https://bit.ly/36l72Zc>.
U.S. Energy Information Administration (2020). Canada is the largest source of U.S. energy imports. <http://bit.ly/3bgdiVu>.
CEC Research Briefs
Canadian Energy Centre (CEC) Research Briefs are contextual explanations of data as they relate to Canadian energy. They are statistical analyses released periodically to provide context on energy issues for investors, policymakers and the public. The source of profiled data depends on the specific issue.
About the authors
This CEC Research Brief was compiled by Lennie Kaplan, M.A., Chief Research Analyst and Mark Milke, Ph.D., Executive Director of Research for the Canadian Energy Centre.
Acknowledgments
The authors and the Canadian Energy Centre would like to thank and acknowledge the assistance of Philip Cross for his review of this paper.
Creative Commons Copyright
Research and data from the Canadian Energy Centre (CEC) is available for public usage under creative commons copyright terms with attribution to the Canadian Energy Centre. Attribution and specific restrictions on usage including non-commercial use only and no changes to material should follow guidelines enunciated by Creative Commons here: Attribution NonCommercial-NoDerivs CC BY-NC-ND.
Photo Credits
Chicago Skyline by Cameron Casey from Pexels.com, Trains by RJA1988 from Pixabay.com, Pipeline by Photos_kast from Pixabay.com, Trade Chart by Csaba Nagy from Pixabay, Canadian Flag by Maarten van den Heuvel from Pexels.com, Industrial Crane by Johannes Havn from Pexels.com, Manhattan skyline by Louis Vizet from Pexels.com, CN Tower Toronto by Burst from Pexels.com