Social
To sign up to receive the latest Canadian Energy Centre research to your inbox email: research@canadianenergycentre.ca
Download the PDF here
Download the charts here
Overview: 450,000 kilometres of pipelines cross the US and Canada
The Canada-United States (US) pipeline network is a critical component of North American energy security. Pipelines carry crude oil, natural gas, and refined petroleum products within and between the two countries.
According to the US market intelligence research firm Morning Consult, the “free, safe movement of oil and gas resources is essential to continuing to realize the many benefits of the interconnected North American energy economy. As the United States and North America at large adjust to new energy production and transportation dynamics, [we] owe it to ourselves and to our future to commit to the expansion of modern pipeline infrastructure.”
In this CEC Fact Sheet, we examine some of the key attributes of the Canada-US pipeline network that contribute to the advancement of North American energy security.
Length of the Canada-US pipeline network: Over 450,000 kilometres, equivalent to 11 times the earth’s circumference
Canada
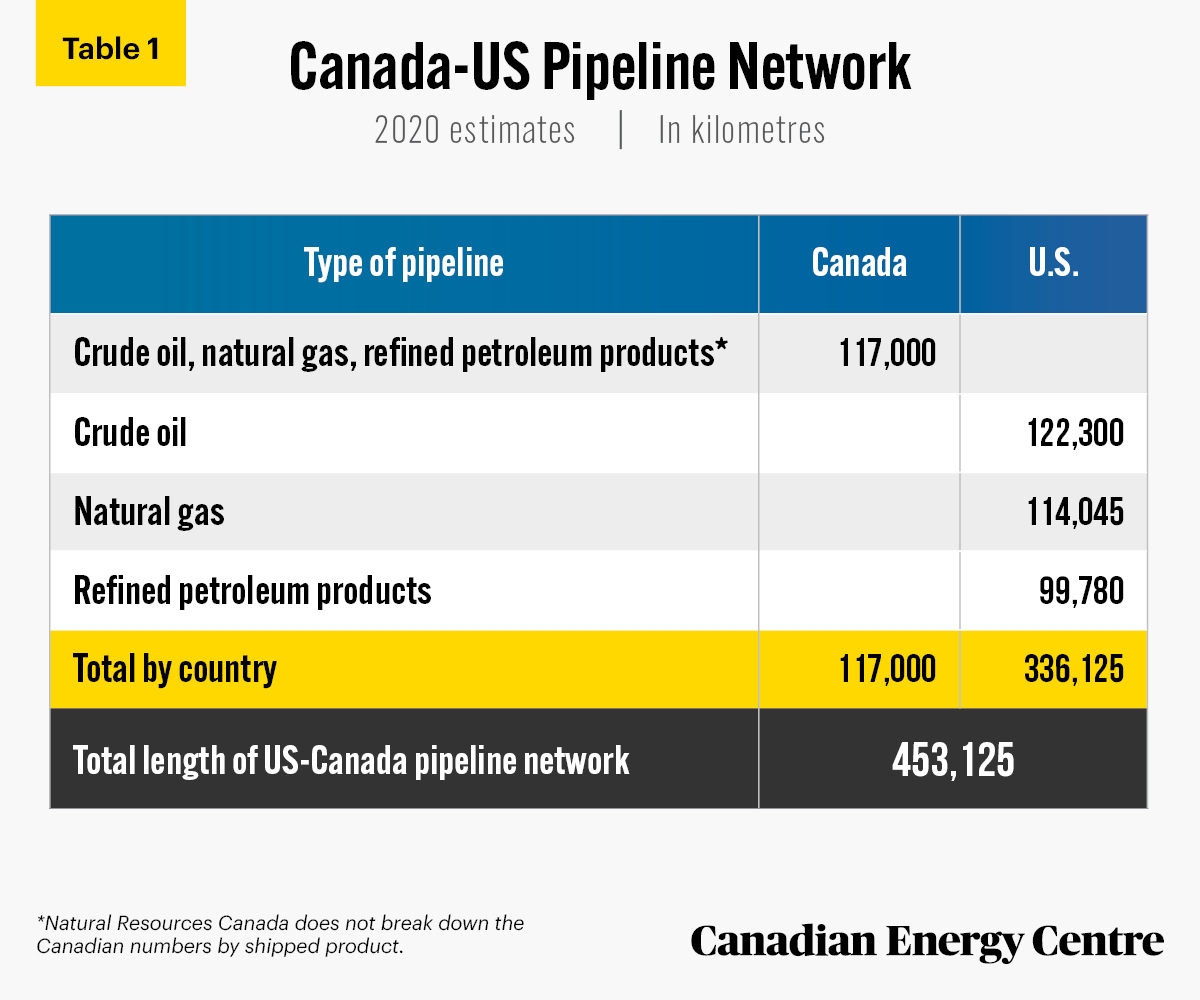
Transmission pipelines move crude oil and natural gas within provinces and across provincial and international boundaries. Canada currently has a network of 117,00 kilometres (km) of transmission pipelines that deliver crude oil, natural gas, and refined petroleum products to domestic and US markets.
According to Statistics Canada, in 2020 the Canadian pipeline network delivered over 3.6 million barrels per day (bpd) of crude oil and refined petroleum products such as gasoline and diesel. Canadians consumed 44.8 billion litres of gasoline in 2019.
United States
There are 122,300 km of crude oil pipelines, 111,045 km of natural gas liquid (NGL) pipelines, and 99,780 km of refined-product pipelines in operation in the United States. Pipelines are the primary means by which refined products are transported to distribution terminals serving consumer markets.
The US national pipeline network delivers over 20 billion barrels of crude oil and refined products each year. Americans consumed 142 billion gallons of gasoline in 2019.
US-Canada totals
Combined, the Canada-US energy pipeline network is over 453,000 kilometres long (see Table 1). That is 11 times the earth’s circumference.
Sources: Natural Resources Canada, undated; American Fuel and Petrochemical Manufacturers, undated.
Canada-US pipeline network trade flows:About 3.5 million barrels of crude and 10.1 billion cubic feet of natural gas per day
The crude oil and natural gas trade flow between the US and Canada through pipelines is significant and contributes to North American economic growth and prosperity (see Table 2).
In 2020,
- Crude oil exports transported from Canada to the United States by pipeline were nearly 3.2 million barrels per day;
- Crude oil imports transported from the United States to the Canada by pipeline were 324,410 barrels per day.¹
In 2019,
- Natural gas exports from Canada to the United States by pipeline totaled nearly 7.4 billion cubic feet per day;
- Canada’s natural gas exports arrived at various points of US entry including Eastport, ID; Calais, ME; Detroit, MI; Marysville, MI; Port Huron, MI; St. Clair, Sault St Marie, MI; International Falls, Noyes, MN; Warroad, MN; Babb, MT; Havre, MT; Port of Del Bonita, MT; Port of Morgan, MT; Sweetgrass, MT; Whitlash, Corsby, ND; Portal, ND; Sherwood, ND; Pittsburgh, NH; Champlain, Grand Island, NY; Massena, NY; Niagara Falls, NY; Waddington, NY; Highgate Springs, VT; North Troy, VT; and Sumas, WA.
- Natural gas imports transported from the United States to Canada by pipeline totaled nearly 2.7 billion cubic feet per day;
- Canada’s imports of natural gas left from various points of exit in the US including Eastport, ID; Calais, ME; Detroit, MI; Marysville, MI; Port Huron, MI; St. Clair, Sault St Marie, MI; International Falls, Noyes, MN; Warroad, MN; Babb, MT; Havre, MT; Port of Del Bonita, MT; Port of Morgan, MT; Sweetgrass, MT; Whitlash, Corsby, ND; Portal, ND; Sherwood, ND; Pittsburg, NH; Champlain, Grand Island, NY; Massena, NY; Niagara Falls, NY; Waddington, NY; Highgate Springs, VT; North Troy, VT; and Sumas, WA.

Sources: Statistics Canada, 2021a; 2021b; US Energy Information Administration, 2020a; 2020b.
Economic benefits of the Canada-US pipeline network: $60 billion in GDP and more than 63,400 jobs in the industry, with an average annual salary of over $80,000
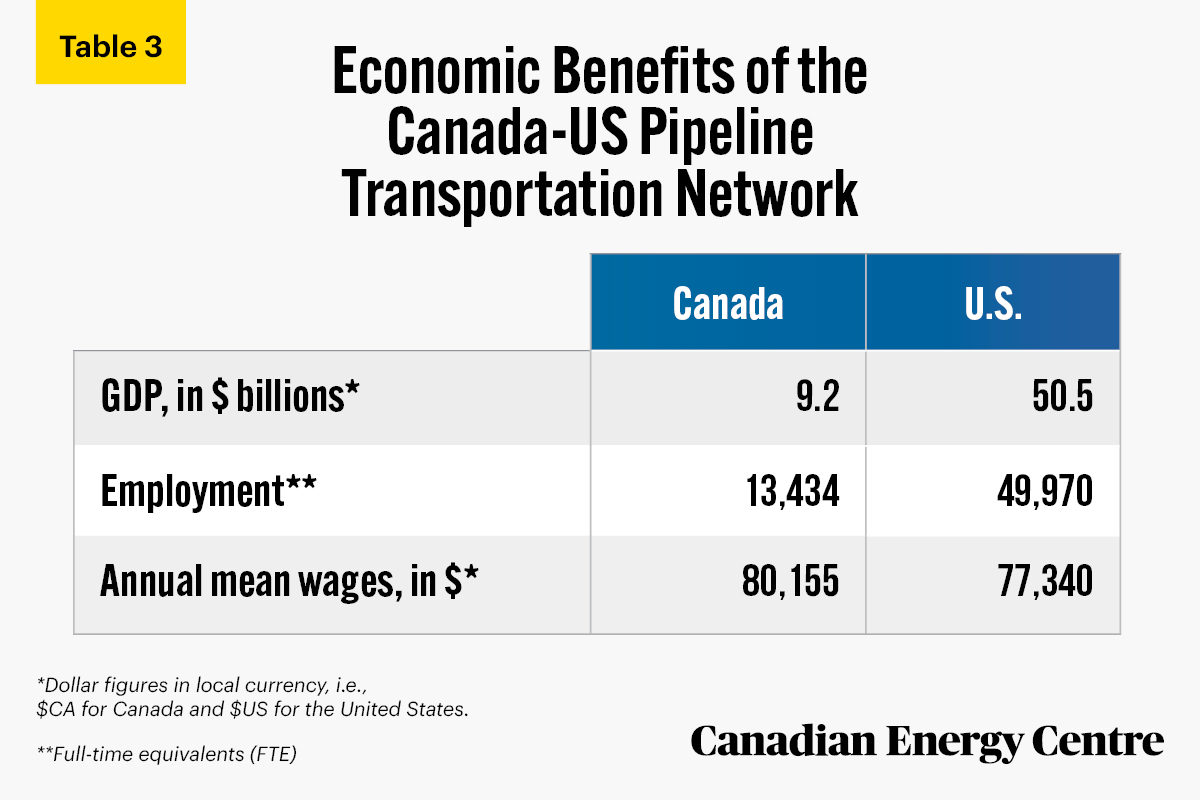
The economic benefit of the Canada-US pipeline network is significant whether measured by GDP, employment numbers, or wages (see Table 3).
In Canada
- In 2017, the pipeline transportation industry² in Canada added nearly $9.2 billion to Canada’s GDP.
- In 2019, there were 13,434 full-time equivalent jobs employing people in Canada’s pipeline transportation industry (Canadian Energy Pipeline Association, 2020).
In the United States
- In 2019, the pipeline transportation industry in the United States added over $50.5 billion to American GDP.
- As of May 2019, there were 49,970 Americans employed in the United States pipeline transportation industry.
1. United States crude oil exports to Canada are typically light, sweet grades that are shipped mainly to Canada’s central and eastern provinces.
2. Industries in the Pipeline Transportation subsector use transmission pipelines to transport products, such as crude oil, natural gas, refined petroleum products, and slurry. Industries are identified based on the products transported (i.e., pipeline transportation of crude oil, natural gas, refined petroleum products, and other products). The Pipeline Transportation of Natural Gas industry includes the storage of natural gas because the storage is usually done by the pipeline establishment and because a pipeline is inherently a network in which all the nodes are interdependent. The pipeline transportation subsector consists of these industry groups: Pipeline Transportation of Crude Oil: NAICS 4861, Pipeline Transportation of Natural Gas: NAICS 4862, and Other Pipeline Transportation: NAICS 4869.
Sources: Alberta Labour Information Service, 2020; Canadian Energy Pipeline Association, 2020; Statistics Canada 2021b; US Bureau of Economic Analysis 2020; US Bureau of Labor Statistics, 2020 and 2021.
Wage comparisons: a 45 per cent premium for pipeline work
- According to the Alberta Labour Information Service (ALIS), the average annual salary for an Oil Pipeline Operator and Maintenance Worker in 2020 was $80,155 (see Table 3).
- As of May 2019, the hourly mean wage for an employee in the pipeline transportation industry in the United States was $37.18. This is nearly 45 per cent higher than the hourly mean wage of $25.72 for all occupations in the United States (see Figure 1). Similarly, the annual mean wage³ for an employee in the pipeline transportation industry in the United States was $77,340 and thus also nearly 45 per cent higher than the annual mean wage for all occupations (see Figure 2 and Table 3).
3. Annual wages have been calculated by multiplying the hourly mean wage by a “year-round, full-time” hours figure of 2,080 hours; for those occupations where there is not an hourly wage published, the annual wage has been directly calculated from the reported survey data.

Source: US Bureau of Labor Statistics, 2020.

Source: US Bureau of Labor Statistics, 2020.
Other facts
According to the Association of Oil Pipe Lines, a single major pipeline construction project in the United States is estimated to employ 7,000 construction workers and provide them and their families with more than $US400 million in salary and benefits. More than 500 workers are needed to construct each 100-mile section of pipeline. Pipelines also need pumping stations constructed every 50 miles. Heavy equipment operators, labourers, welders, truck drivers, foremen, engineers, and quality control personnel are all needed to construct a pipeline.
Conclusion
The Canada-United States pipeline network is a critical component of North American energy security. Pipelines carry crude oil, natural gas, and refined petroleum products within and between the two countries.
In addition, and relevant to the existing pipeline network, in 2019, Alberta Treasury Board and Finance estimated that with market access achieved through the completion of all three major pipeline expansion projects (Line 3, TMX, and KXL), Canadian GDP would increase by about $19 billion annually. Canadian producers and governments would achieve $43 billion in increased income due to increased production and investment between 2019 and 2023, or almost $9 billion per year.
- New pipeline infrastructure, such as Keystone XL, TMX, the Line 3 replacement, and the Line 5 tunnel replacement, would serve increased demand for crude oil, natural gas, and refined petroleum products and be critical to enhancing North American energy security and would lead to concurrent economic prosperity.
Notes
This CEC Fact Sheet was compiled by Lennie Kaplan and Mark Milke at the Canadian Energy Centre (www.canadianenergycentre.ca). The authors and the Canadian Energy Centre would like to thank and acknowledge the assistance of Philip Cross in reviewing the data and research for this Fact Sheet. Image credits: FLD:Y from Unsplash.com
References (All links live as of February 25, 2021)
About Pipelines (undated). <https://bit.ly/3qTxz7c>. Alberta Budget (2019). <https://bit.ly/3bTD3ed>. Alberta Labour Information Service [ALIS] (2020), Oil Pipeline Operators and Maintenance Workers. <http://bit.ly/37JAetr>. American Fuel and Petrochemical Manufacturers (undated). <http://bit.ly/3qSguuy>. Association of Oil Pipe Lines (2020). <http://bit.ly/3ttwdlg>. Canadian Energy Pipeline Association (2020), 2020 Transmission Pipeline Industry Performance Report. <http://bit.ly/2MkDiVu>. Morning Consult (2019), North American Energy Security Depends on Modern Pipeline Expansion. <http://bit.ly/3eKxY9S>. Natural Resources Canada (undated), Pipelines across Canada. <http://bit.ly/3cCJ7H1>. Statistics Canada (2016), 2016 Census. Catalogue Number 98-400-X2016359. <http://bit.ly/37LXdEl>. Statistics Canada (2020), Gasoline Sales Flat in 2019. <http://bit.ly/3lkQ0k6>. Statistics Canada (2021a), Table 25-10-0077-01: Crude oil and petroleum products movements, by mode of transport and by product type, monthly. <https://bit.ly/3vumYTL>. Statistics Canada (2021b), Table 36-10-0487-01: Gross domestic product (GDP) at basic prices, by sector and industry, provincial and territorial (x 1,000,0000). <http://bit.ly/2OZCs1y>. Universe Today (2010), How Many Miles around the Earth? <http://bit.ly/3uuYYQ8>. US Bureau of Economic Analysis (2021), GDP by Industry. <http://bit.ly/3rOJynY>. US Bureau of Labor Statistics (2020), Occupational Employment and Wage Estimates. <https://bit.ly/2KPypmI>. US Bureau of Labour Statistics (2021), NAICS 486000 – Pipeline Transportation. <http://bit.ly/3bWiUEp>. US Energy Information Administration (2020a), Canada is the Largest Source of U.S. Energy Imports. <http://bit.ly/3tr3LAA>. US Energy Information Administration (2020b), U.S. Natural Gas Imports by Point of Entry, 2020. <http://bit.ly/3tr3YUo>.
Creative Commons Copyright
Research and data from the Canadian Energy Centre (CEC) is available for public usage under creative commons copyright terms with attribution to the CEC. Attribution and specific restrictions on usage including non-commercial use only and no changes to material should follow guidelines enunciated by Creative Commons here: Attribution-NonCommercial-NoDerivs CC BY-NC-ND.