Social
To sign up to receive the latest Canadian Energy Centre research to your inbox email: research@canadianenergycentre.ca
Download the PDF here
Download the charts here
Executive Summary
Methane emissions result from both human activities and natural sources. Methane emissions contribute to overall greenhouse gas (GHG) emissions. Methane emissions continue to increase across the globe, especially in countries that have not signed the Global Methane Pledge. Methane is between 28 and 34 times more potent than carbon dioxide (CO2).
This Research Brief analyzes the Canadian oil and gas sector’s methane emissions record for upstream (crude oil exploration and production) and downstream (refining and sales) activities relative to that of other countries. Globally, methane emissions from the oil and gas sector are estimated at 77.3 MT, or over 13 per cent of global methane emissions.
In 2020, the absolute methane emissions from Canada’s oil and natural gas activities was low compared to that from other major oil and gas producers. Russia recorded higher methane emissions than any other country, at 14,886 kilotons (kt) in 2020. Canada’s methane emissions that year were 2,098 kt. Russia, the United States, Iran, and Iraq were responsible for more than half of all global methane emissions from oil and gas production. At 5.2 tons of methane per kiloton of oil equivalent (tCH4 /ktoe), Canada’s oil and gas methane emissions intensity is one of the lowest among major energy producers.
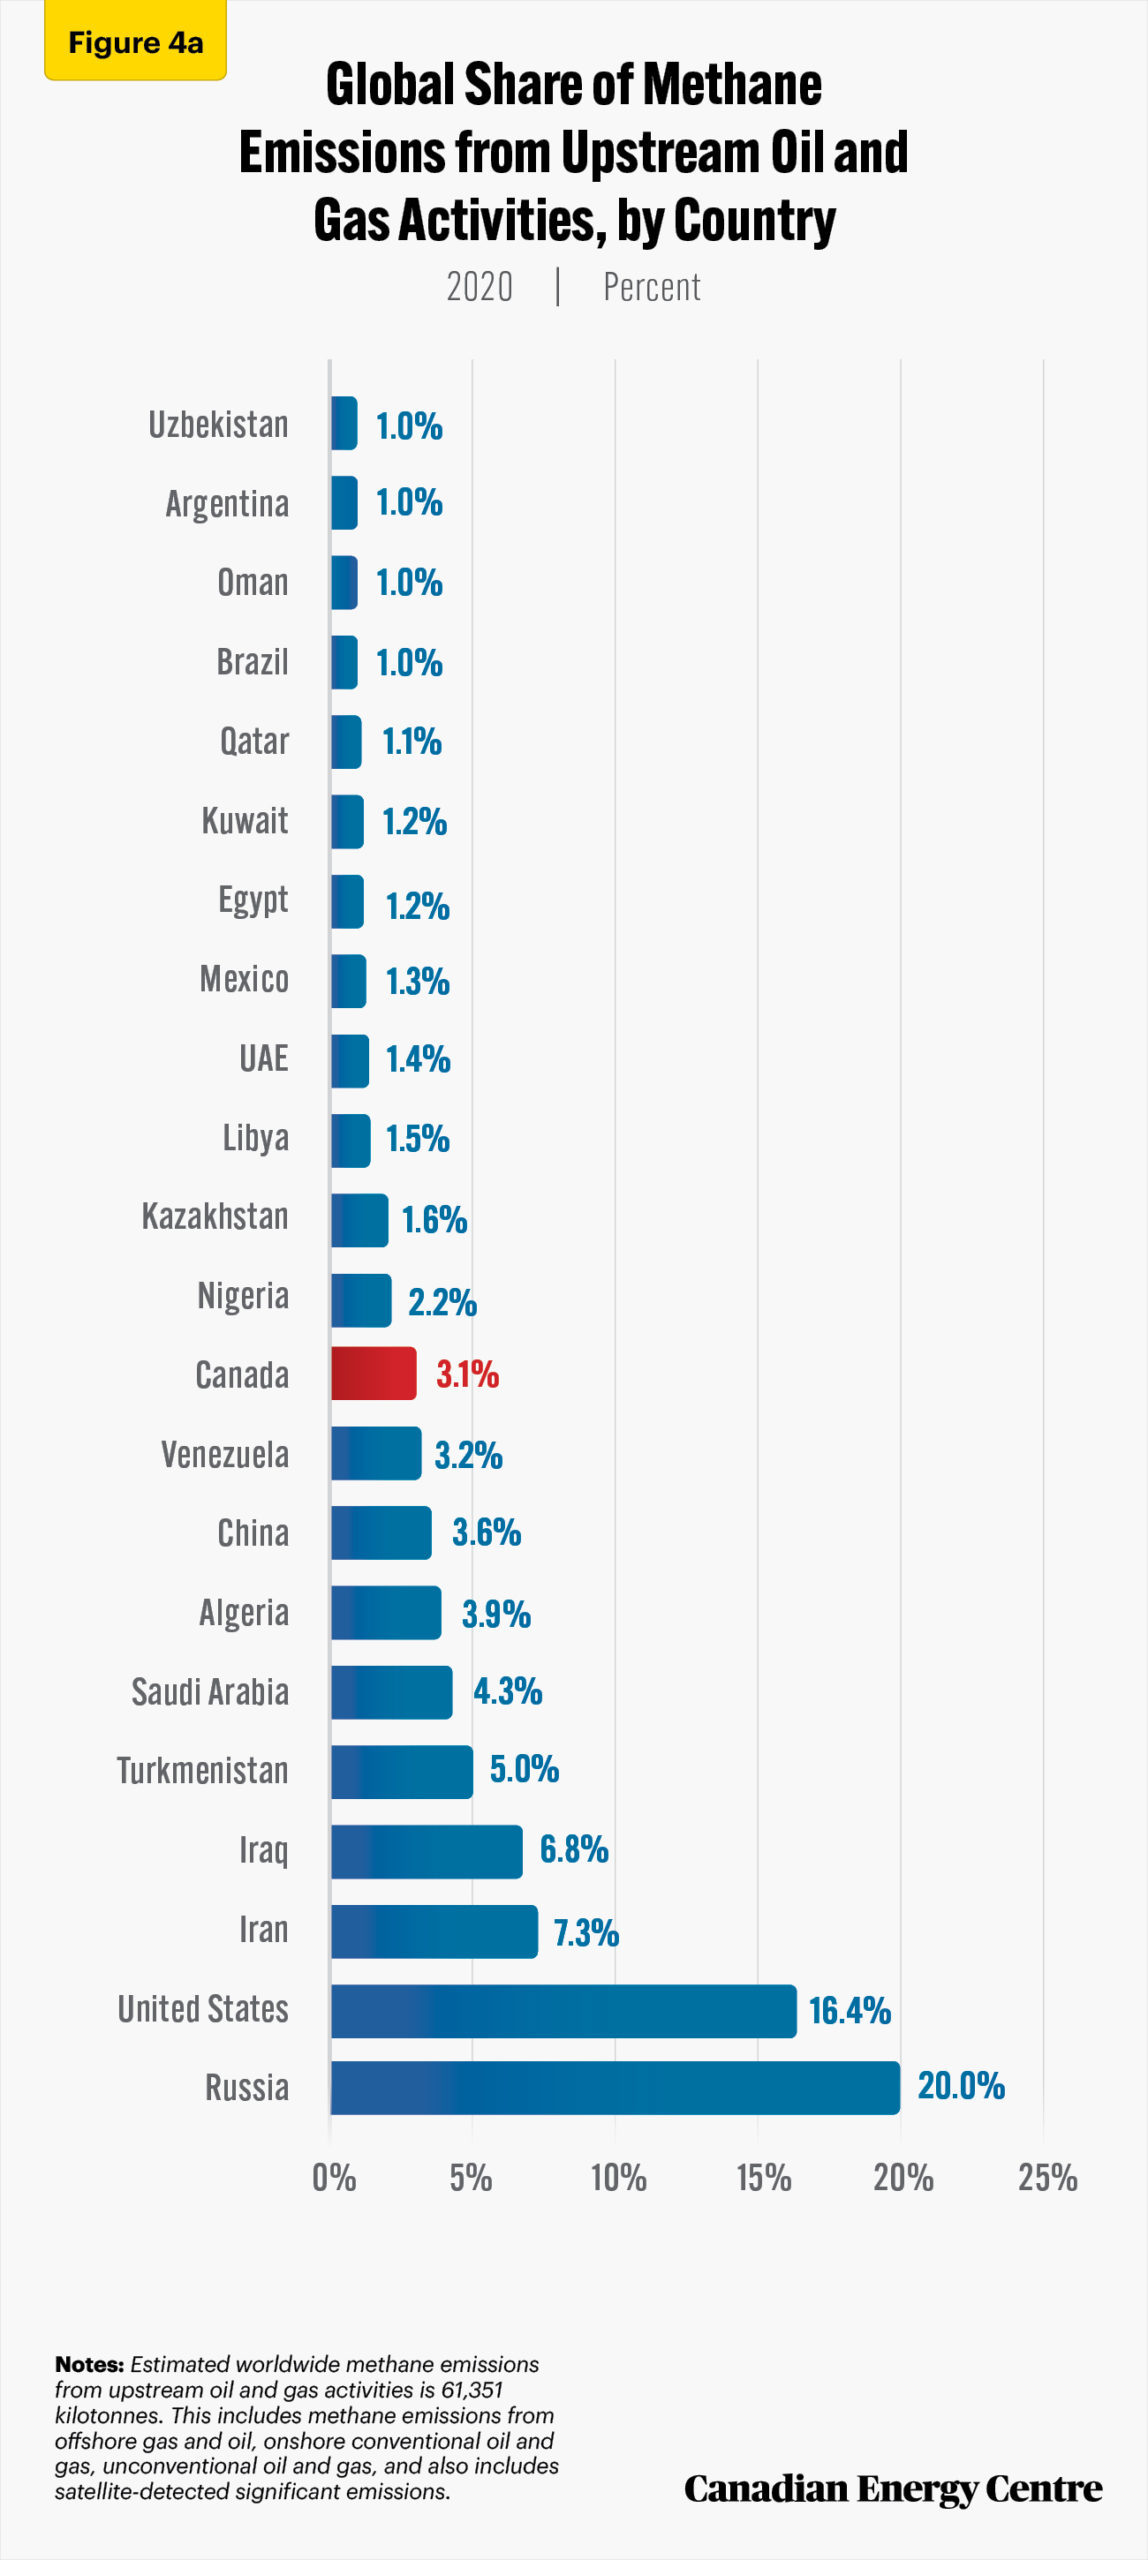
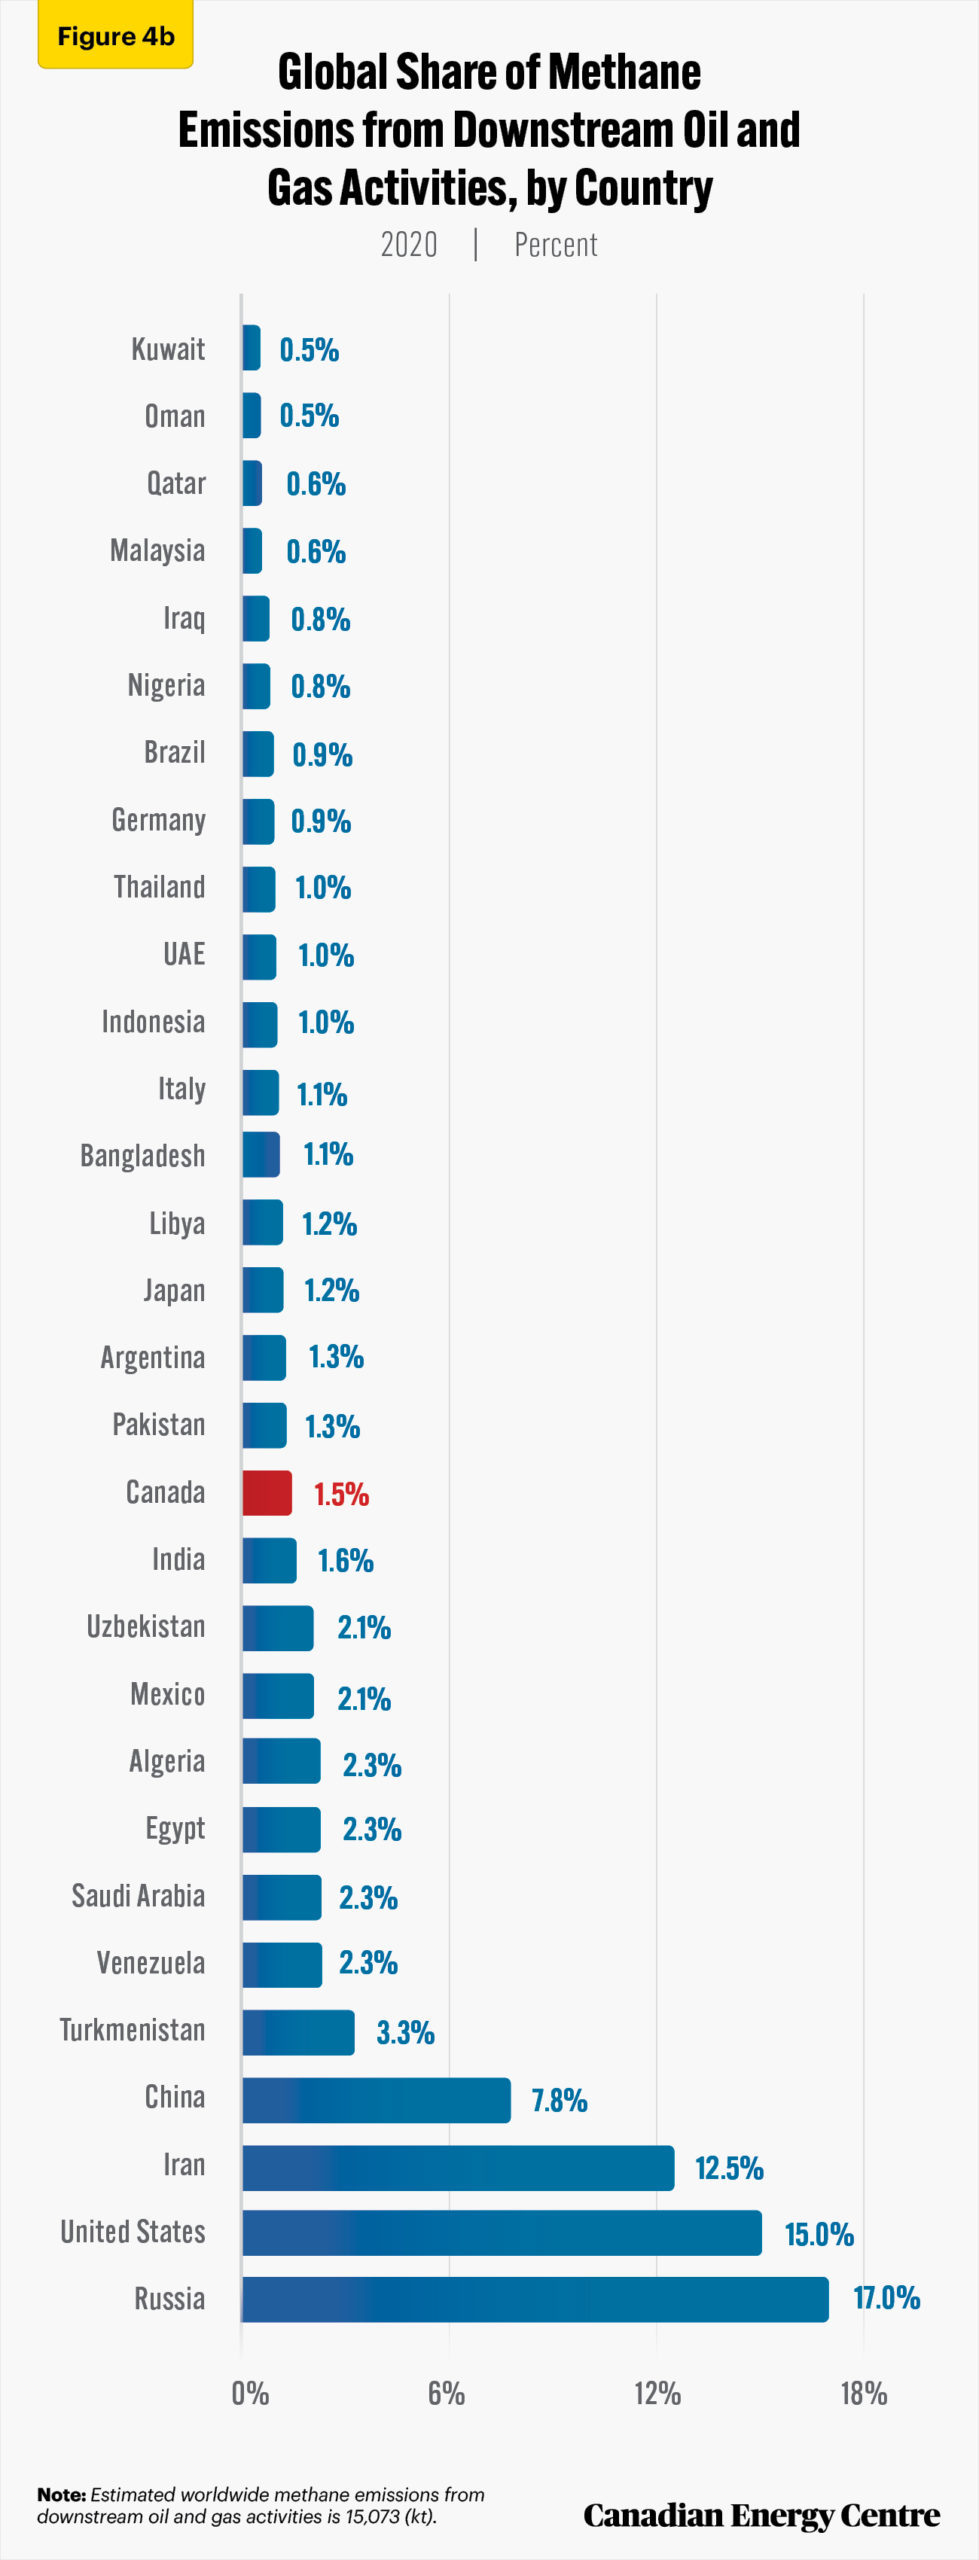
Russia accounted for 20 per cent of the global upstream oil and gas methane emissions and 17 per cent of global downstream oil and gas methane emissions. Canada’s global share of methane emissions was just 3 per cent of upstream activities and 1.5 per cent from downstream activities.
To fully grasp how efficiently Canada has been reducing methane emissions, we compared increases and decreases in methane emissions with increases and decreases in oil production for major energy-producing countries between 2000 and 2018. Canada’s methane emissions fell by 16 per cent even as its oil production increased by 91 per cent between 2000 and 2018. Meanwhile, worldwide methane emissions increased by 27 per cent while oil production increased by 38 per cent between 2000 and 2018.
Canada is an example of a major oil and gas producing nation that has successfully reduced its methane emissions in the oil and gas sector over the past two decades.
International comparisons show that Canada’s oil and gas sector is doing its part to reduce methane emissions
Introduction
Methane is between 28 and 34 times more potent than carbon dioxide (CO2). Methane emissions result from human activities and from natural sources. Human activity (anthropogenic emission) releases methane mainly from industrial and agricultural activities and landfills. In nature, methane is emitted from a variety of sources including wetlands. Methane is the second most abundant greenhouse gas (GHG) after C02, accounting for more than 20 per cent of global emissions.
In November 2021, 100 countries representing about 70 per cent of the global economy launched the Global Methane Pledge. While Canada is a signatory to the pledge, other major oil and gas producers, including the world’s most significant methane emitters, Russia, China, India, and Australia, have not signed it.
Canada is a significant producer of oil and natural gas. Understanding and quantifying methane emissions from Canada’s oil and gas sector compared to such emissions from other oil and gas producing countries is vital to current discussions about climate change. Methane
emissions continue to increase across the globe, especially in countries that have not signed the Global Methane Pledge.
This CEC study analyzes the Canadian oil and gas sector’s methane emissions record for upstream (crude oil exploration and production) and downstream (refining and sales) activities relative to that of other countries.
Measuring and reporting on methane emissions
Methane emissions occur during the production, processing, storage, distribution, and use of natural gas. Oil production can also generate methane during drilling and extraction.
Flaring and venting are two ways an oil or natural gas producer can generate methane. Venting is the intentional controlled release of un-combusted gases directly into the atmosphere, while flaring is the disposal by combustion of natural gas or gas derived from petroleum.
Estimating and reporting on methane emissions is highly technical. It can differ between countries because of differences in sources, measurement, assessment, and—last but not least—inaccurate reporting and underestimating of methane emissions by oil and gas producers, as is the case with Russia.
Essentially, there are two approaches to measuring methane emissions: the “bottom-up” approach and the “top-down” approach. An emissions inventory developed for regulatory purposes is typically a bottom-up estimate that is derived by compiling an inventory of equipment and estimating the associated emissions for that equipment. At the same time, industry itself engages in top-down estimates by periodically evaluating measured emissions for a geographical region or sector using measurements from cameras, drones, and planes or satellites.
The International Energy Agency (IEA) and the World Bank are two of the most authoritative sources that compare methane emissions among countries and are the primary sources used in this study.
Comparing methane emissions from the oil and gas sector with those from other sources
According to the IEA, there were 591.3 million tonnes (Mt) of methane emitted globally in 2020. The most significant human-caused source of methane emissions is agriculture, which accounted for 145.0 Mt that year, or nearly 25 per cent of all methane emissions. The oil and gas sector emitted an estimated 77.3 MT of methane in 2020—over 13 per cent of methane emitted globally (see Figure 1).
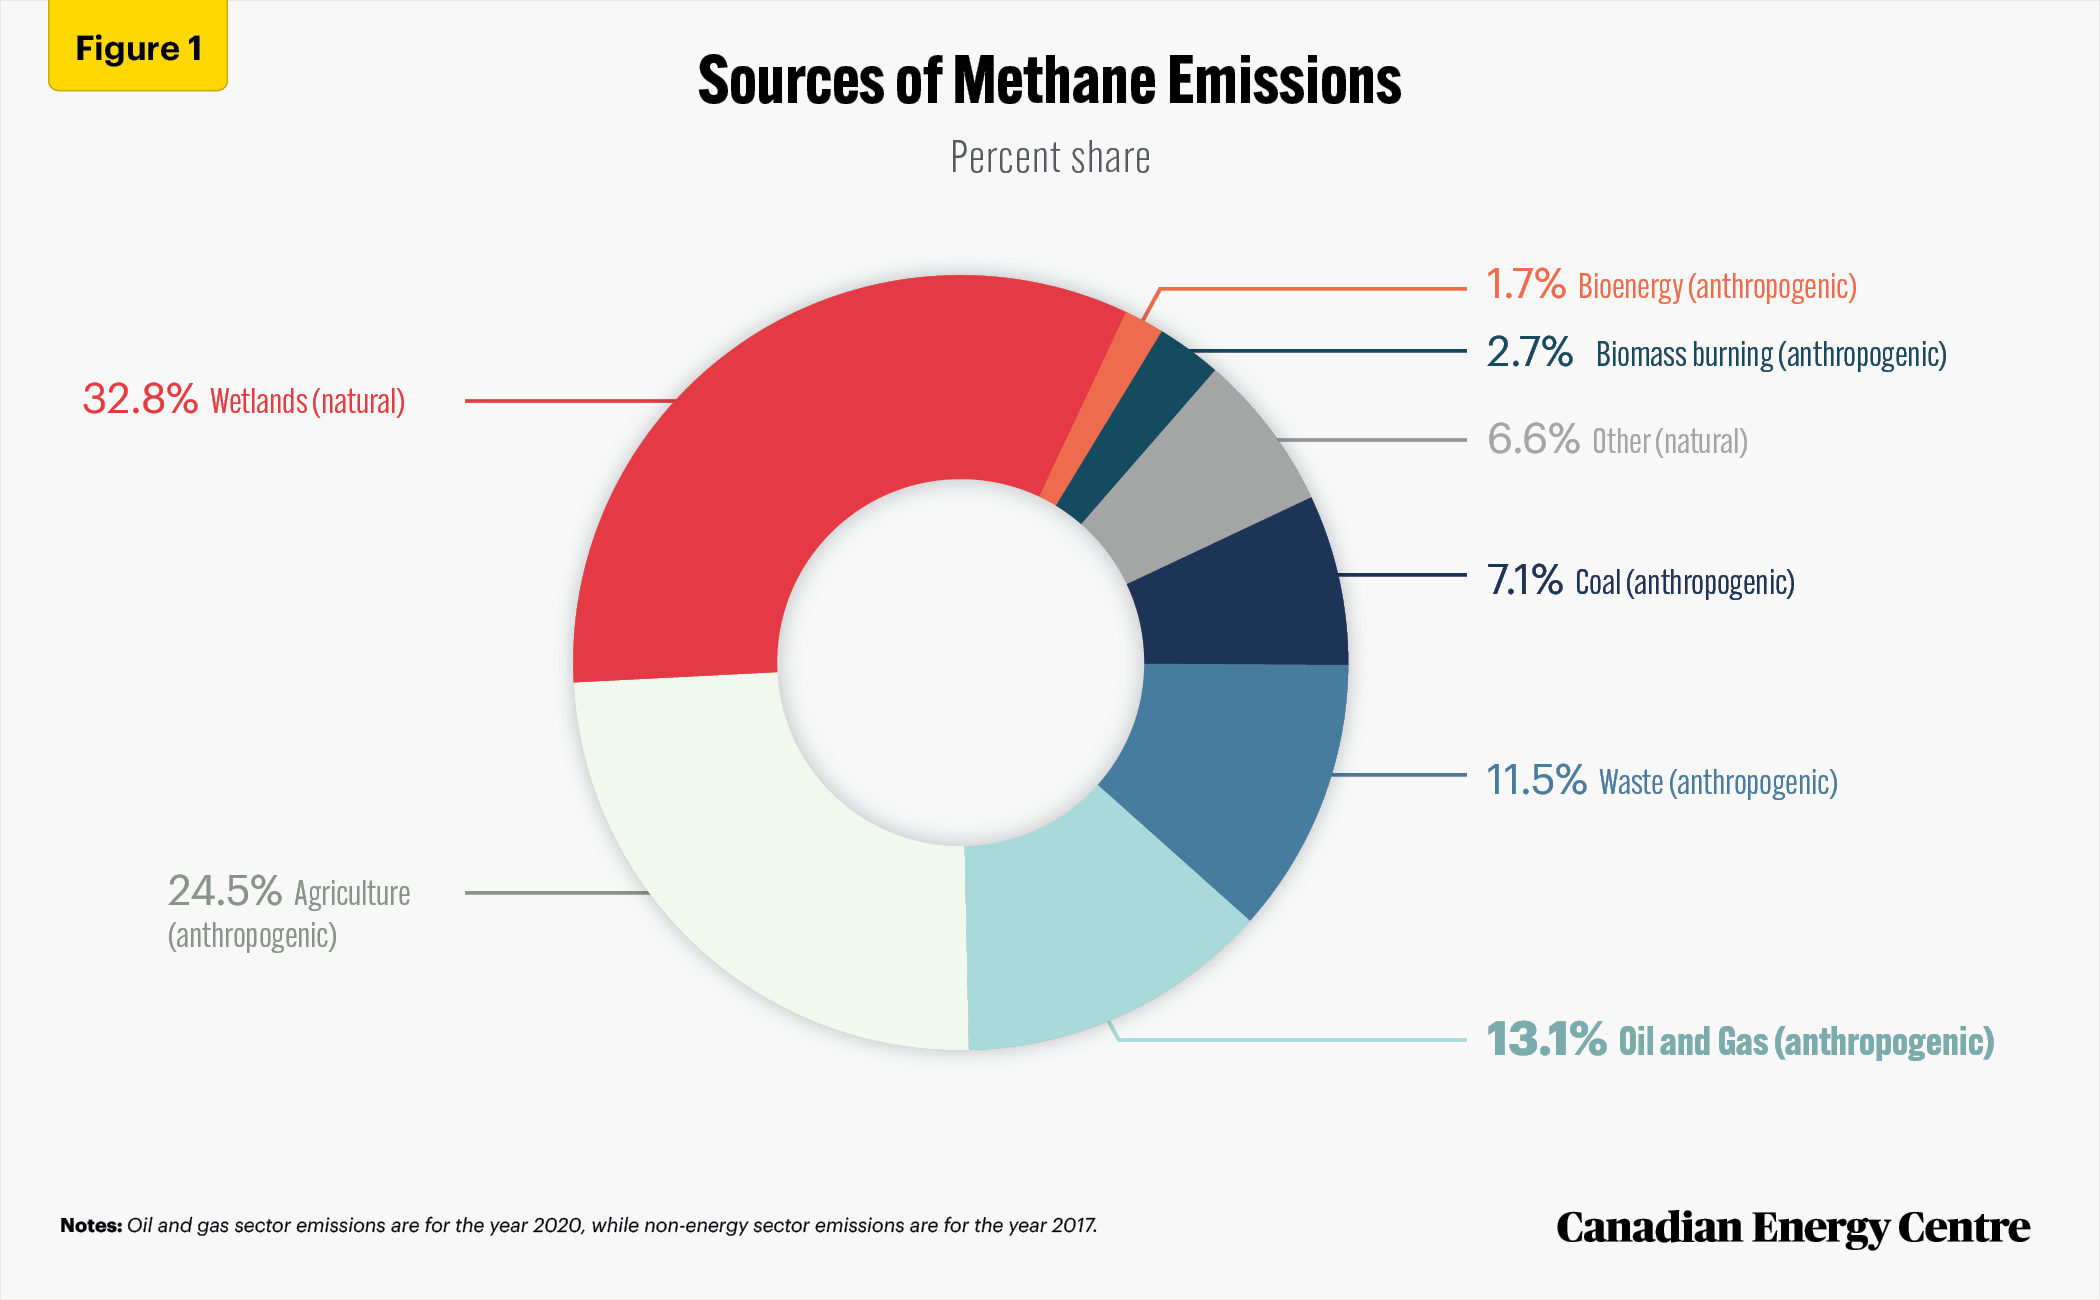
Source: IEA (2021a), and percentage share calculation by authors.
Canada’s Methane Emissions Record Versus Other Major Oil and Gas Producer
Absolute methane emissions
Figure 2 is based on IEA data and presents absolute methane emissions in 2020 from oil and natural gas activities for major oil and gas producing countries. At 14,886 kilotons (kt), Russia recorded higher methane emissions in absolute terms than any other country. Canada emitted 2,098 kt of methane that year. In 2020, Russia, the United States, Iran, and Iraq were responsible for more than half of all global methane emissions from oil and gas production.
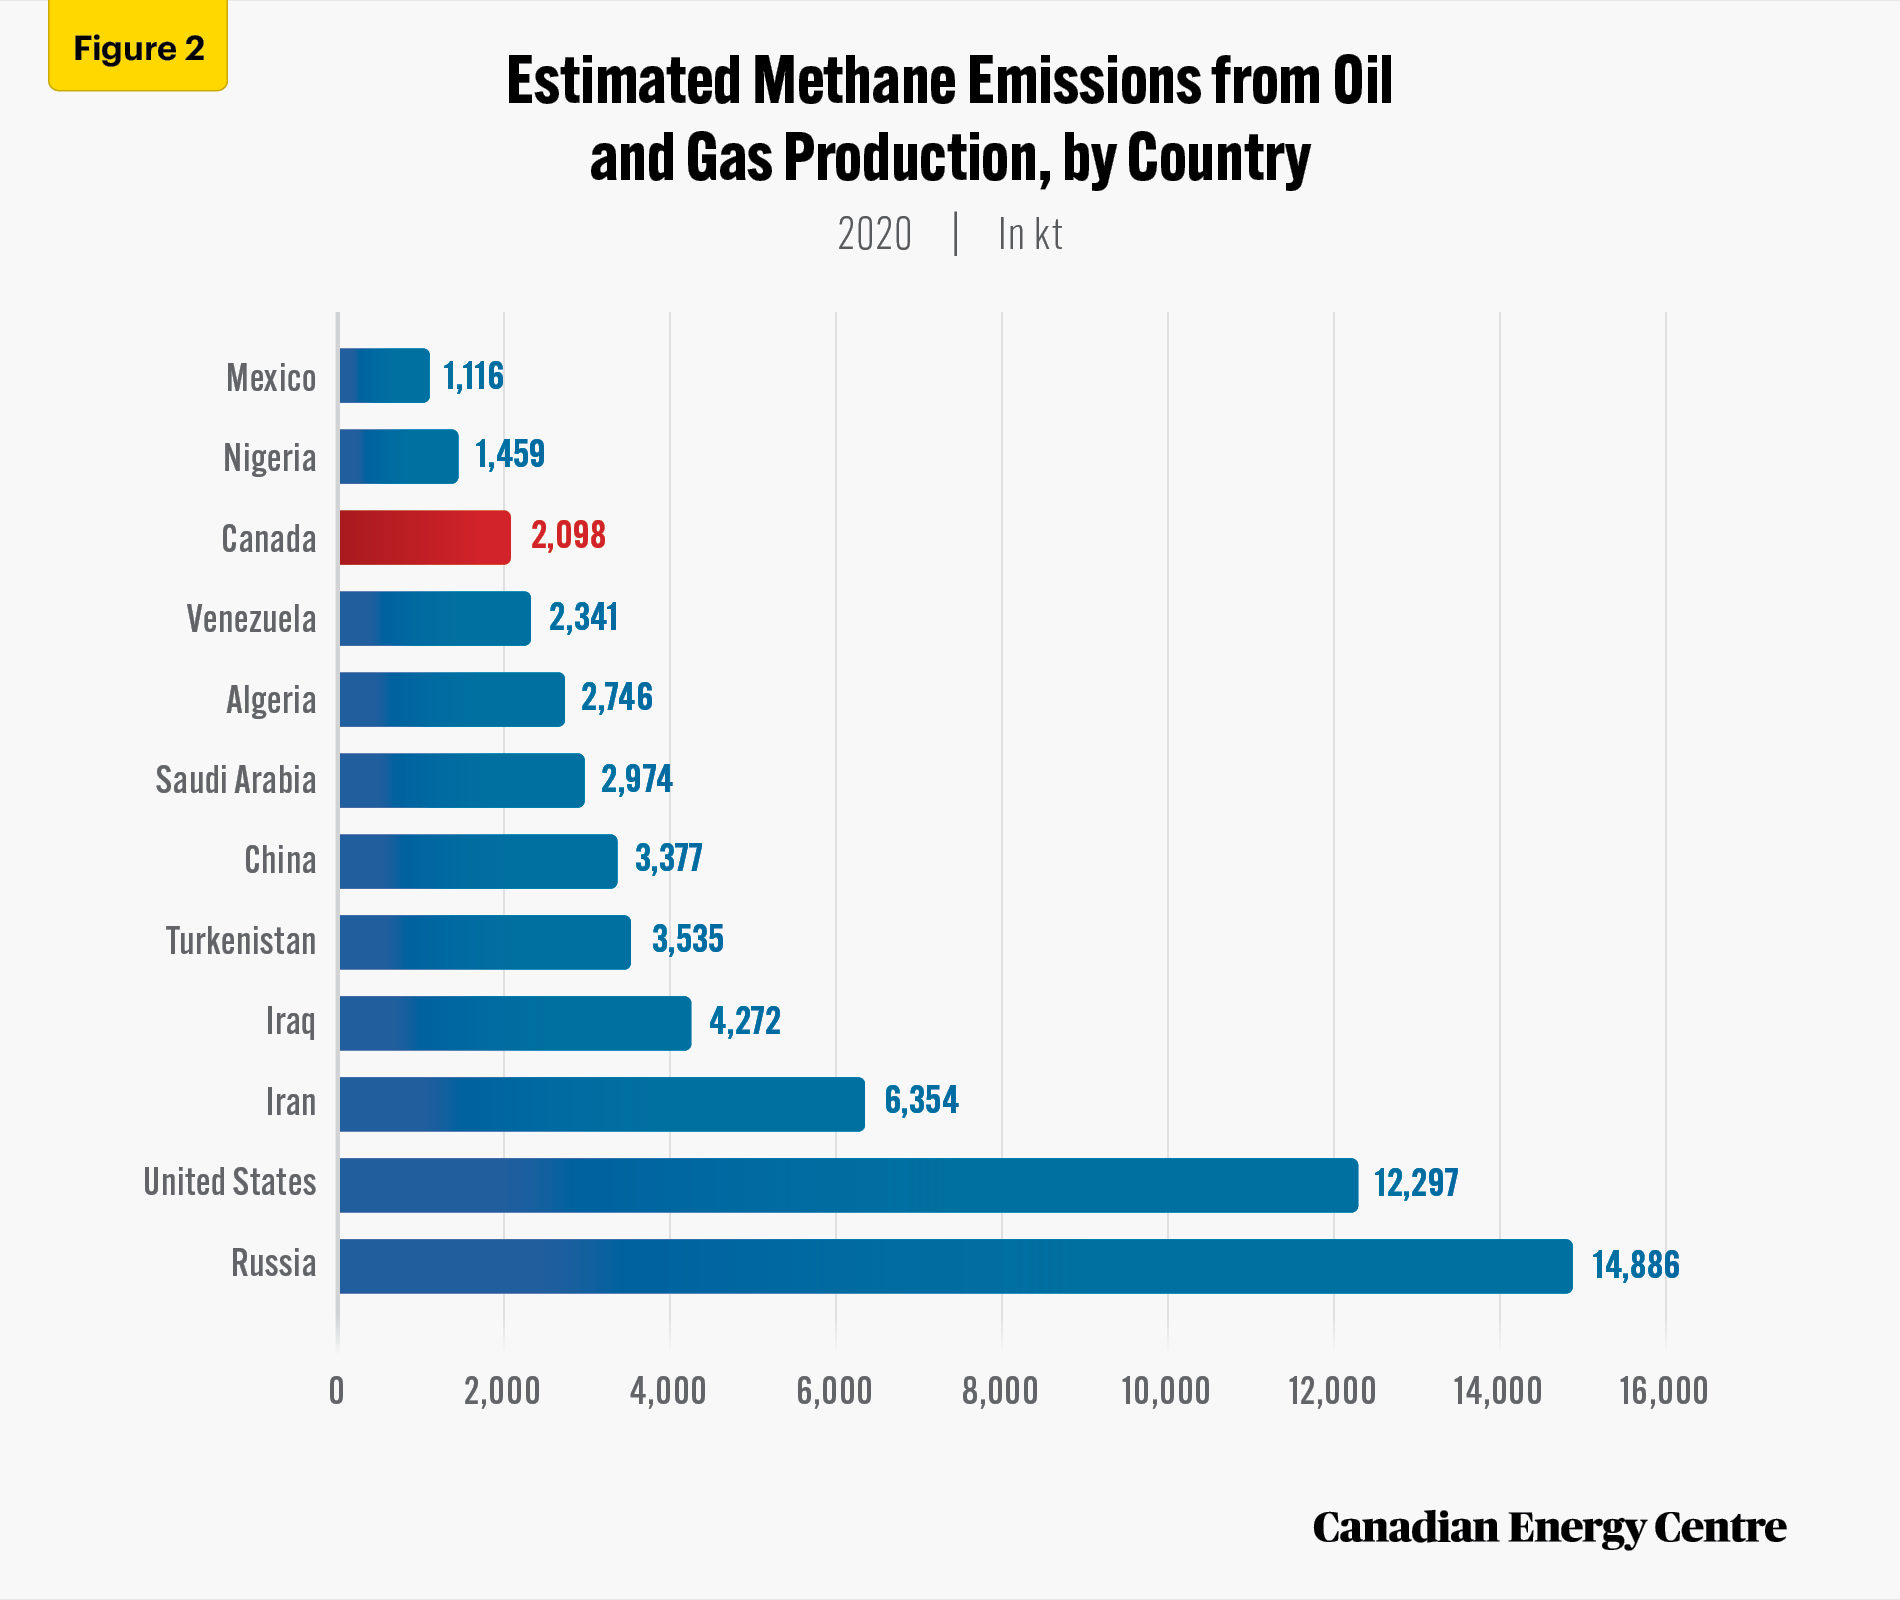
Source: IEA (2021b).
Methane emissions intensity by country for oil and gas production
The methane emissions intensity¹ of oil and gas production varies widely among countries (see Figure 3). At 5.2 tons of methane per kiloton of oil equivalent (tCH4 /ktoe), the methane emissions intensity from Canada’s oil and gas sector is one of the lowest in the world. At the other end of the scale, Venezuela’s methane emissions intensity of 53.4 tCH4/ktoe from its oil and gas production is the highest globally.
1. Methane emissions intensity (tons of methane per kilotons of oil equivalent) is the ratio of the volume of methane emitted to the volume of natural gas produced (upstream) or transmitted or distributed (downstream)
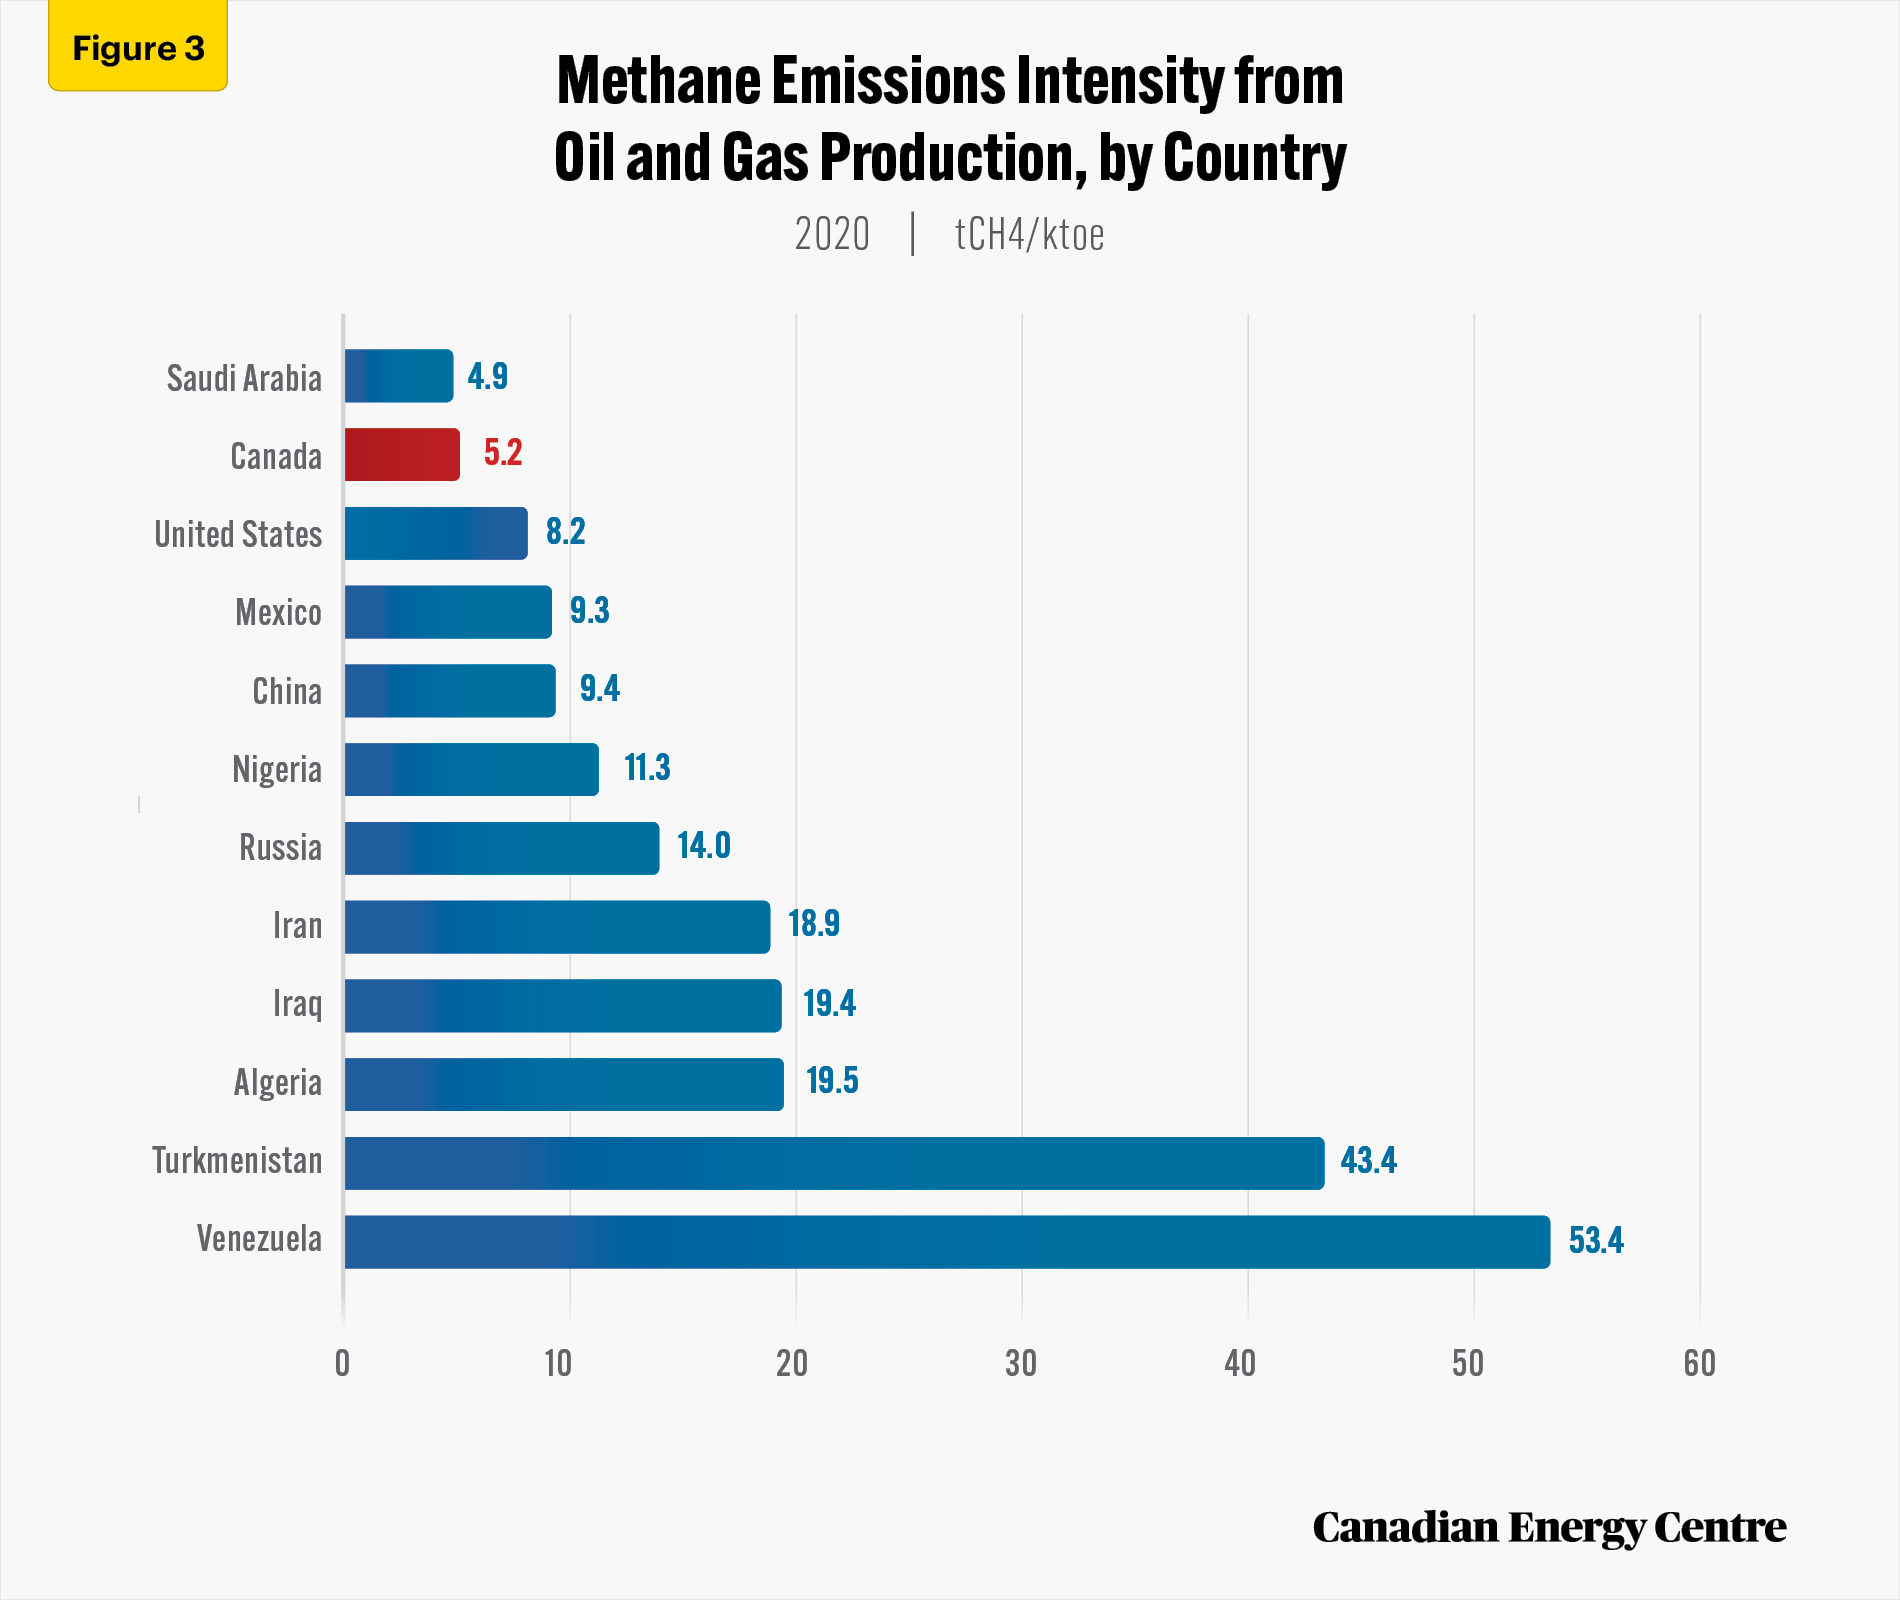
Source: IEA (2021b).
The data show that the methane emissions intensity in Venezuela, which produces heavy crude oil similar to Canada, is ten times higher than in Canada. Among major oil and gas producers, only Saudi Arabia’s oil and gas production has a methane emissions intensity less than Canada’s at 4.9 tCH4 /ktoe. However, the absolute amount of methane emissions from Saudi Arabia’s oil and gas sector was 1.4 times higher than Canada in 2020 (see Figure 2).
Methane emissions from oil and gas production by country for upstream and downstream activities
Both upstream (crude oil exploration and production) and downstream (refining and sales) activities in the oil and gas sector contribute to methane emissions. In 2020, estimated worldwide upstream methane emissions amounted to 61.3 Mt, while estimated downstream methane emissions were approximately 16.0 Mt.
In 2020, Russia was the largest methane emitter in upstream and downstream oil and gas production. Russia accounted for 20 per cent of global upstream oil and gas methane emissions, and 17 per cent of global downstream oil and gas methane emissions. By contrast, Canada’s global share of methane emissions was just 3 per cent from upstream activities and 1.5 per cent from downstream activities (see Figures 4a and 4b).
Source: IEA (2021b) and percentage share calculations by authors.
Source: IEA (2021b) and percentage share calculations by authors.
Comparing the Change in Methane Emissions From the Oil and Gas Sector by Country, 2000 vs. 2018
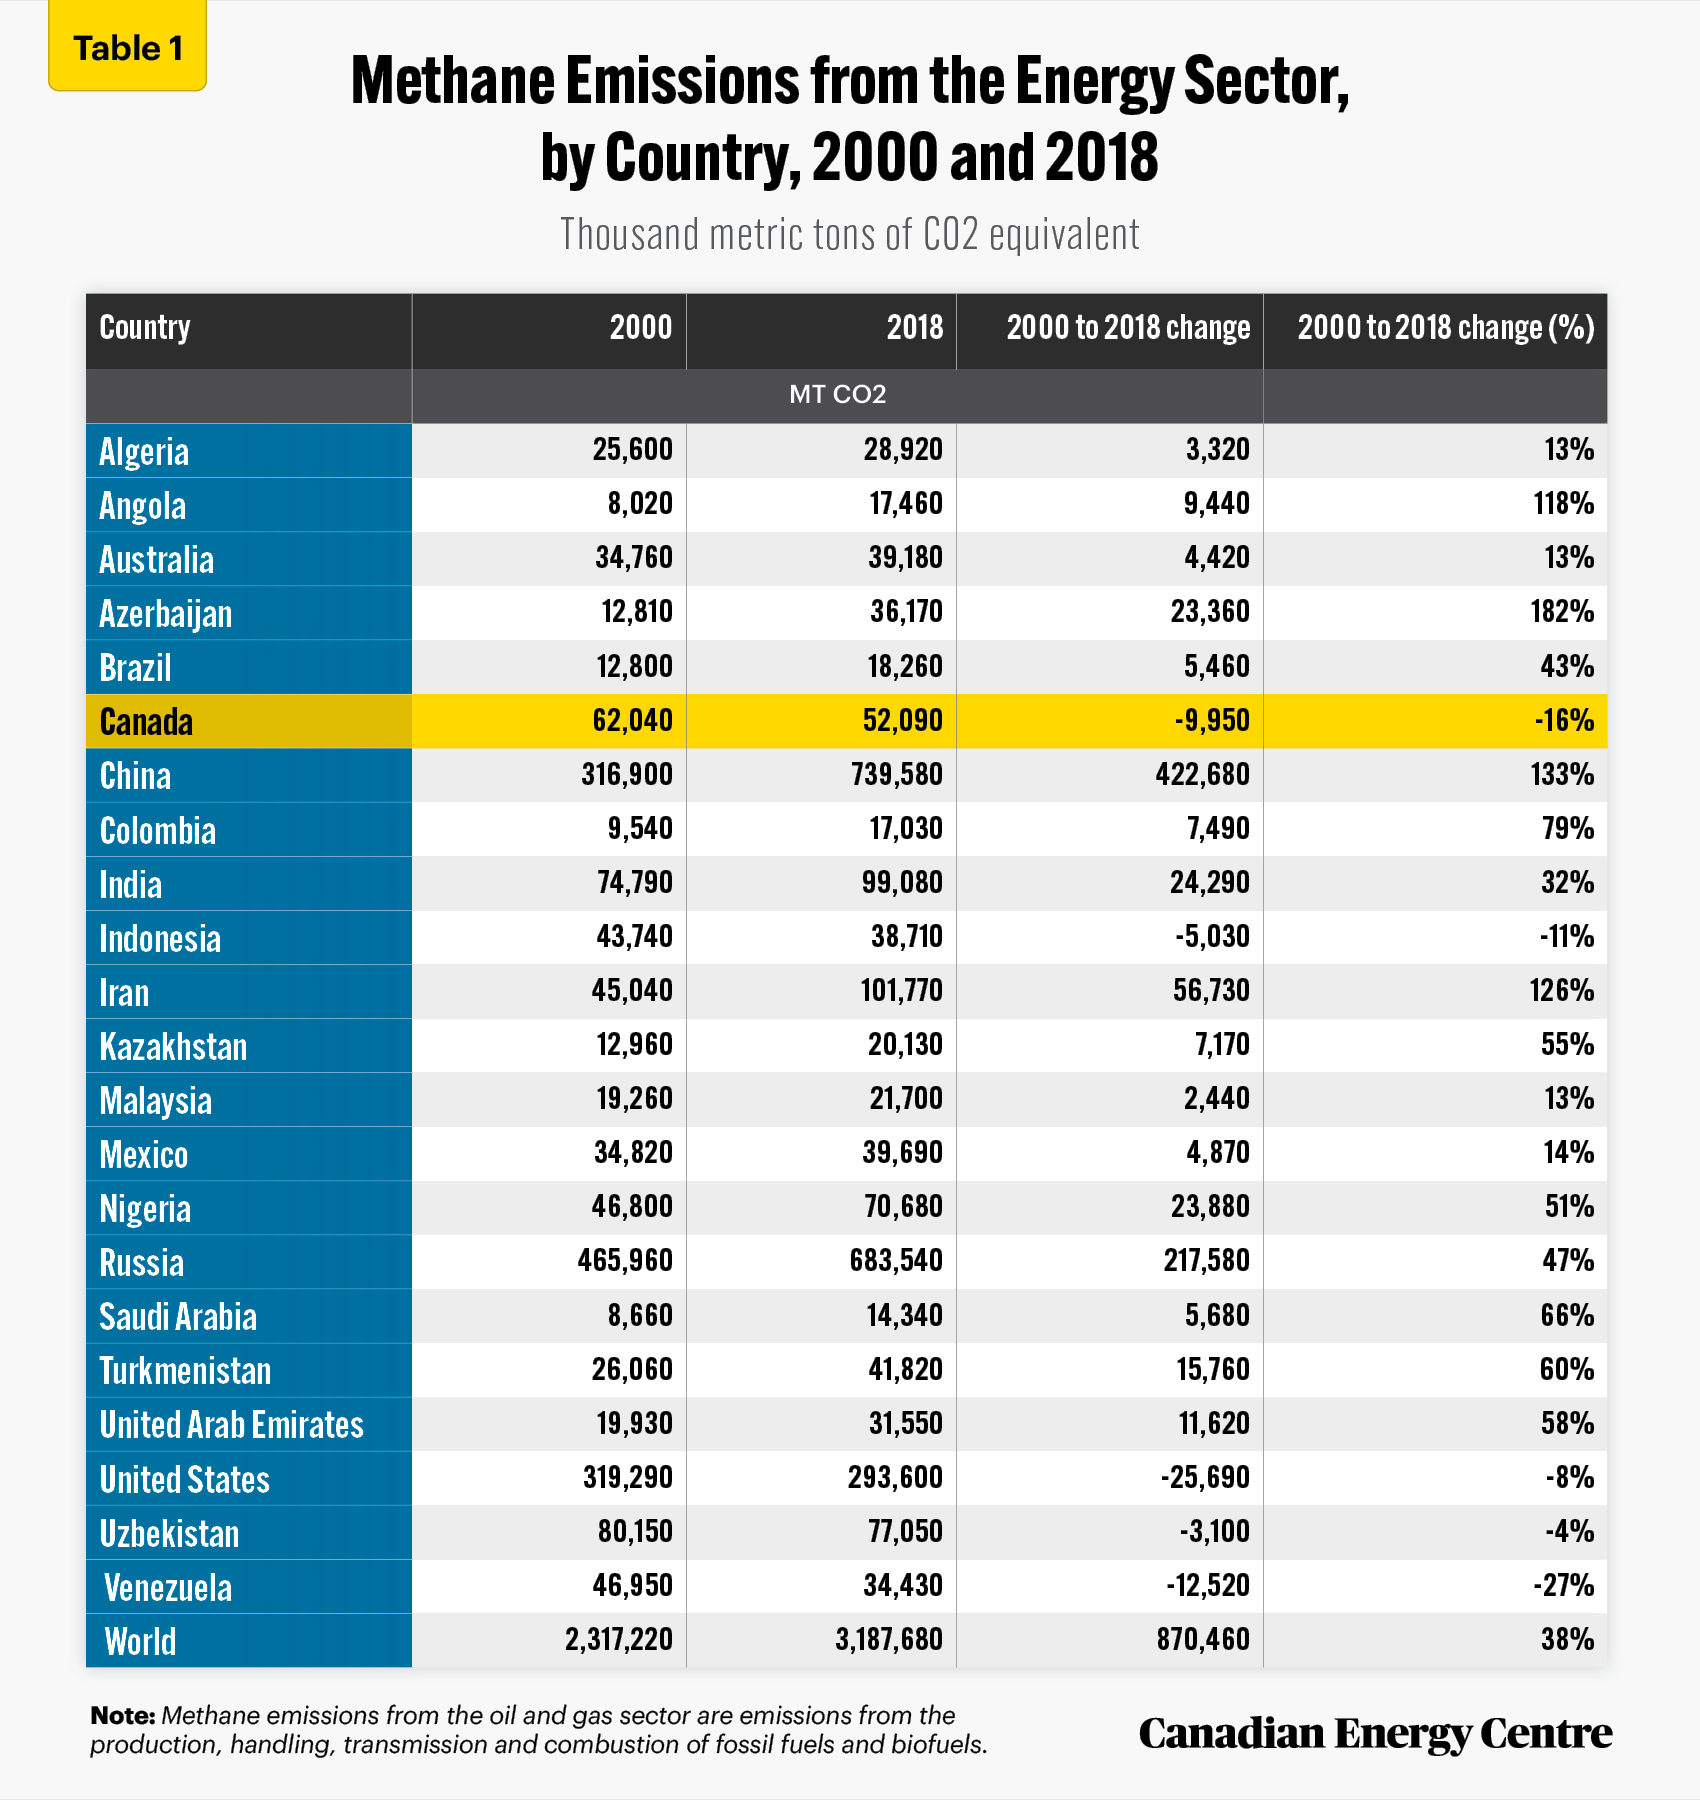
Table 1 compares methane emissions from the oil and gas sector by country for 2000 and 2018 (the latest year available) as collected by the World Bank. The World Bank data through 2018 is understandable and standardized.
In absolute terms, China at 739,580 thousand metric tons of CO2 equivalent (thousand MTCO2e) and Russia (at 683,540 thousand MTCO2e) had higher methane emissions than any other country. Between 2000 and 2018, methane emissions from oil and gas activities in China and Russia increased by 133 per cent and 47 per cent, respectively. In contrast, methane emissions from Canada’s oil and gas sector were 52,090 thousand MTCO2e in 2018. Between 2000 and 2018, methane emissions from Canada’s oil and gas sector fell by 16 per cent.
Source: World Bank Data (2021), and calculation by authors.
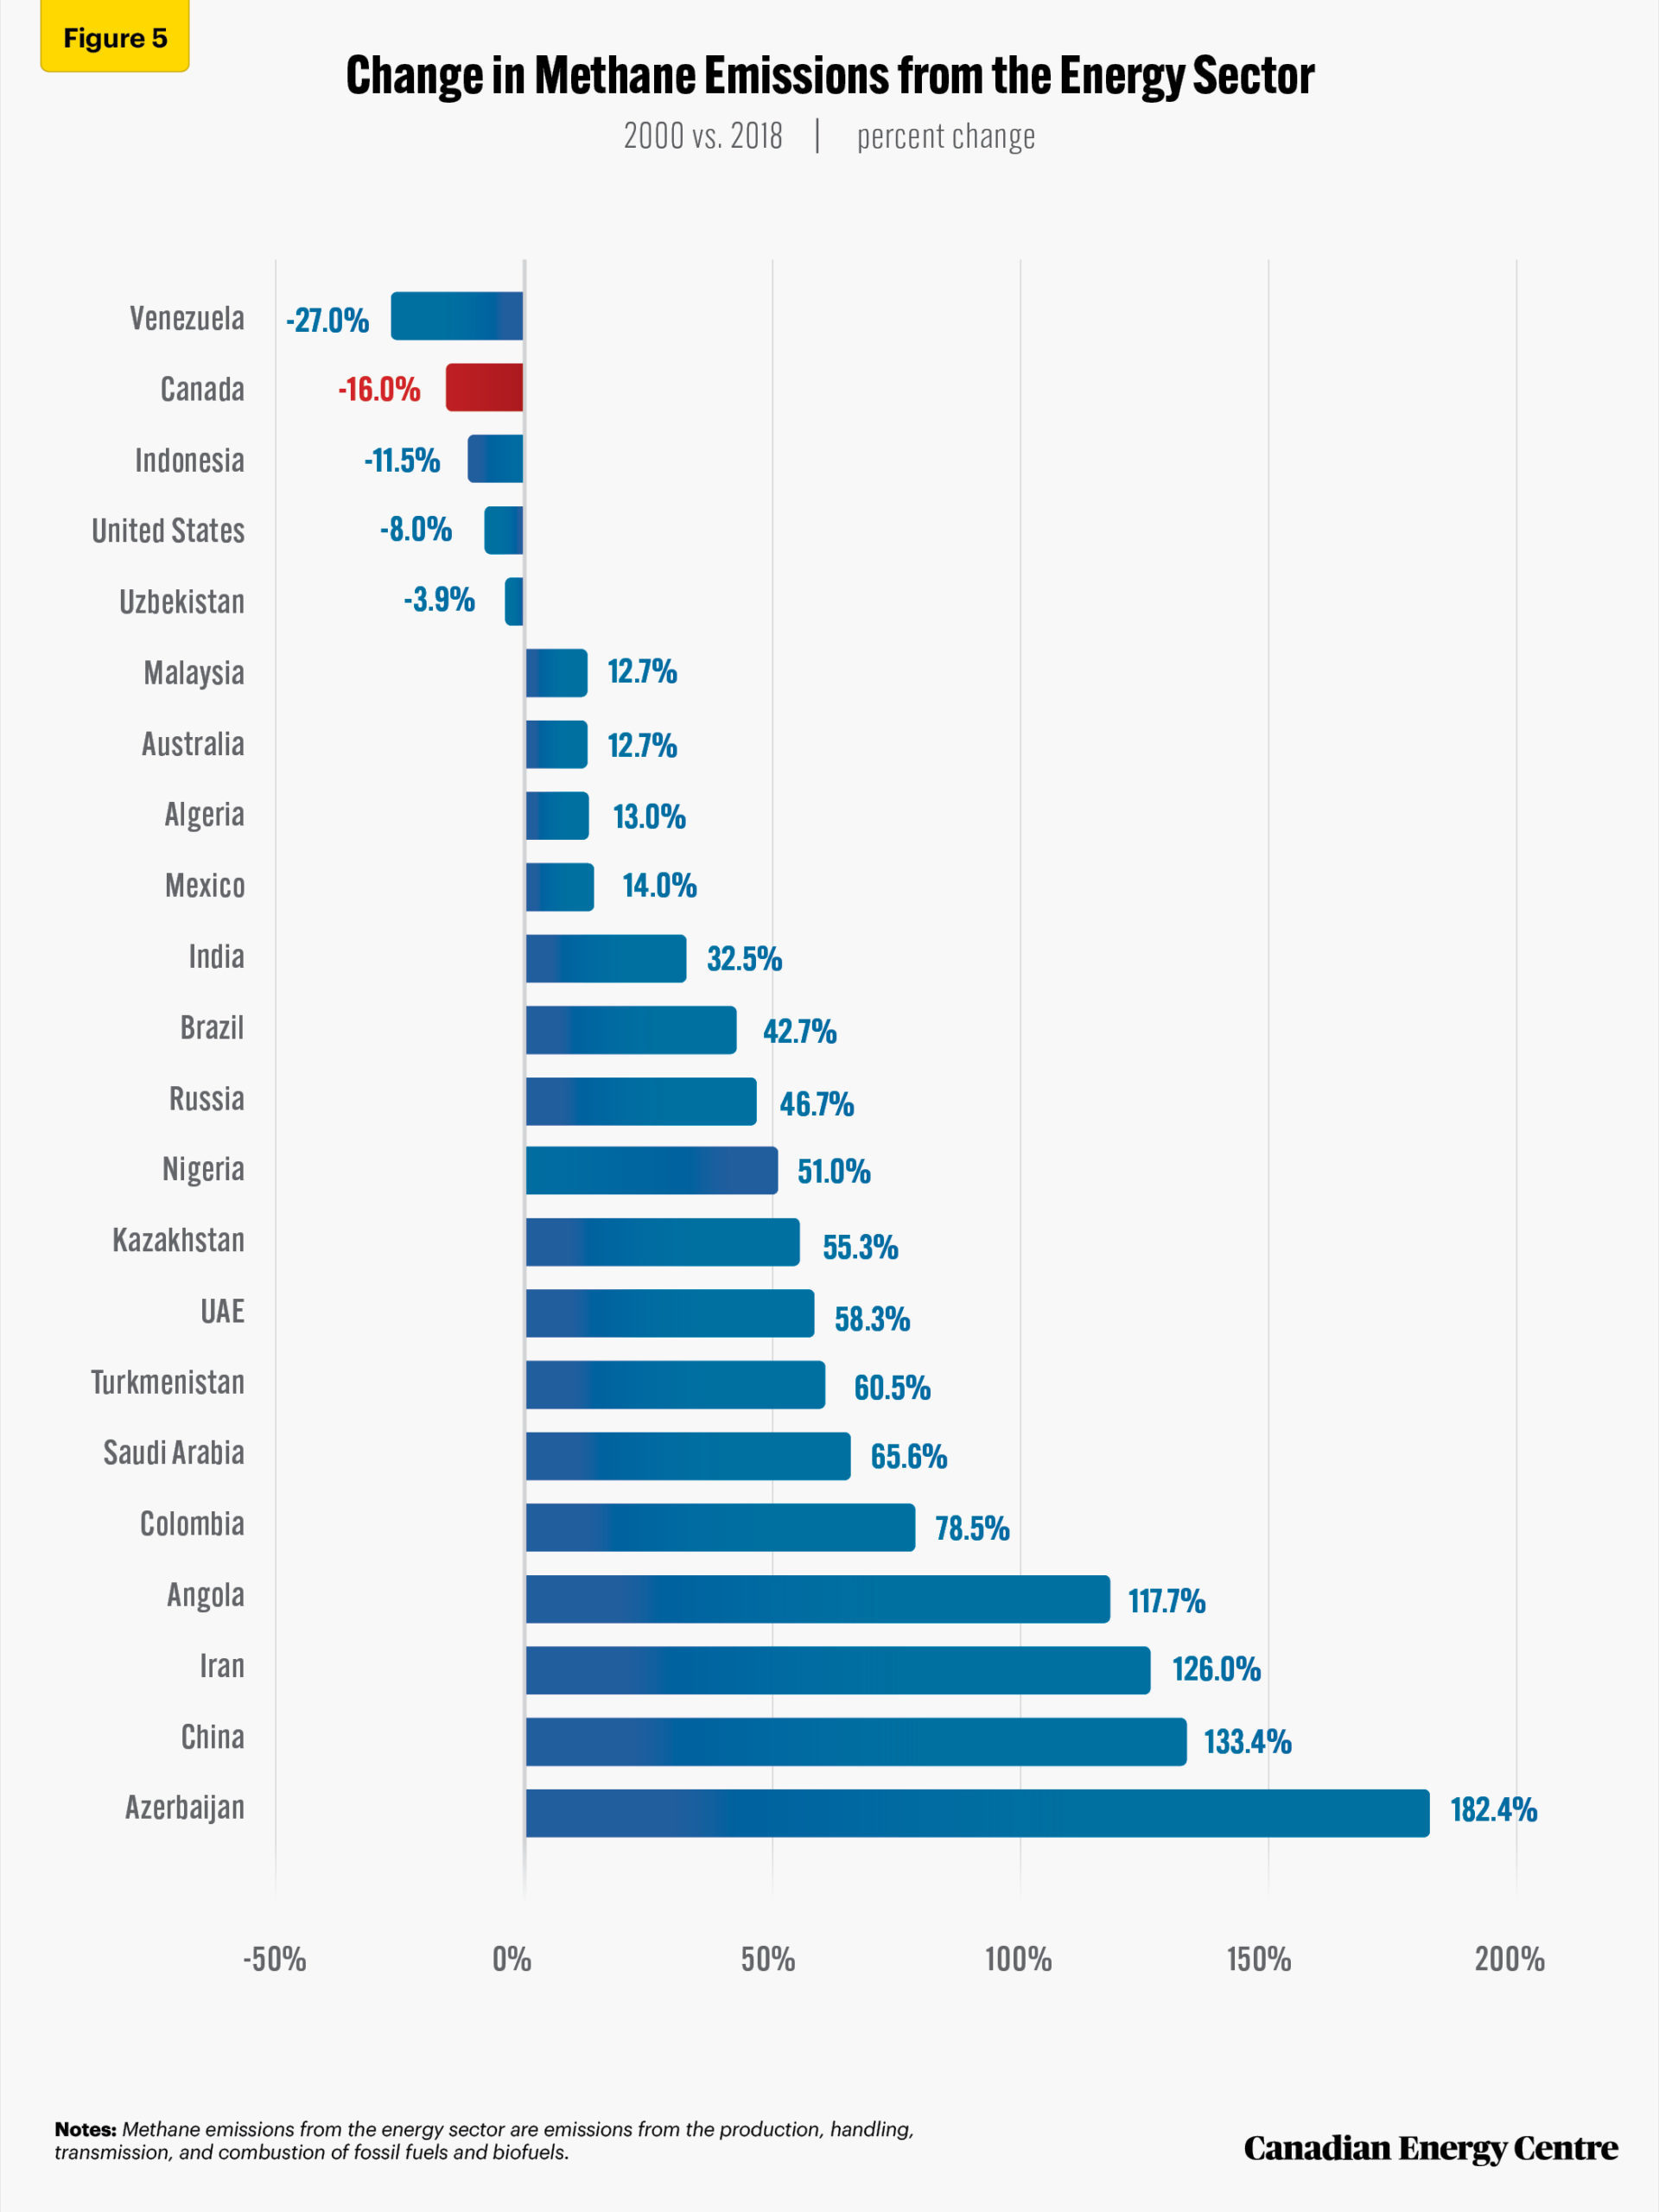
Over the past two decades, Canada’s oil and gas sector has successfully reduced the amount of methane it emits. Figure 5 compares the change in methane emissions for selected oil and gas-producing countries between 2000 and 2018. Only five countries emitted less methane in 2018 than they did in 2000, while 17 countries saw their methane emissions increase. Canada was one of those five, experiencing a decline of 16 per cent, the highest decline other than Venezuela among the major countries measured. It should be noted that Venezuela, which has a methane emissions intensity ten times higher than Canada, saw its absolute methane emissions decline due to the ongoing civil unrest in that country affecting its oil production over the past decade, so for that reason is not considered relevant for our data analysis.
The only other countries that experienced reductions in methane emissions from their oil and gas sectors between 2000 and 2018 were the United States (down 8 per cent), Uzbekistan (down 4 per cent), and Indonesia (down 11 per cent). Aside from China (up 133 per cent) and Russia (up 47 per cent), several significant producers of oil and gas saw their methane emissions increase between 2000 and 2018, including Azerbaijan (up 182 per cent), Iran (up 126 per cent), Angola (up 118 per cent), Saudi Arabia (up 66 per cent), and United Arab Emirates (up 58 per cent).
Source: World Bank Data (2021) and percentage calculation by authors.
Comparing increases and decreases in methane emissions to increases and decreases in oil production by country
To fully grasp how efficiently Canada has been in reducing emissions in the its oil and gas sector, Table 2 compares the increases or decreases in methane emissions with increases or decreases in oil production for major energy-producing countries between 2000 and 2018 (see Table 2).
- Canada’s methane emissions fell by 16 per cent even as its oil production increased by 91 per cent between 2000 and 2018;
- In the United States, methane emissions dropped by 8 per cent, while oil production increased by 99 per cent between 2000 and 2018;
- Other than Canada and the United States, between 2000 and 2018, major energy-producing countries experienced drops in methane emissions and decreased production (Indonesia and Uzbekistan); increases in methane emissions and increases in oil production (Azerbaijan, Kazakhstan, Brazil, Angola, Turkmenistan, United Arab Emirates, Saudi Arabia, Colombia, Iran, India, China, and Russia); or increases in methane emissions and decreases in oil production (Malaysia, Algeria, Nigeria, Mexico, and Australia);
- Worldwide, methane emissions increased by 27 per cent and oil production increased by 38 per cent between 2000 and 2018.
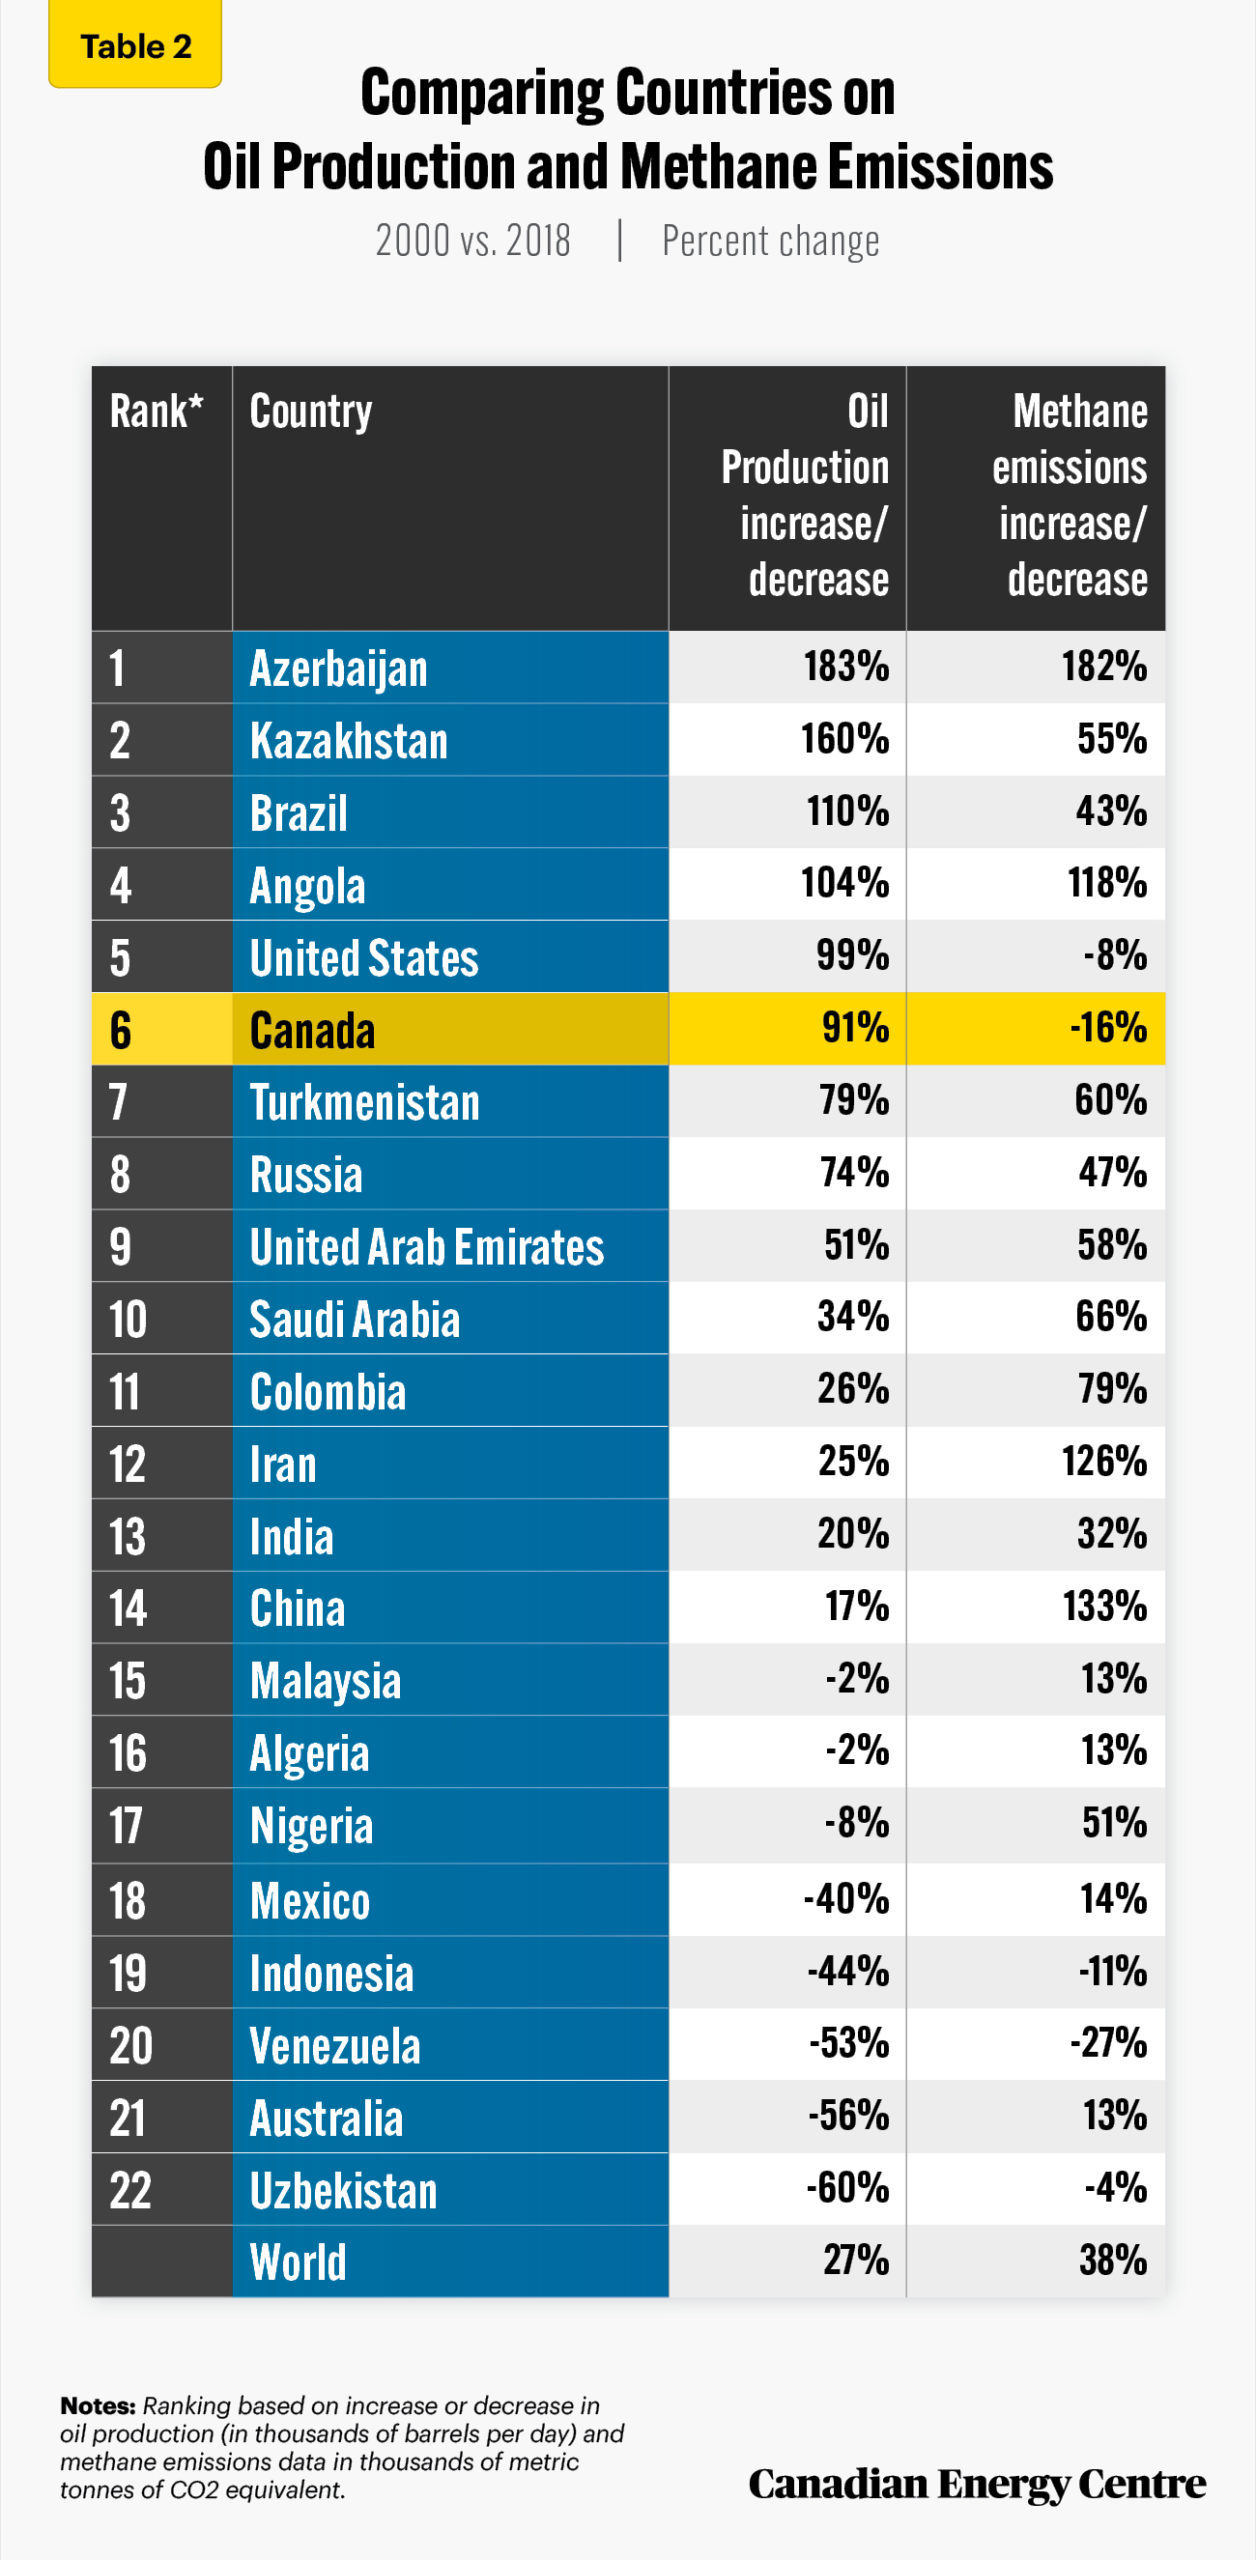
Sources: BP Statistical Review of World Energy Database, World Bank, and percentage calculations by authors.
Conclusion
Methane is a greenhouse gas, so global methane emissions contribute to GHG emissions. Canada’s oil and gas sector has been doing its part to reduce methane emissions over the past two decades. The sector’s methane emissions have declined 16 per cent between 2000 and 2018—one of the best records among major oil and gas producing countries in the world—even as the amount of oil and gas Canada produces has risen by 91 per cent in the same period.
Thus, in the debate over Canada’s role in reducing global GHG emissions, Canada should be seen as an example of a country that is a major player in oil and gas production which has successfully reduced its methane emissions, not only in absolute terms but also while increasing its oil production.
References
British Petroleum Company [BP] (2021). Statistical Review of World Energy 2021. BP. <https://on.bp.com/3qGdggZ>
European Union [EU] (2021, November 2). Launch by United States, the European Union, and Partners of the Global Methane Pledge to Keep 1.5C Within Reach. Statement. EU. <https://bit.ly/3HOcVz7>.
Environment and Climate Change Canada (2021, October 11). Canada Confirms Its Support for the Global Methane Pledge and Announces Ambitious Domestic Actions to Slash Methane Emissions. News Release. Government of Canada. <https://bit.ly/3cKZIsH>.
International Energy Agency [IEA] (2021a). Sources of Methane Emissions. Chart. IEA. <https://bit.ly/3K1AtSg>.
International Energy Agency (IEA) (2021b). Methane Tracker Database. <https://bit.ly/3g9jr77>.
International Energy Agency [IEA] (2021b). World Energy Statistics. Data and Statistics (database). IEA. <https://bit.ly/34nYWOF>.
Natural Resources Canada (undated). Oil, natural gas and coal. Government of Canada. <https://bit.ly/3fQzcQj>
Vaughan, Adam (2021, November 2). COP26: 105 countries pledge to cut methane emissions by 30 per cent. New Scientist. <https://bit.ly/3cHpOwN>.
Holoboff, James (2021, June 21). Which is Better – Bottom-up or Top-down Emissions Estimates? Process Ecology. <https://bit.ly/3nMojDQ>.
Oceanic and Atmospheric Research [OAR] (2021, April 7). Despite Pandemic Shutdowns, Carbon Dioxide and Methane Surged in 2020. NOAA Research News. National Oceanic and Atmospheric Administration. <https://bit.ly/3HEwsRY>.
Saunois, Marielle, Ann R. Stavert, Ben Poulter, et al. (2020). The Global Methane Budget 2000-2017. Earth System Science Data 12, 3: 1561 1623. <https://bit.ly/2ZkKGXz>.
Mufson, Steven, Isabelle Khurshudyan, Chris Mooney, et al. (2021, October 19). Russia Allows Methane Leaks at the Planet’s Peril. Washington Post. <https://wapo.st/3l4Jteo>.
World Bank (Undated). Methane Emissions in the Energy Sector. Chart. Open Data. <https://bit.ly/34dbyuC>.
World Bank (Undated). Methane emissions (kt of CO2 equivalent). Chart. Open Data. World Bank. <https://bit.ly/3CR8i3I>.
United Nations Economic Commission for Europe [UNECE] (undated). Methane Management: The Challenge. UNECE. <https://bit.ly/30QCz5X>.
United States Environment Protection Agency [EPA] (2021). Importance of Methane. EPA. <https://bit.ly/3xjIQCI>.
United States Environment Protection Agency [EPA] (Undated). Overview of Greenhouse Gases. EPA <https://bit.ly/3qSbQ2R>.
United Nations Environment Programme [UNEP] (2021, August 20). Methane Emissions Are Driving Climate Change. Here’s How to Reduce Them. UNEP. <https://bit.ly/3l9bWQi>.
Venkatachalam, Ven, and Mark Milke (2021). International Comparisons of Gas Flaring, 2021 Edition. Canadian Energy Centre. <https://bit.ly/32JcUN7>.
CEC Research Briefs
Canadian Energy Centre (CEC) Research Briefs are contextual explanations of data as they relate to Canadian energy. They are statistical analyses released periodically to provide context on energy issues for investors, policymakers, and the public. The source of profiled data depends on the specific issue. All percentages in this report are calculated from the original data, which can run to multiple decimal points. They are not calculated using the rounded figures that may appear in charts and in the text, which are more reader friendly. Thus, calculations made from the rounded figures (and not the more precise source data) will differ from the more statistically precise percentages we arrive at using the original data sources.
About the authors
This CEC Research Brief was compiled by Ven Venkatachalam, Chief Research Analyst for the Canadian Energy Centre, and Lennie Kaplan, Executive Director of Research for the Canadian Energy Centre.
Acknowledgments and Notes
The authors and the Canadian Energy Centre would like to acknowledge the assistance of Philip Cross as well as the assistance of an anonymous reviewer.
Creative Commons Copyright
Research and data from the Canadian Energy Centre (CEC) is available for public usage under creative commons copyright terms with attribution to the CEC. Attribution and specific restrictions on usage including non-commercial use only and no changes to material should follow guidelines enunciated by Creative Commons here: Attribution-NonCommercial-NoDerivs CC BY-NC-ND.
Photo Credits
Anatoliy Gleb, Marcin Jozwiak, Zoya Loonohod, Marcos Mark, Fred Ferguson