
Social
To sign up to receive the latest Canadian Energy Centre research to your inbox email: inbox@canadianenergycentre.ca
Download the PDF here
Download the charts here
Introduction
While it is well known that the oil and gas sector is an important generator of high paying jobs within the Canadian economy, some of the key demographic characteristics of workers directly employed in the sector are less well known.
In this CEC Fact Sheet, we examine some of the key demographic characteristics of workers directly employed in the oil and gas sector between 2009 and 2021, using the Statistics Canada Natural Resources Satellite Account (NRSA)-Human Resource Model (HRM).
For the purposes of our research, we define the oil and gas sector in Canada as the sum of conventional oil and gas extraction, non-conventional oil and gas extraction, support activities for oil and gas extraction, pipeline transportation of natural gas, crude oil and other pipeline transportation, and petroleum refineries. This is different definition of the oil and gas extraction sector than was used previously by the CEC, because it also includes the pipeline transportation and petroleum refineries sub-sectors. Revisions to the data between 2009 and 2021 also occurred due to the incorporation of the results from the 2020 census. There were also some adjustments to the methodology used to link census years together.
Previously, the data was linked at the level of employment, but it has now moved to linking the demographic ratios instead. The former method led to occasional breaks in the data series.
The conventional and non-conventional oil and gas extraction sector includes establishments engaged primarily in operating oil and gas field properties. This includes the production and extraction of oil from oil shale and oil sands. Support activities for oil and gas extraction include establishments primarily engaged in providing support services, on a contract or fee basis, for the extraction of oil and gas. Pipeline transportation of natural gas comprises establishments primarily engaged in the pipeline transportation of natural gas, from gas fields or processing plants to local distribution systems. Crude oil and other pipeline transportation comprises establishments primarily engaged in the pipeline transportation of crude oil. Petroleum refining involves the transformation of crude oil by such processes as cracking and distillation (Statistics Canada, 2023a).
Natural Resources Satellite Account (NRSA)-Human Resource Model (HRM)
The Natural Resources Satellite Account (NRSA) is an analytical framework used to present Statistics Canada’s existing time series data for the natural resource sector at an increased level of detail. The extraction of energy from natural resources, such as crude oil and natural gas, is included under the NRSA framework (Statistics Canada, 2017).
While the NRSA provides information on the number of jobs generated by the energy sector at the national level, the aim of the Human Resource Module (HRM) is to provide timely and reliable statistics on the human resource dimension of natural resources sub-sectors, such as the oil and gas sector in Canada (Statistics Canada, 2021).
Analysis
The Canadian oil and gas sector directly employs over 147,300 Canadians
In 2021, the oil and gas sector directly employed 147,371 Canadians. The number of direct jobs in the oil and gas sector rose from 158,483 in 2009 to 185,393 in 2014, then fell to 134,939 in 2016, the result of the sharp decline in energy prices, before rising to 160,379 in 2019 as energy prices gradually recovered. The onslaught of COVID-19 in 2020 saw oil and gas sector jobs fall back to 135,475, before recovering to 147,371 in 2021 (see Figure 1).
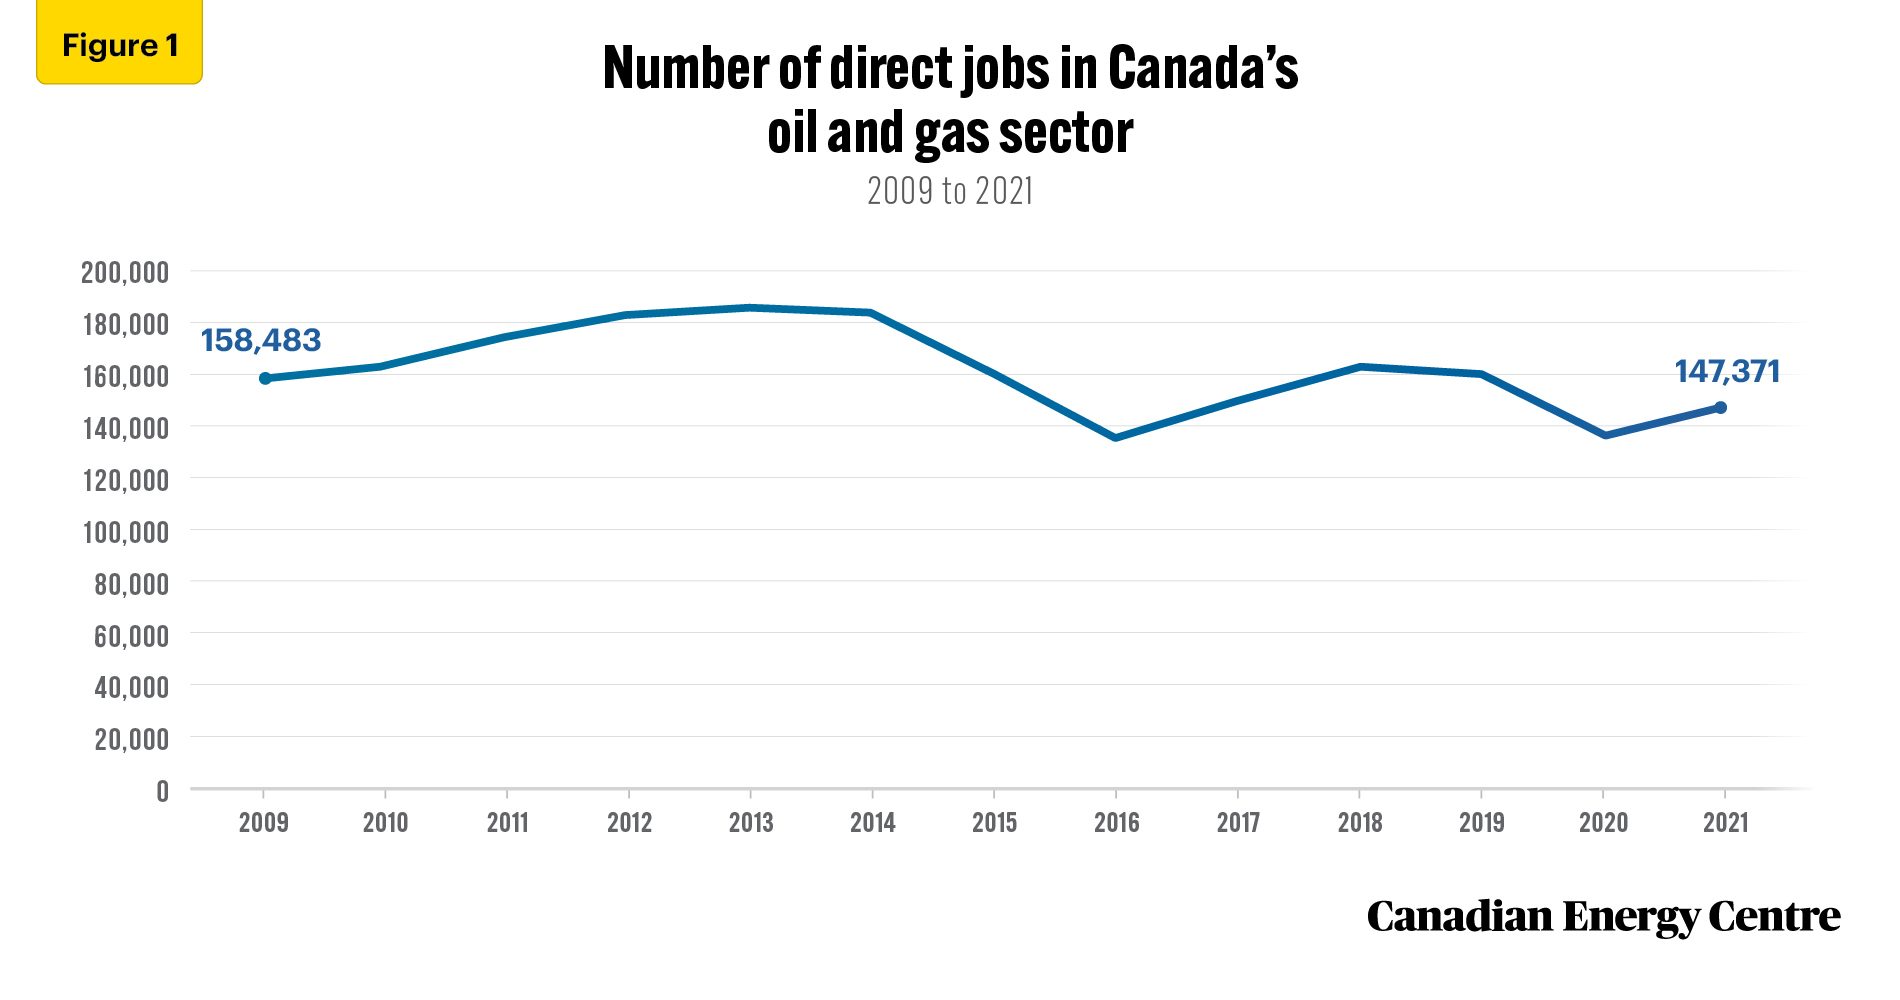
Source: Derived from Statistics Canada (2023c)
At $133,293 in average annual wage and salary in 2021, Canadian oil and gas sector jobs continue to pay very well
The average wage and salary of a worker in the Canadian oil and gas sector in 2021 was $133,293. The average wage and salary for an oil and gas worker rose from $103,448 in
2009 to $133,776 in 2015, before leveling off to $129,716 as of 2019 due to the energy price slump. However, between 2009 and 2021, the average annual wage and salary of a worker in the Canadian oil and gas sector increased by nearly 29 per cent (see Figure 2).

Source: Derived from Statistics Canada (2023c)
The average annual wage and salary for female employees in Canada’s oil and gas sector has increased by over 53% since 2009
The number of females employed in the oil and gas sector reached a high of 42,440 in 2013, dipping to 30,285 in 2020 due to COVID-19, and then recovering to 33,068 in 2021 (see Figure 3).
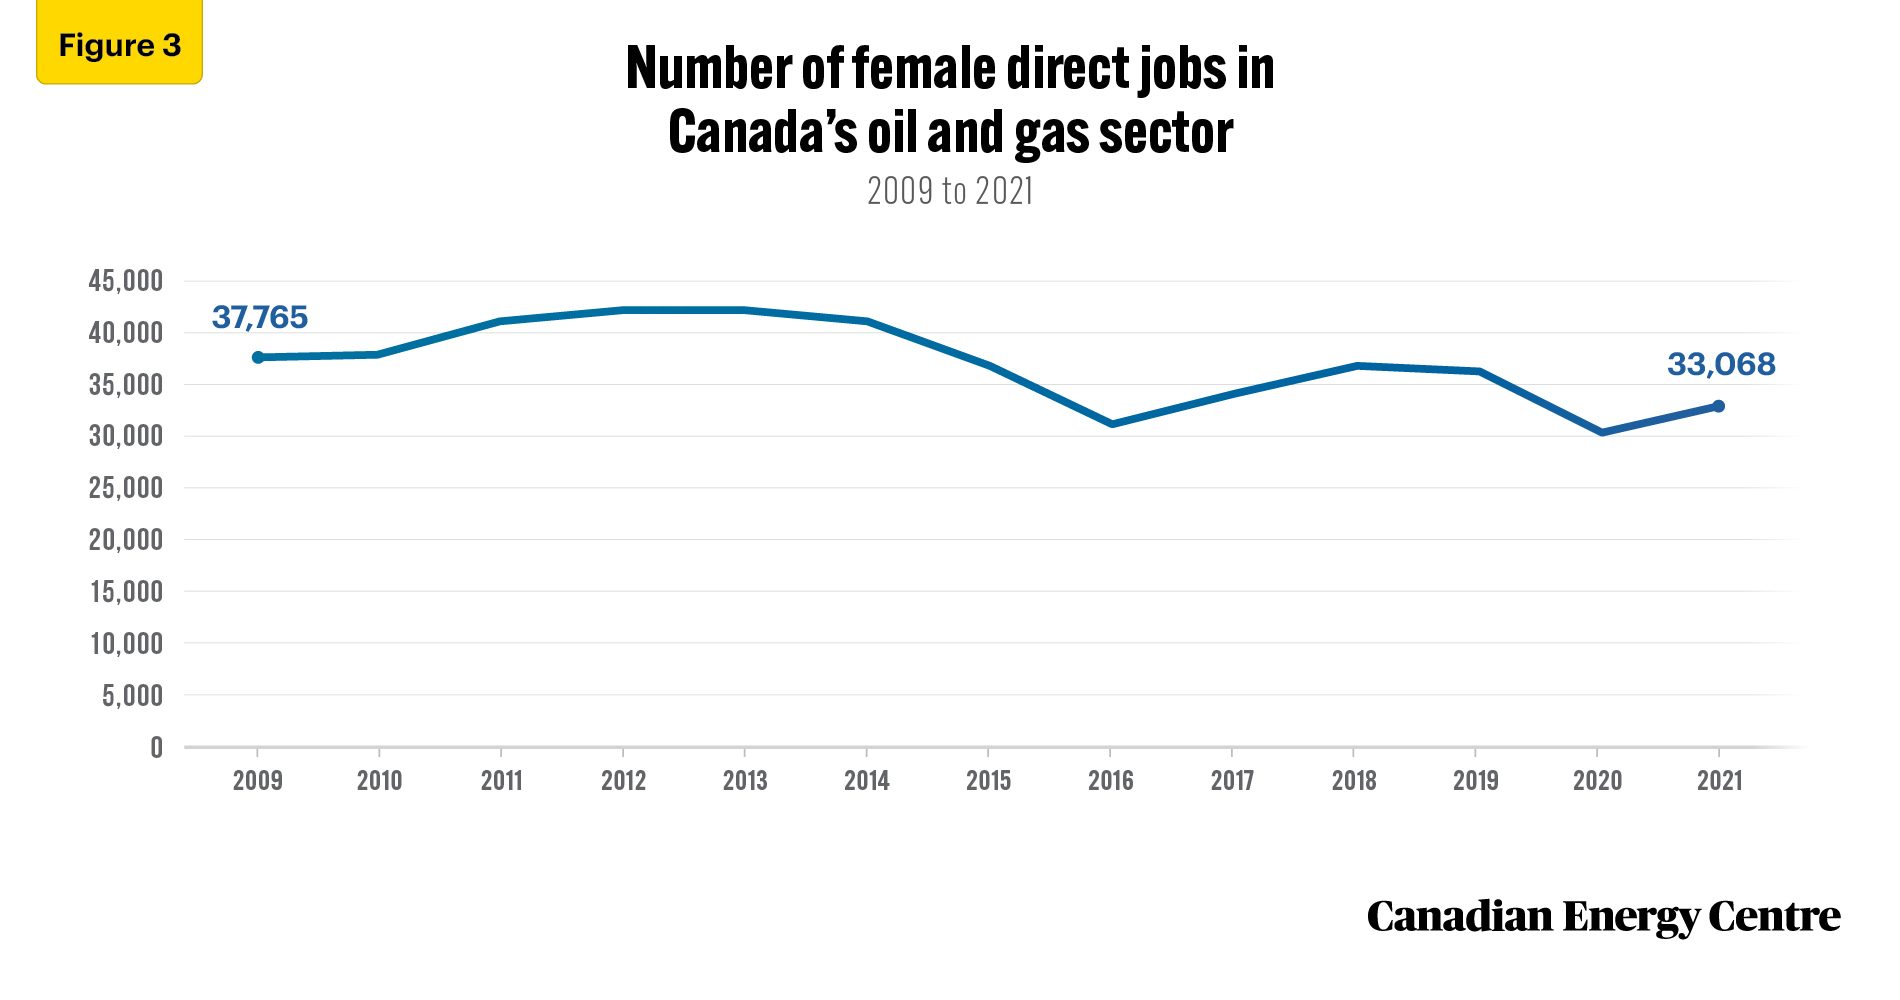
Source: Derived from Statistics Canada (2023c)
In 2021, the average wage and salary for a female directly working in the Canadian oil and gas sector was $106,865. The average wage and salary for a female working in the oil and gas sector reached a high of $110,111 in 2020 before declining to $106,865 in 2021. Between 2009 and 2021, the average wage and salary for a female worker in the Canadian oil and gas industry increased by over 53 per cent (see Figure 4).

Source: Derived from Statistics Canada (2023c)
Average annual wages and salaries for immigrants working in Canada’s oil and gas sector are on the rise, reaches $138,439 in 2021
In 2021, 24,931 immigrants were directly employed in the Canadian oil and gas sector. The number of immigrants employed in the oil and gas industry reached 28,469 by 2014, declining to 21,622 in 2016 before recovering to 26,569 in 2019. Between 2009 and 2021, immigrant employment in the Canadian oil and gas sector increased by over 9 per cent (see Figure 5).

Source: Derived from Statistics Canada (2023c)
The average wage and salary of an immigrant directly employed in the Canadian oil and gas sector was $138,439 in 2021. The average wage and salary of an immigrant employed in the oil and gas sector increased to $143,339 by 2015, declining to $132,266 in 2018 before recovering to $138,439 in 2021. Between 2009 and 2021, the average wage and salary of an immigrant employed in the Canadian oil and gas sector increased by nearly 25 per cent (see Figure 6).
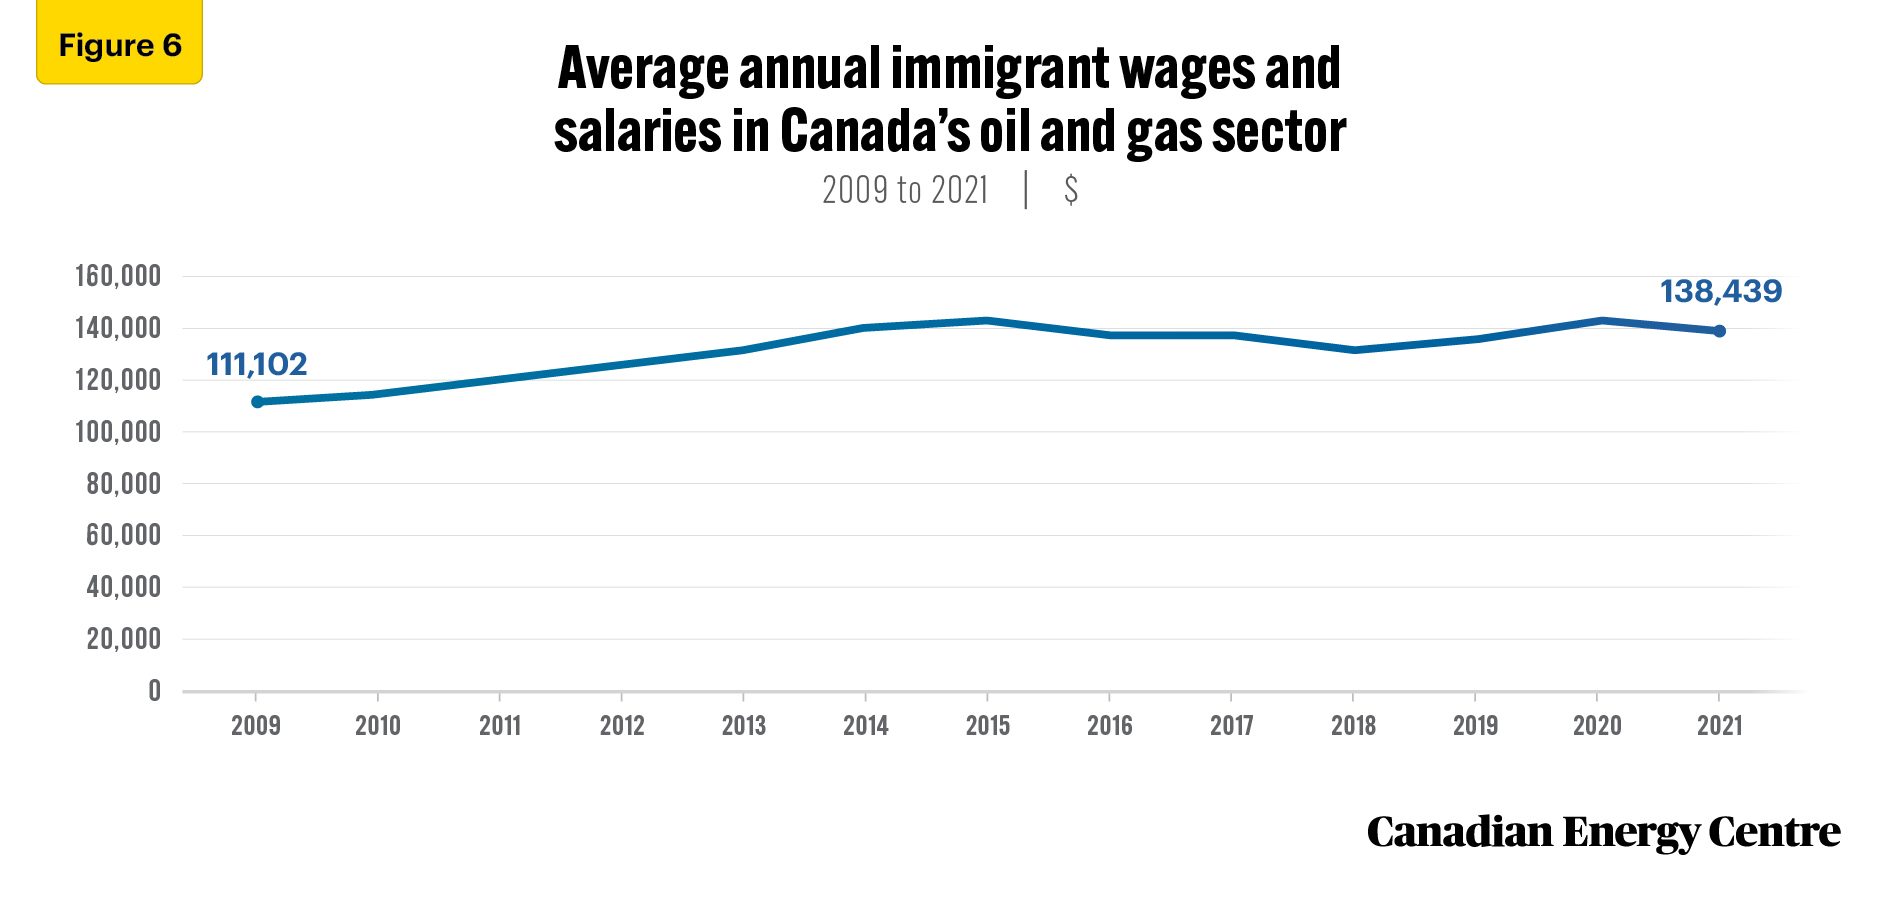
Source: Derived from Statistics Canada (2023c)
Indigenous employment in Canada’s oil and gas sector has increased by nearly 17% since 2009, and average annual wages and salaries reached $111,037 in 2021, an increase of over 39% since 2009
Indigenous direct employment in the oil and gas sector reached 10,934 in 2014, declining to 8,016 in 2016 before recovering to 9,683 in 2021. Between 2009 and 2021, workers in the Canadian oil and gas sector identified as Indigenous increased by nearly 17 per cent (see Figure 7).
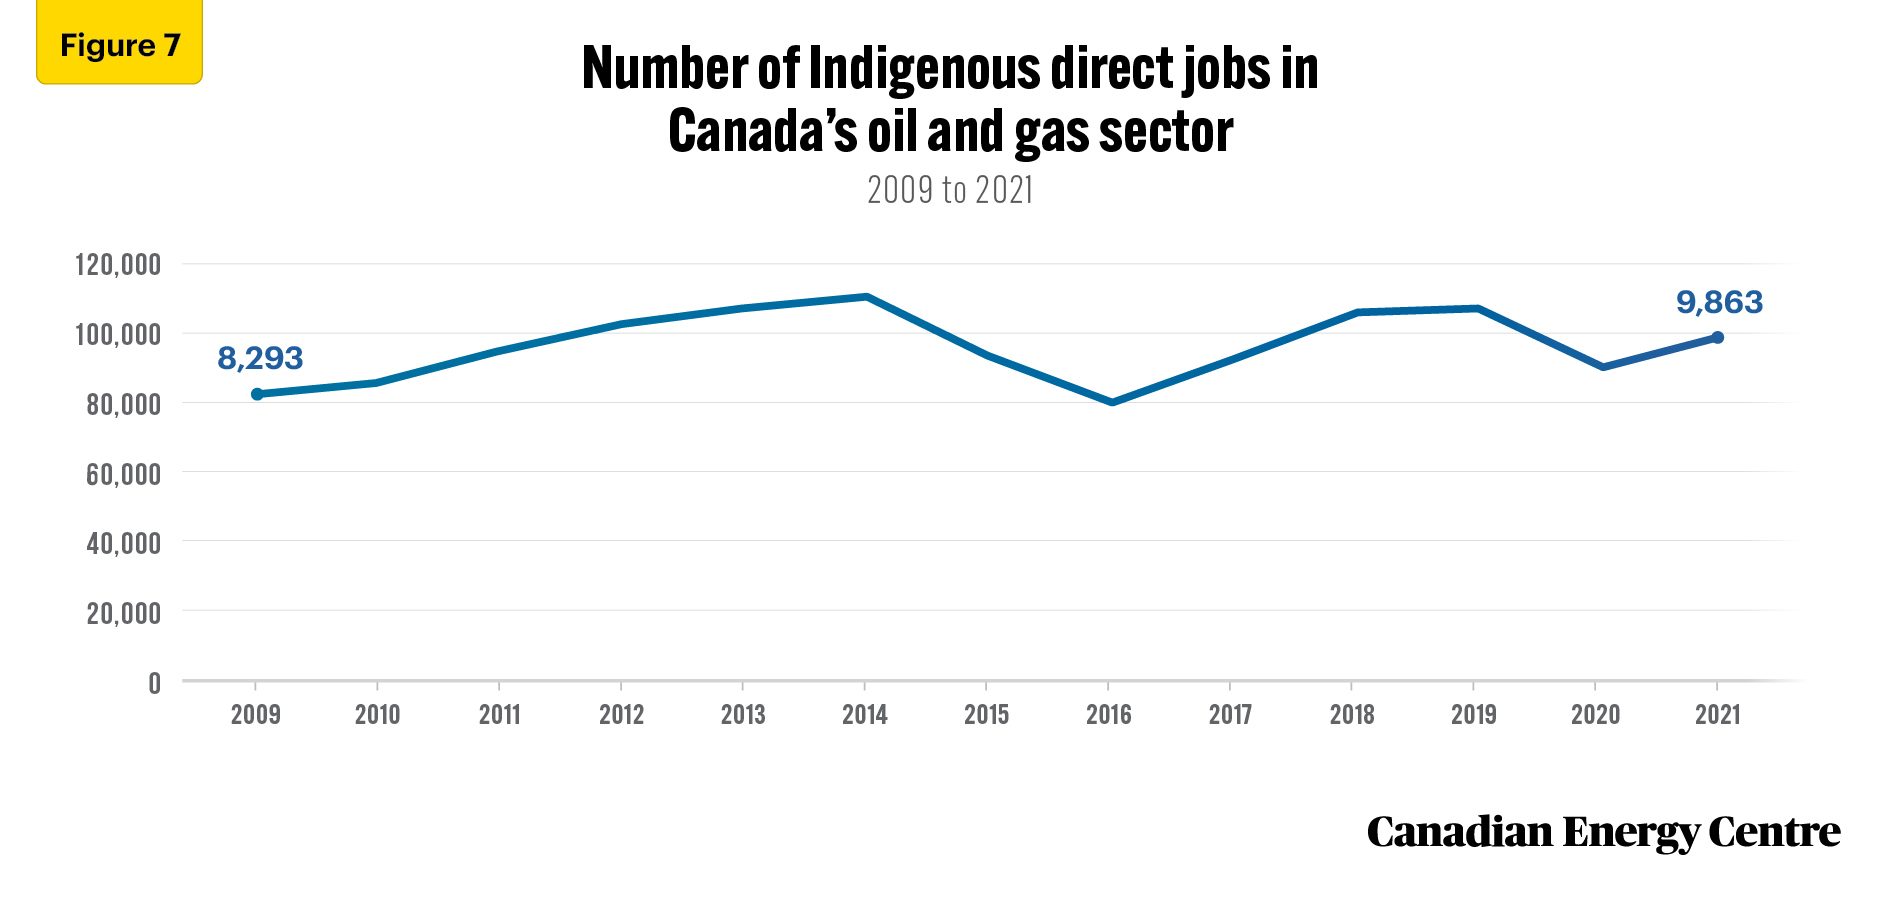
Source: Derived from Statistics Canada (2023c)
The average wage and salary of an Indigenous person directly employed in the Canadian oil and gas sector reached $113,976 by 2020 before declining to $111,037 in 2021. However, between 2009 and 2021, the average wage and salary of an Indigenous person employed in the Canadian oil and gas sector increased by over 39 per cent (see Figure 8).
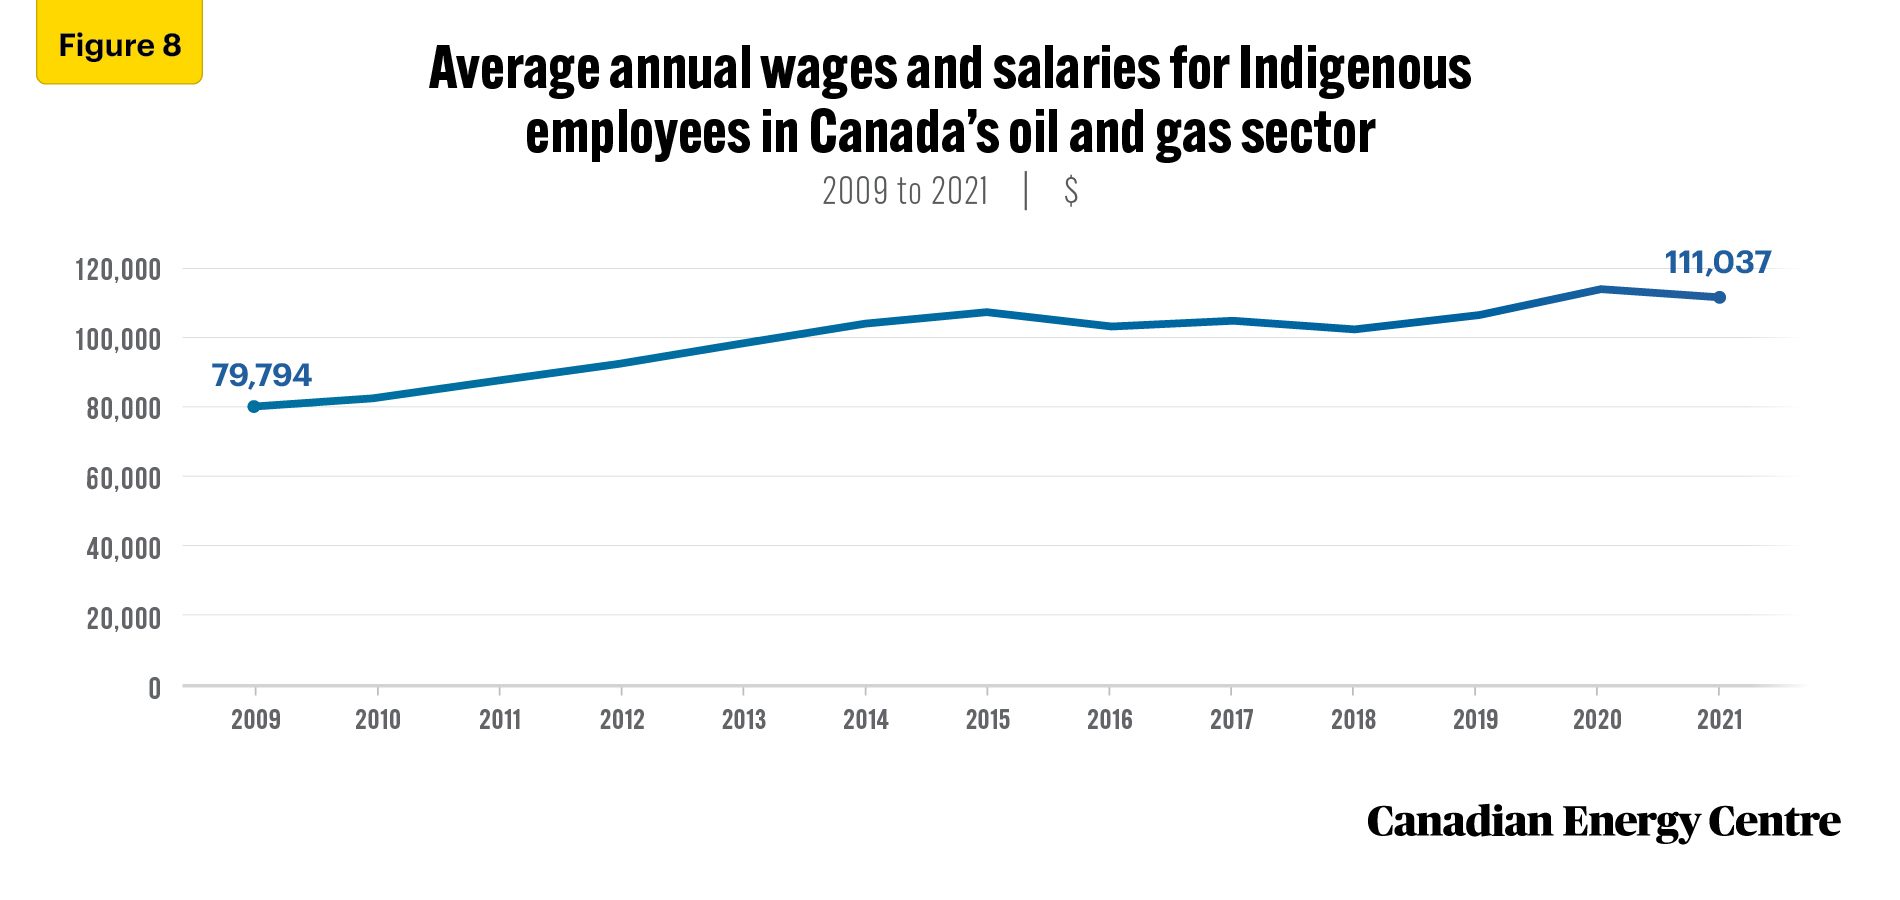
Source: Derived from Statistics Canada (2023c)
Over 21% of workers in the Canadian oil and gas industry identified as visible minorities, earning an average wage and salary of $121,174 in 2021
The number of direct workers in the Canadian oil and gas sector identified as members of a visible minority reached 34,091 in 2014, declining to 25,992 in 2016 before recovering to 33,066 in 2019. Then, visible minority workers in the Canadian oil and gas sector fell to 28,570 in 2020, before recovering to 31,195 in 2021. Between 2009 and 2021, the number of workers in the Canadian oil and gas sector identified as members of visible minorities increased by nearly 17 per cent (see Figure 9).
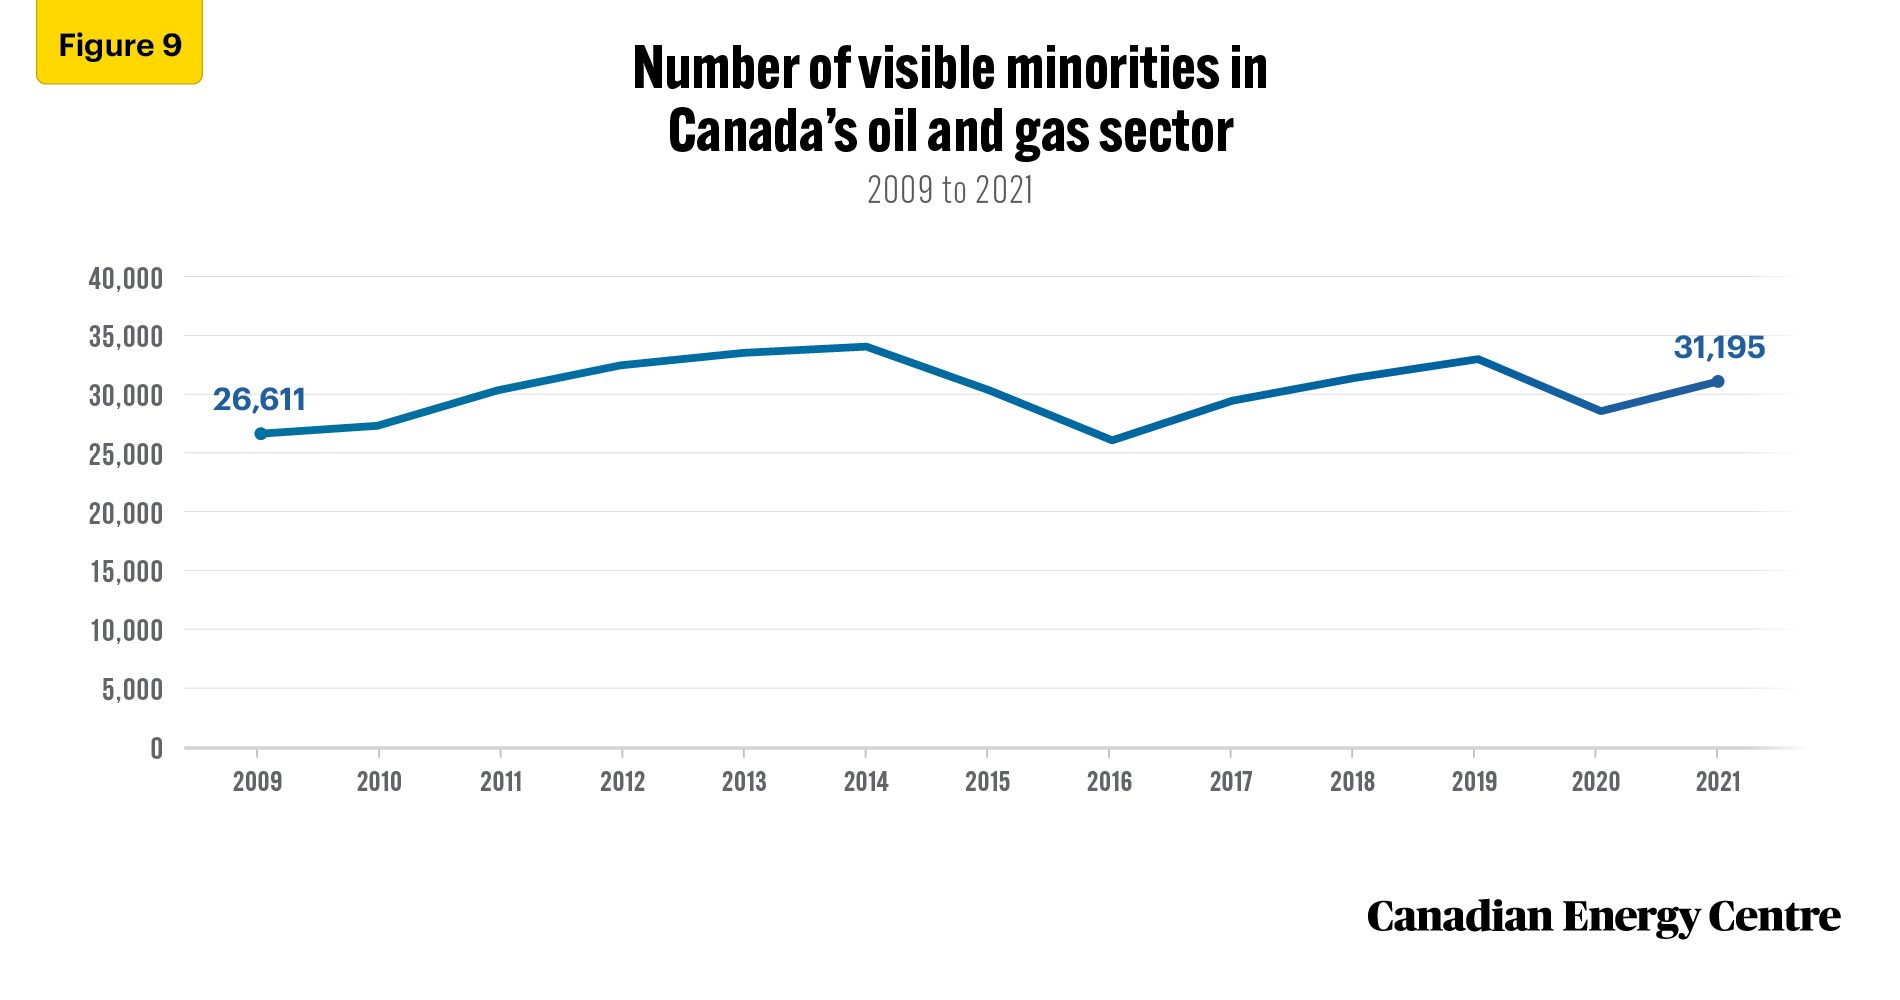
Source: Derived from Statistics Canada (2023c)
In 2021, direct workers identified as members of visible minorities comprised over 21 per cent of total employment in Canada’s oil and gas sector, compared to nearly 17 per cent in 2009. The average wage and salary of workers identified as members of visible minorities in the Canadian oil and gas sector was $121,174 in 2021. This represents an increase of over 30 per cent since 2009 (see Figure 10).

Source: Derived from Statistics Canada (2023c)
Notes
This CEC Fact Sheet was compiled by Lennie Kaplan at the Canadian Energy Centre (www.canadianenergycentre.ca). The author and the Canadian Energy Centre would like to thank and acknowledge the assistance of Philip Cross and two anonymous reviewers in reviewing the original data and research for this Fact Sheet.
References (All links live as of September 11, 2023)
Statistics Canada, 2017. The Natural Resources Satellite Account: Sources and Methods, <https://bit.ly/2VZ1th4>; Statistics Canada, 2021. Natural Resources Satellite Account: Human Resource Module, 2009 to 2019. <https://bit.ly/3zAwcPu>; Statistics Canada, 2023a. North American Industry Classification System (NAICS) Canada. <https://bit.ly/3rPAnp3>; Statistics Canada, 2023b. Natural Resources Satellite Account: Human Resource Module, 2009 to 2021. <https://bit.ly/47YOjkj>; Statistics Canada, 2023c. Natural Resources Satellite Account: Human Resource Module, 2009 to 2021. Special Tabulation.
Creative Commons Copyright
Research and data from the Canadian Energy Centre (CEC) is available for public usage under creative commons copyright terms with attribution to the CEC. Attribution and specific restrictions on usage including non-commercial use only and no changes to material should follow guidelines enunciated by Creative Commons here: Attribution-NonCommercial-NoDerivs CC BY-NC-ND.