Social
To sign up to receive the latest Canadian Energy Centre research to your inbox email: research@canadianenergycentre.ca
Download the PDF here
Download the charts here
Introduction
While it is well known that the oil and gas sector is an important generator of high paying jobs within the Canadian economy, some of the key demographic characteristics of workers directly employed in the sector are less well known.
In this CEC Fact Sheet, we examine some of the key demographic characteristics of workers directly employed in the oil and gas sector between 2009 and 2019 (2020 is not included as it is an anomaly year due to COVID-19), using the Statistics Canada Natural Resources Satellite Account (NRSA)-Human Resource Model (HRM)
For the purposes of our research, we define the oil and gas sector in Canada as the sum of conventional and non-conventional oil and gas extraction and support activities for oil and gas extraction. The oil and gas extraction sector includes establishments engaged primarily in operating oil and gas field properties. This includes the production and extraction of oil from oil shale and oil sands. Support activities for oil and gas extraction include establishments primarily engaged in providing support services, on a contract or fee basis, for the extraction of oil and gas (Statistics Canada, 2021a).
Natural Resources Satellite Account (NRSA)-Human Resource Model (HRM)
The Natural Resources Satellite Account (NRSA) is an analytical framework used to present Statistics Canada’s existing time series data for the natural resource sector at an increased level of detail. The extraction of energy from natural resources, such as crude oil and natural gas, is included under the NRSA framework (Statistics Canada, 2017).
While the NRSA provides information on the number of jobs generated by the energy sector at the national level, the aim of the Human Resource Module (HRM) is to provide timely and reliable statistics on the human resource dimension of natural resources sub-sectors, such as the oil and gas sector in Canada (Statistics Canada, 2021c).
The Canadian oil and gas sector directly/indirectly (including support activities for oil and gas extraction) employs nearly 140,000 Canadians
In 2019, the oil and gas sector directly/indirectly employed 139,975 Canadians. The number of direct jobs in the oil and gas sector rose from 139,635 in 2009 to 168,810 in 2014, then fell to 118,990 in 2016, the result of the sharp decline in energy prices, before rising to 139,975 in 2019 as energy prices gradually recovered (see Figure 1).
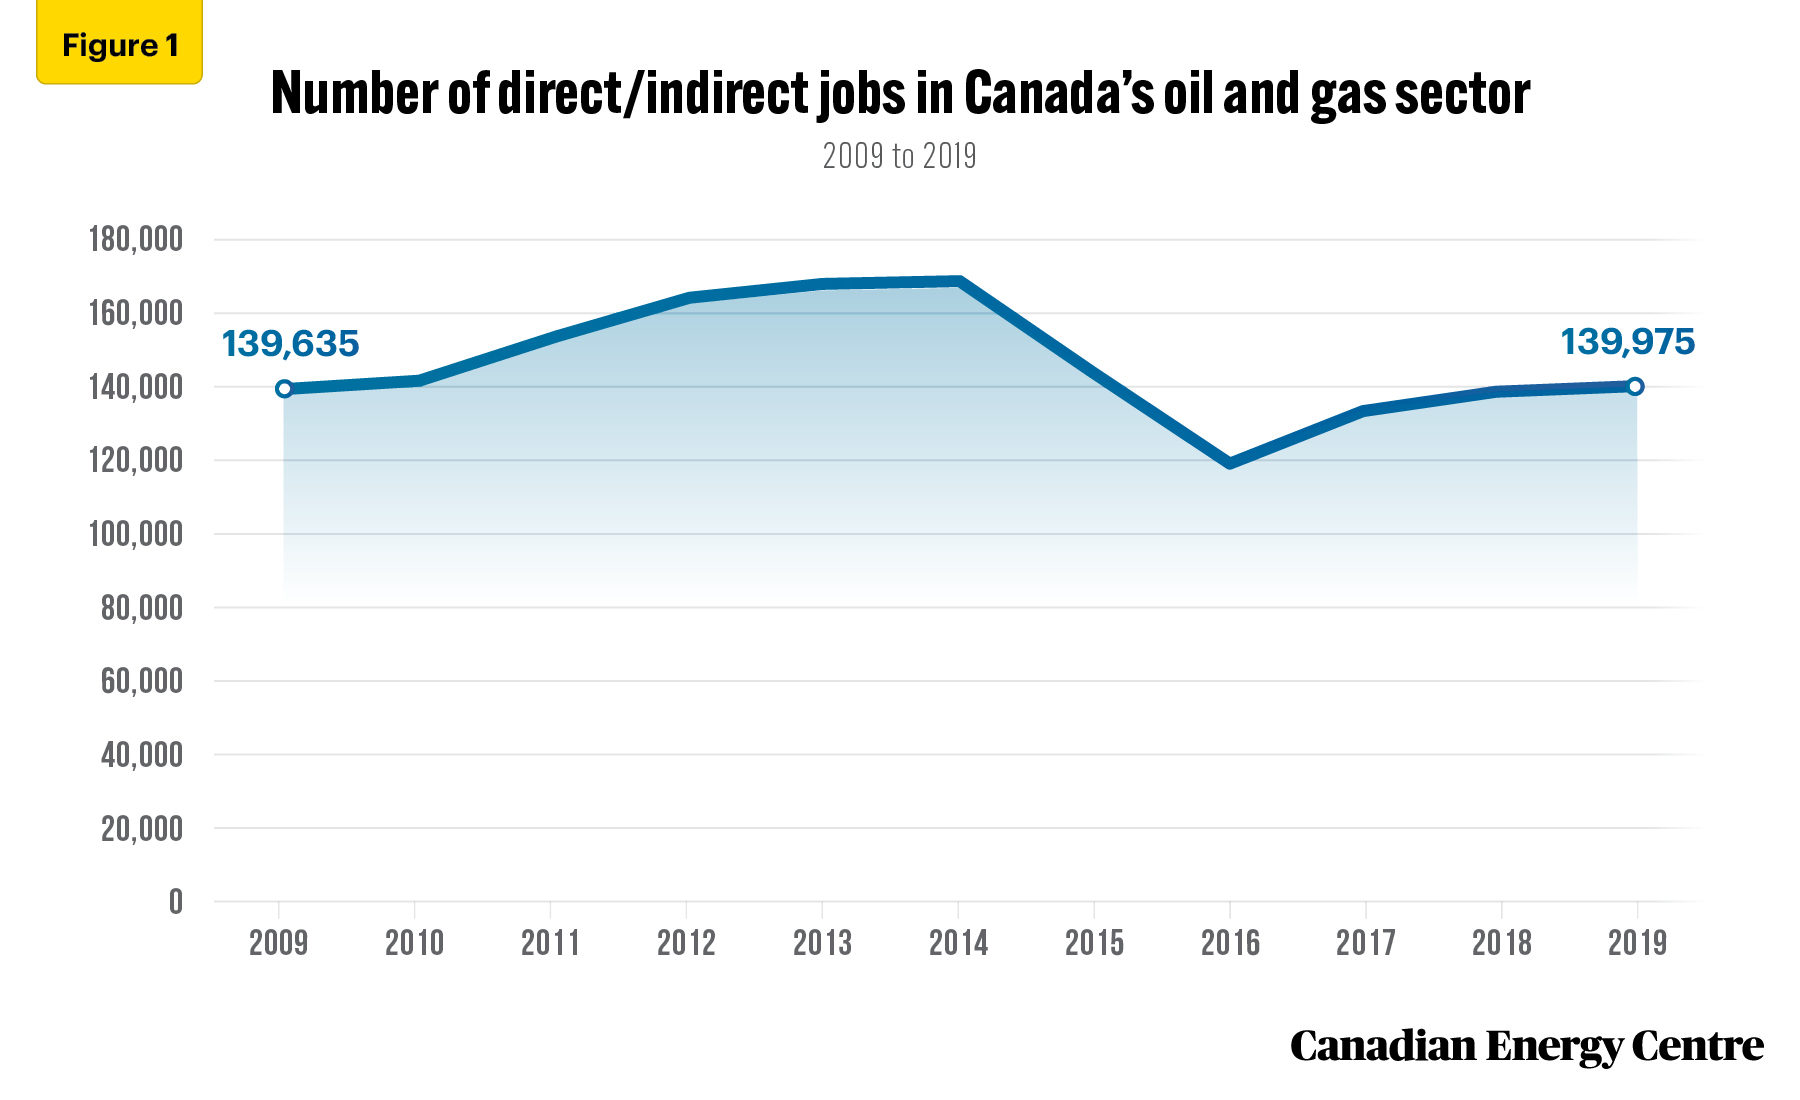
Source: Statistics Canada (2021d)
Canadian oil and gas sector jobs continue to pay very well
The average wage and salary of a worker in the Canadian oil and gas sector in 2019 was $124,679, while the average Canadian job paid $56,783. The average wage and salary for an oil and gas worker rose from $106,390 in 2009 to $146,610 in 2015, before leveling off to $124,679 as of 2019, due to the energy price slump. Between 2009 and 2019, the average annual wage and salary of a worker in the Canadian oil and gas sector increased by over 17 per cent (see Figure 2).
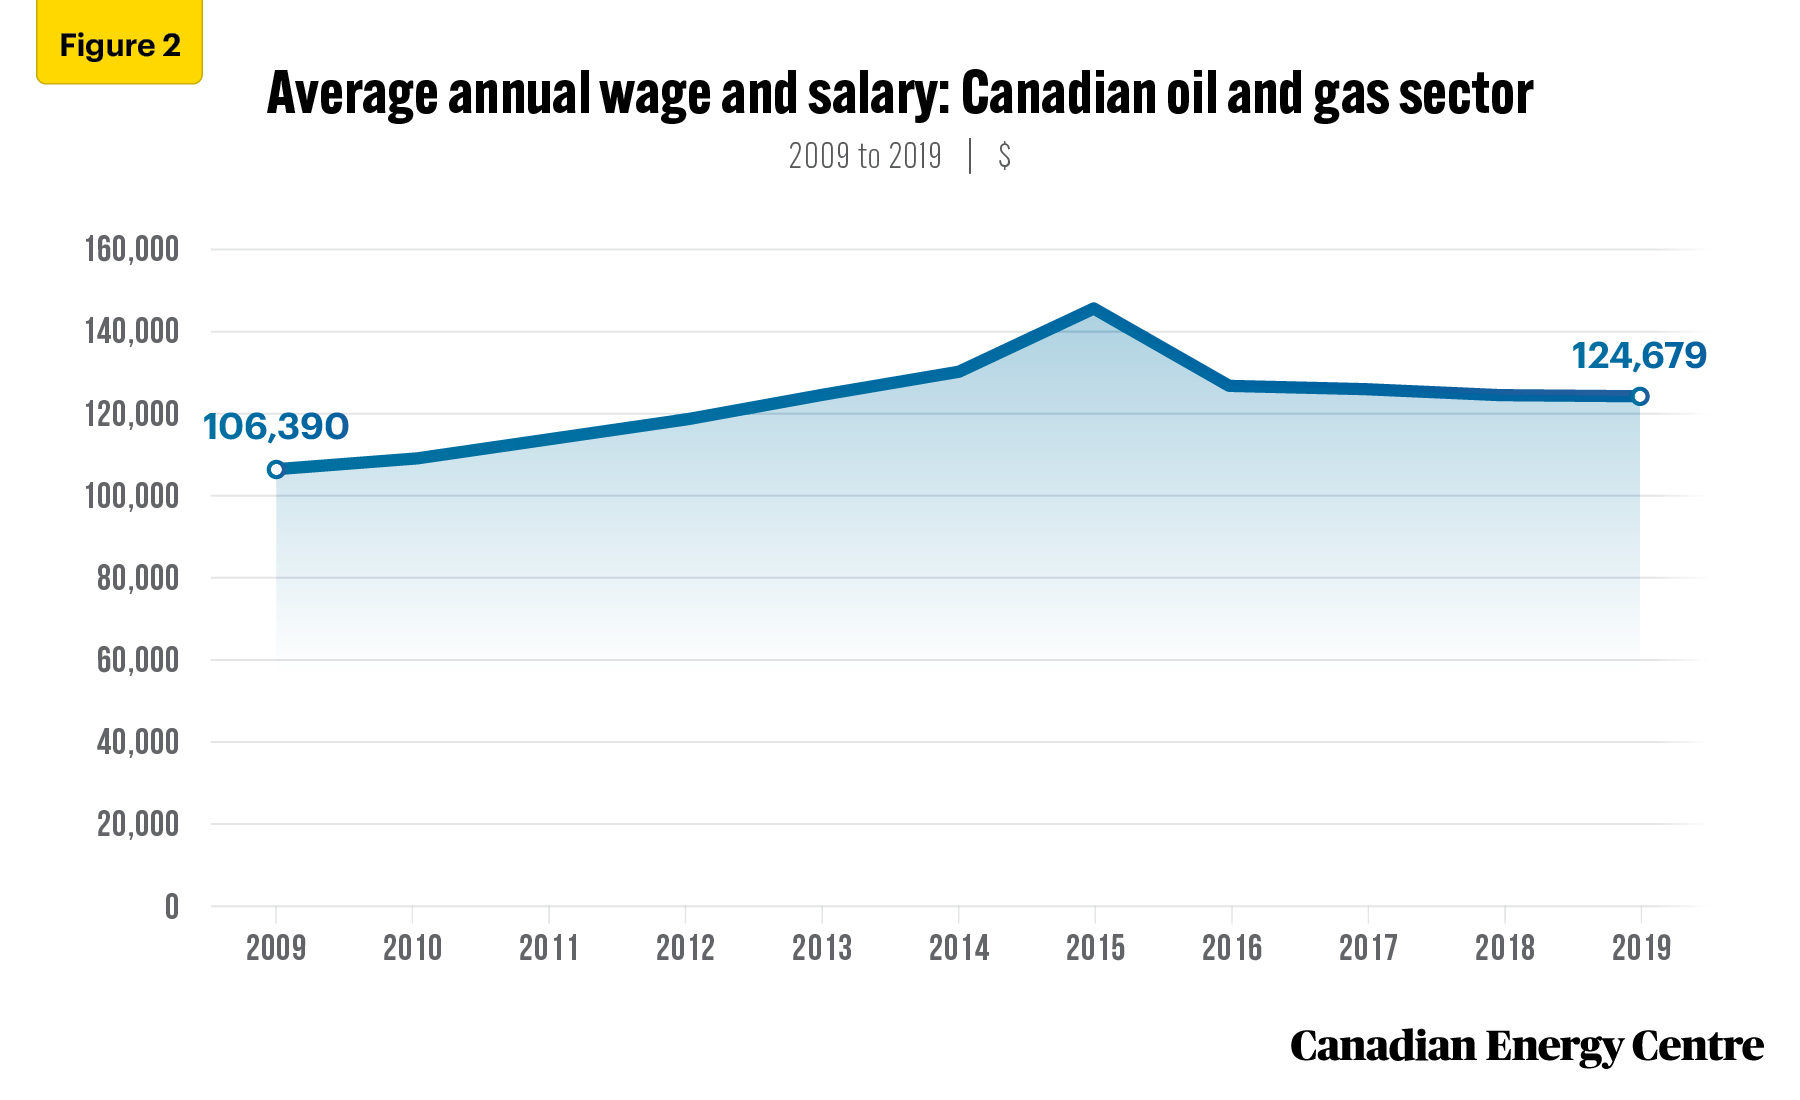
Source: Statistics Canada (2021d)
Nearly 31% of the jobs in the Canadian oil and gas sector are held by women. The average annual wage and salary has increased by over 30% since 2009.
Among the 139,975 workers employed in the Canadian oil and gas industry in 2019, 42,846 or nearly 31 per cent were held by females. The number of females employed in the oil and gas sector reached a high of 55,666 in 2013, before declining to 36,807 by 2016, the result of the decline in energy prices, recovering to 42,846 by 2019 (see Figure 3).
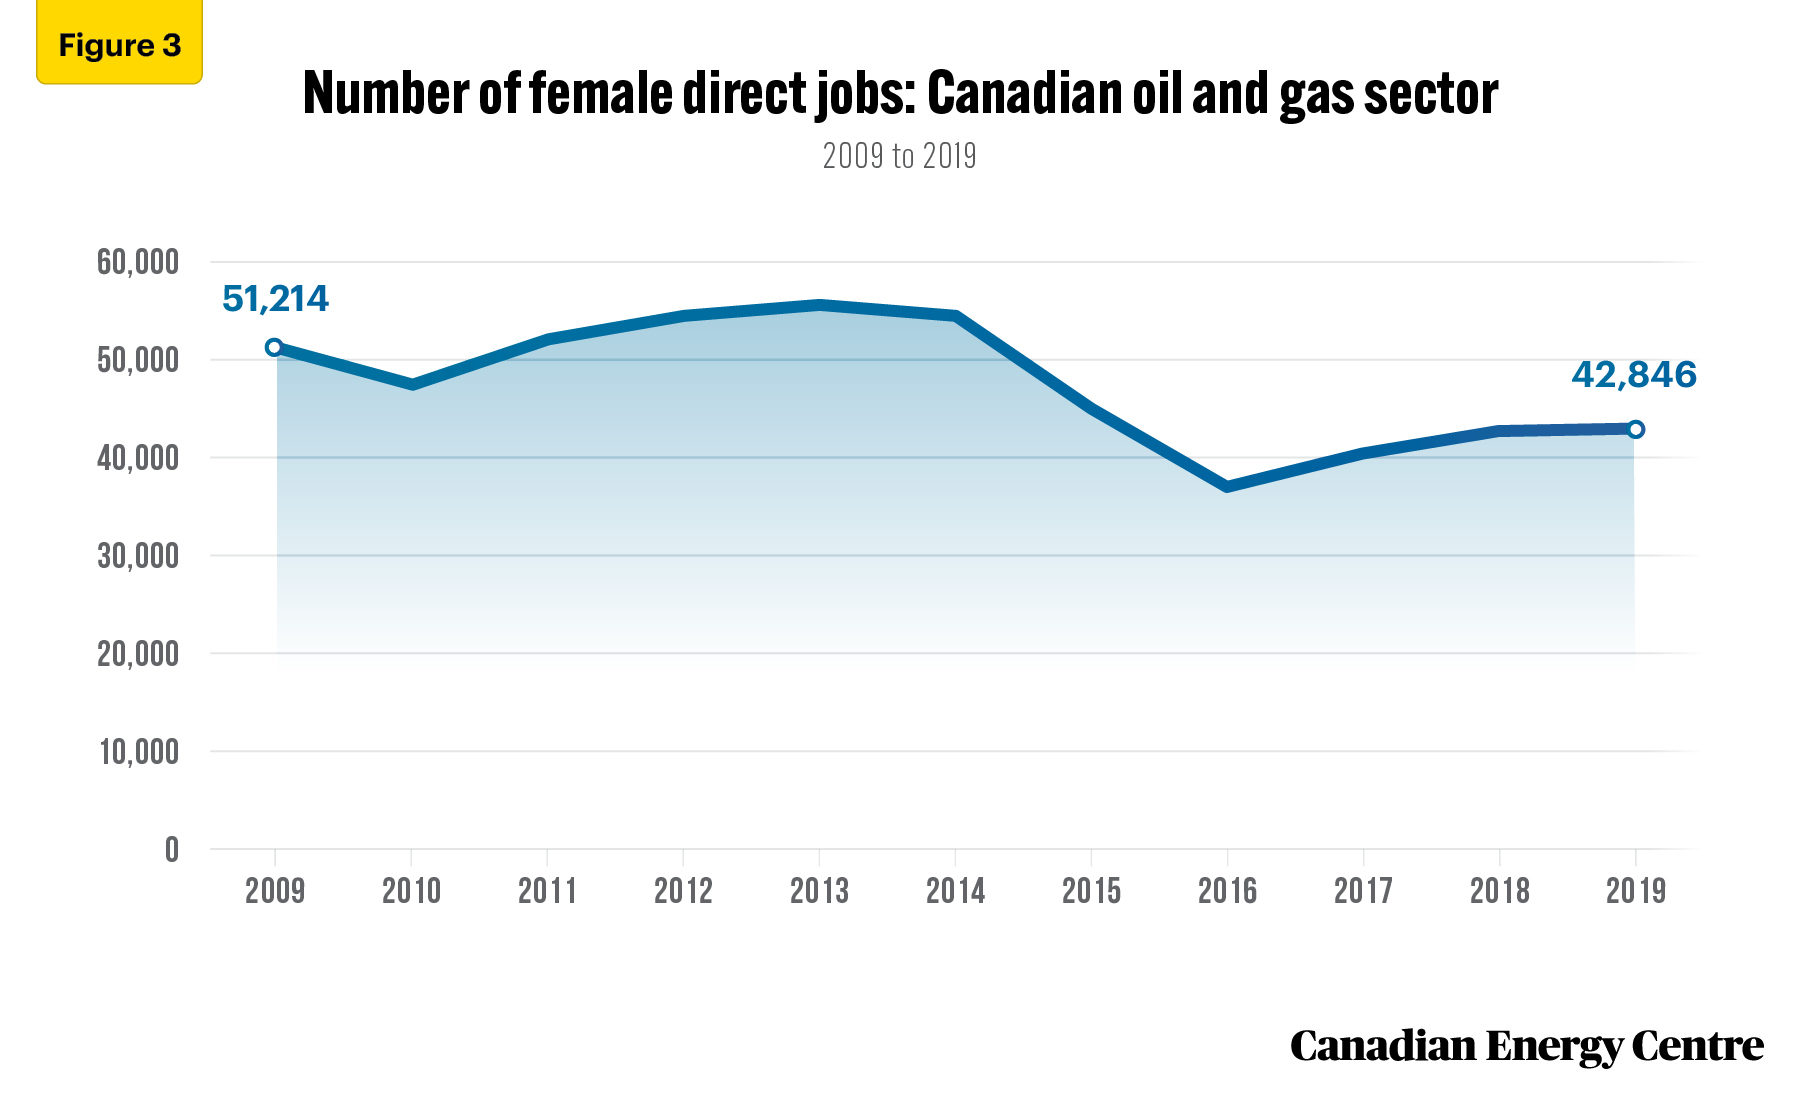
Source: Statistics Canada (2021d)
In 2019, the average wage and salary for a female working in the Canadian oil and gas sector was $110,975. The average wage and salary for a female working in the oil and gas sector reached a high of $112,313 in 2014, before declining slightly to $110,975 in 2019. Between 2009 and 2019, the average wage and salary for a female worker in the Canadian oil and gas industry still increased by over 30 per cent (see Figure 4).
Source: Statistics Canada (2021d)
Over 35% of jobs in the Canadian oil and gas sector are held by immigrants, and wages and salaries are on the rise
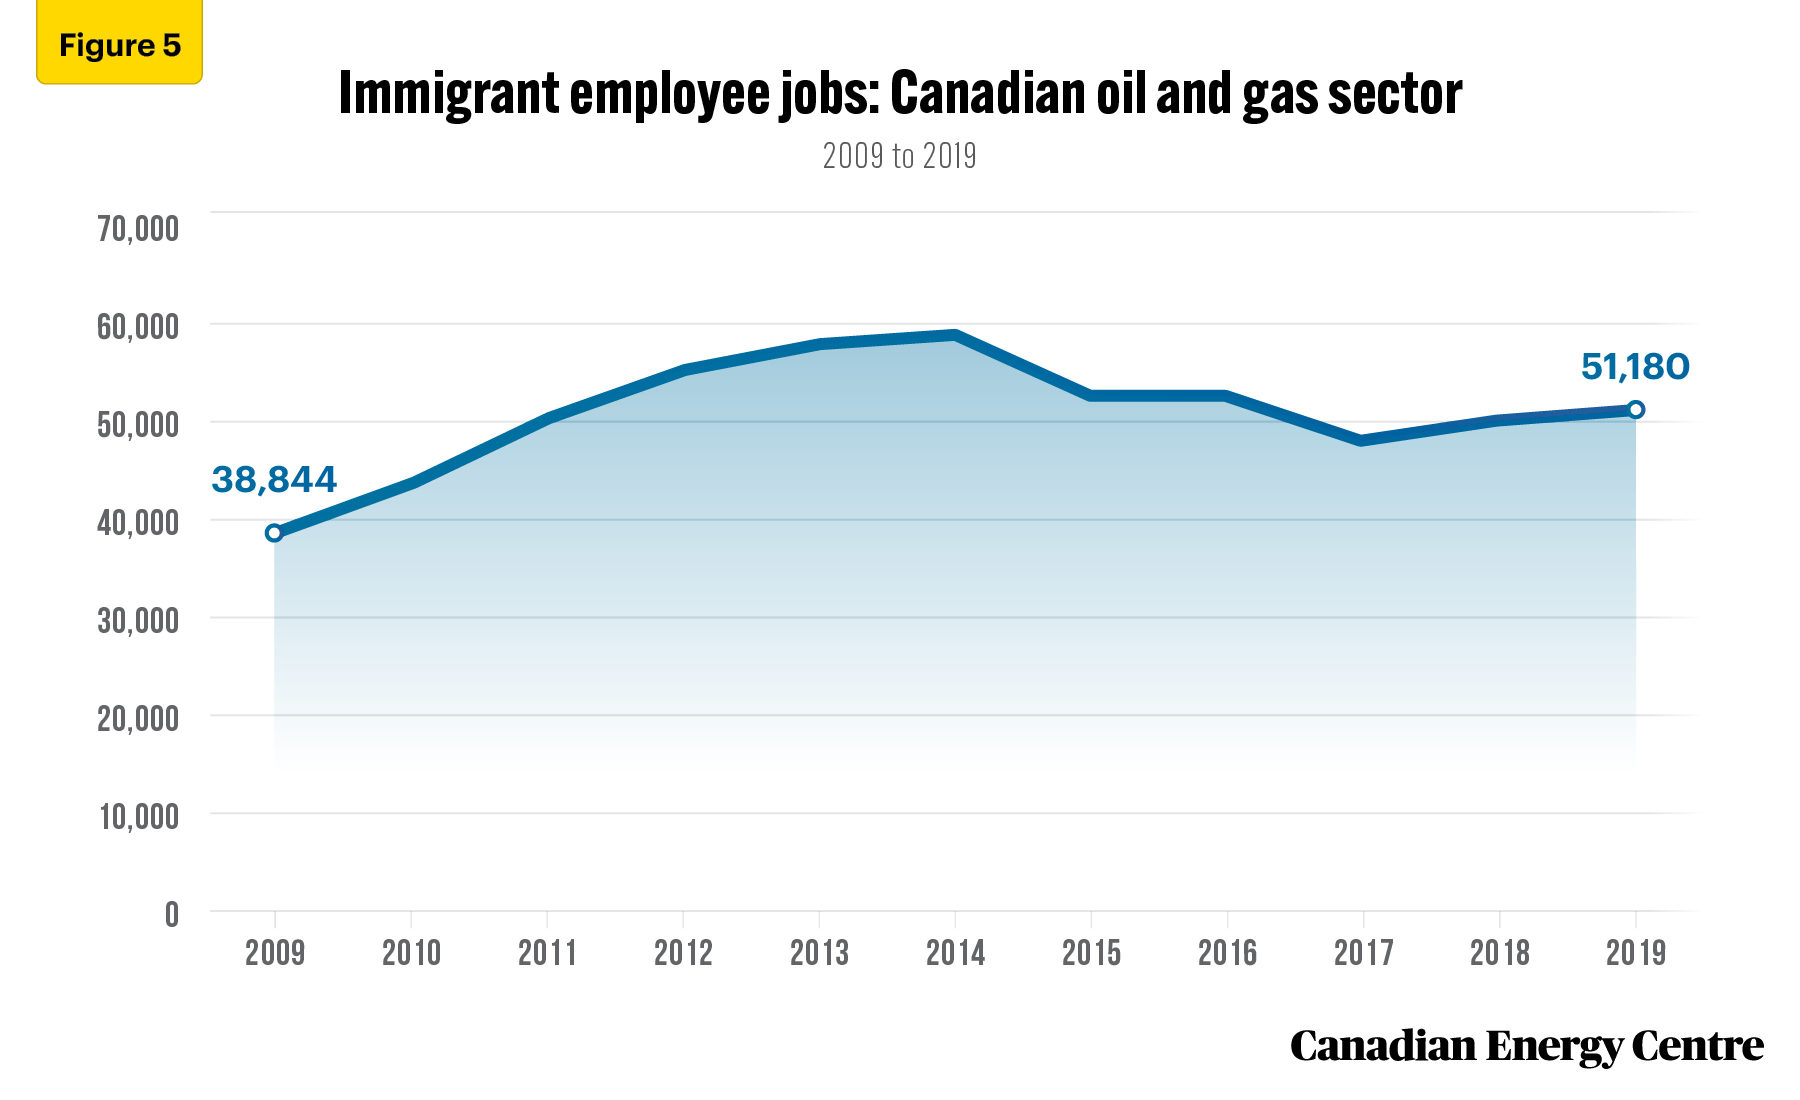
In 2019, 51,180 immigrants were employed in the Canadian oil and gas sector. The number of immigrants employed in the oil and gas industry reached 58,896 by 2014, declining to 48,099 in 2017, before recovering to 51,180 in 2019. Between 2009 and 2019, immigrant employment in the Canadian oil and gas sector increased by nearly 32 per cent (see Figure 5).
As of 2019, immigrant employment represented over 35 per cent of all employment in the Canadian oil and gas sector. In comparison, in 2009, immigrant employment represented nearly 28 per cent of all employment in the Canadian oil and gas sector.
Source: Statistics Canada (2021d)
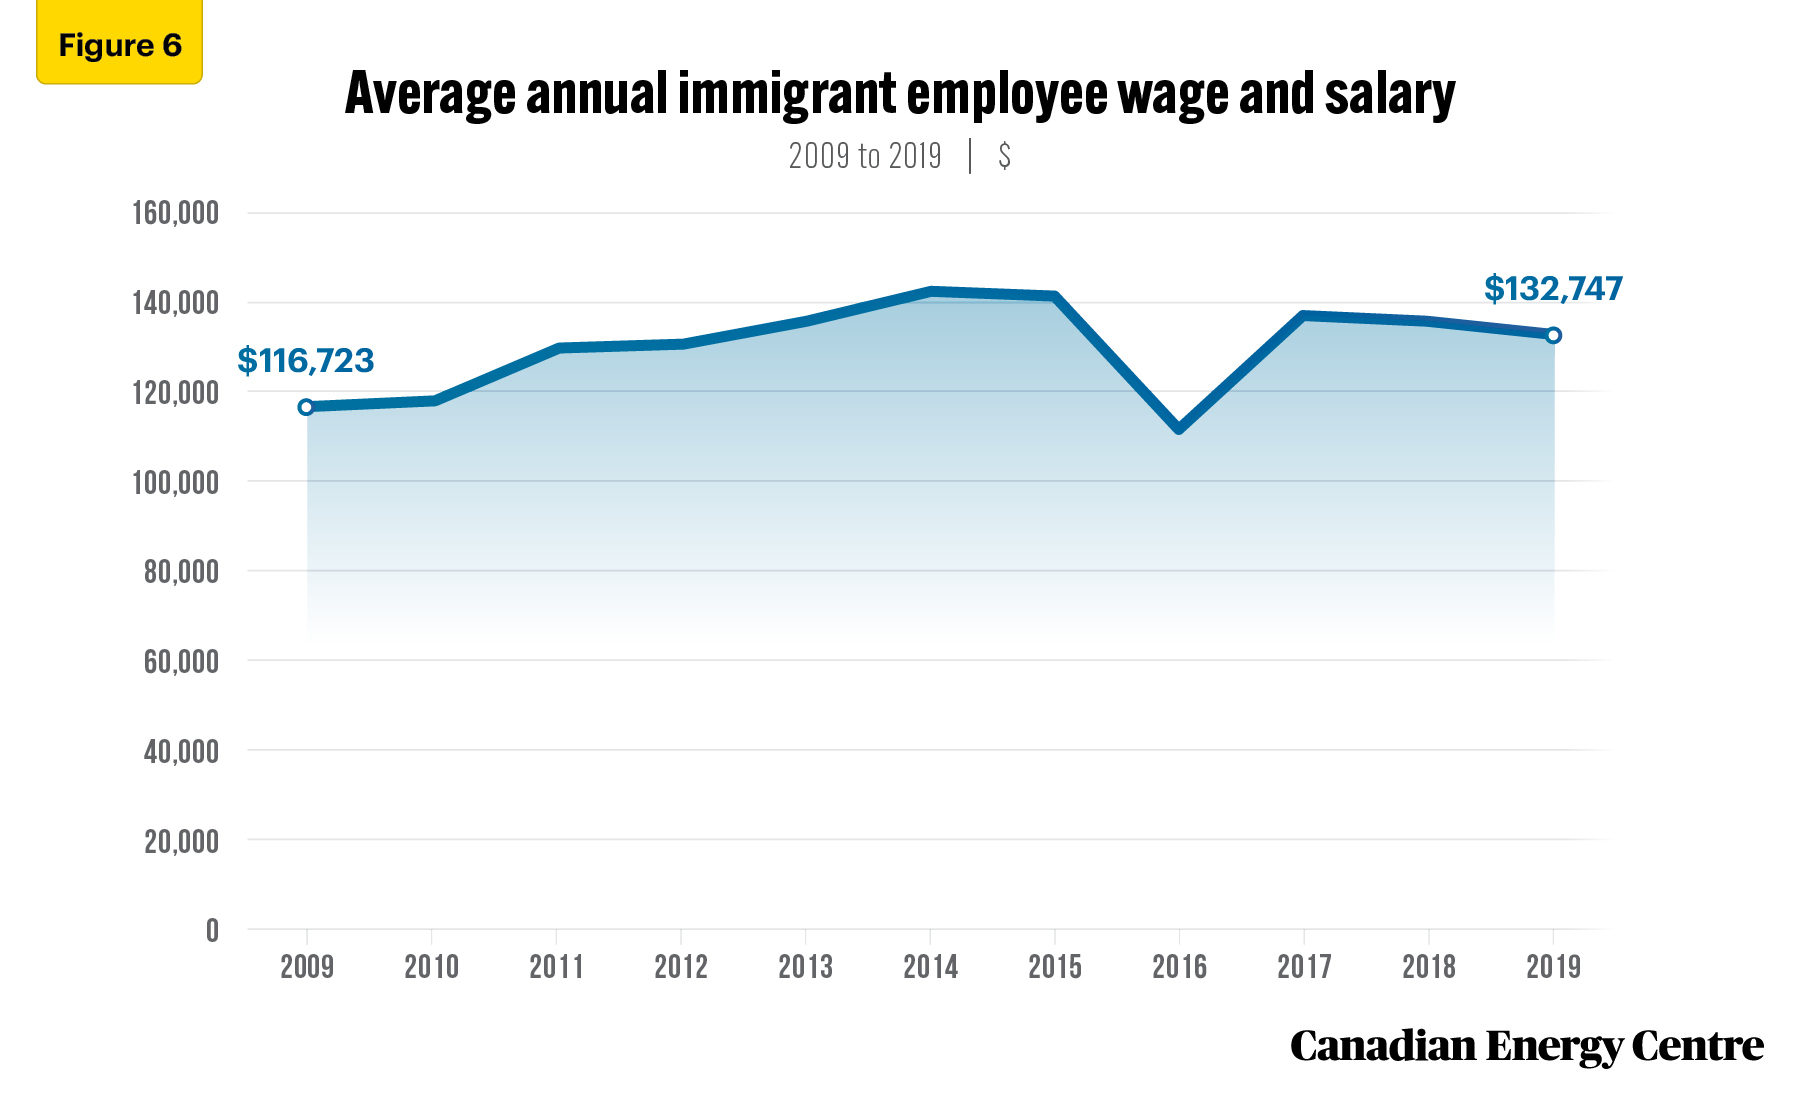
The average wage and salary of an immigrant employed in the Canadian oil and gas sector was $132,747 in 2019. The average wage and salary of an immigrant employed in the oil and gas sector increased to $142,268 by 2014, declining to $111,588 in 2016, before recovering to $132,747 in 2019. Between 2009 and 2019, the average wage and salary of an immigrant employed in the Canadian oil and gas sector increased by nearly 14 per cent (see Figure 6).
Source: Statistics Canada (2021d)
Indigenous employment, average annual wage and salary in the Canadian oil and gas industry are increasing
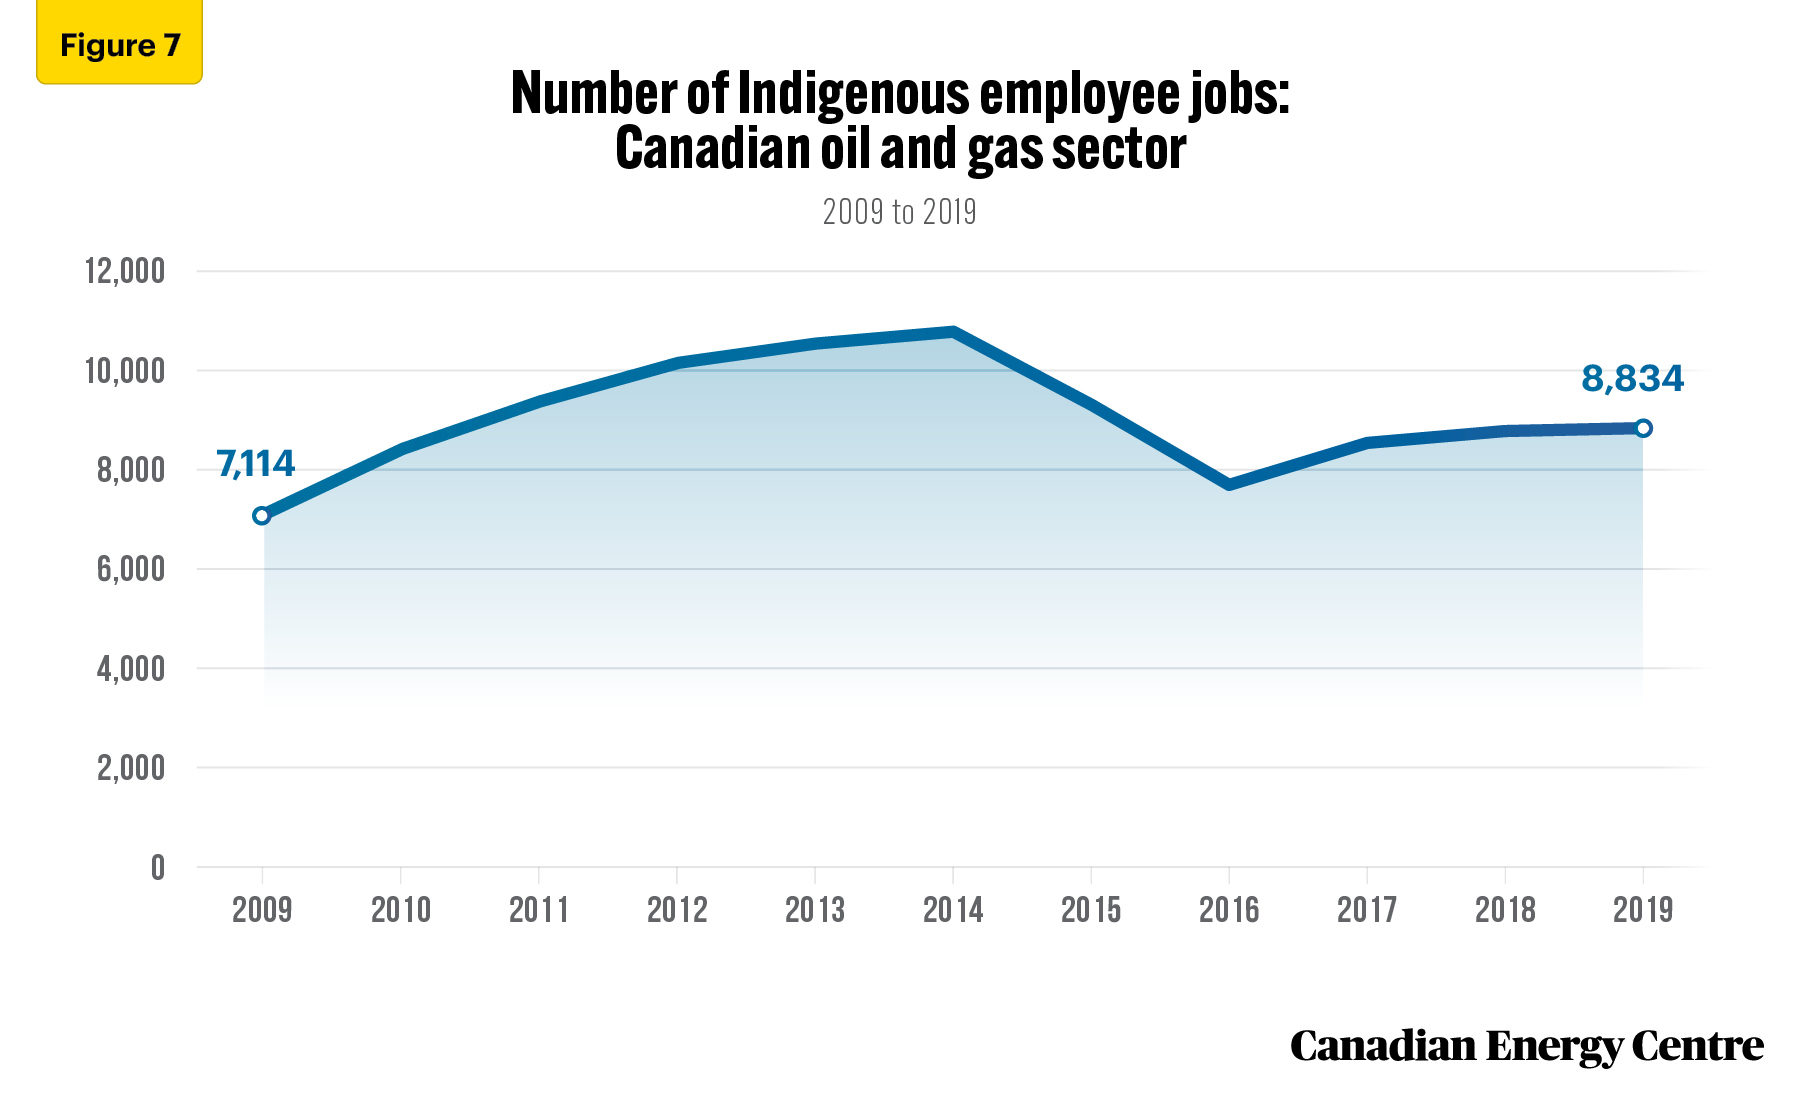
Indigenous employment in the oil and gas sector reached 10,766 in 2014, declining to 7,699 in 2014, before recovering to 8,834 in 2019. Between 2009 and 2019 workers in the Canadian oil and gas sector identified as Indigenous increased by over 24 per cent (see Figure 7).
Source: Statistics Canada (2021d)
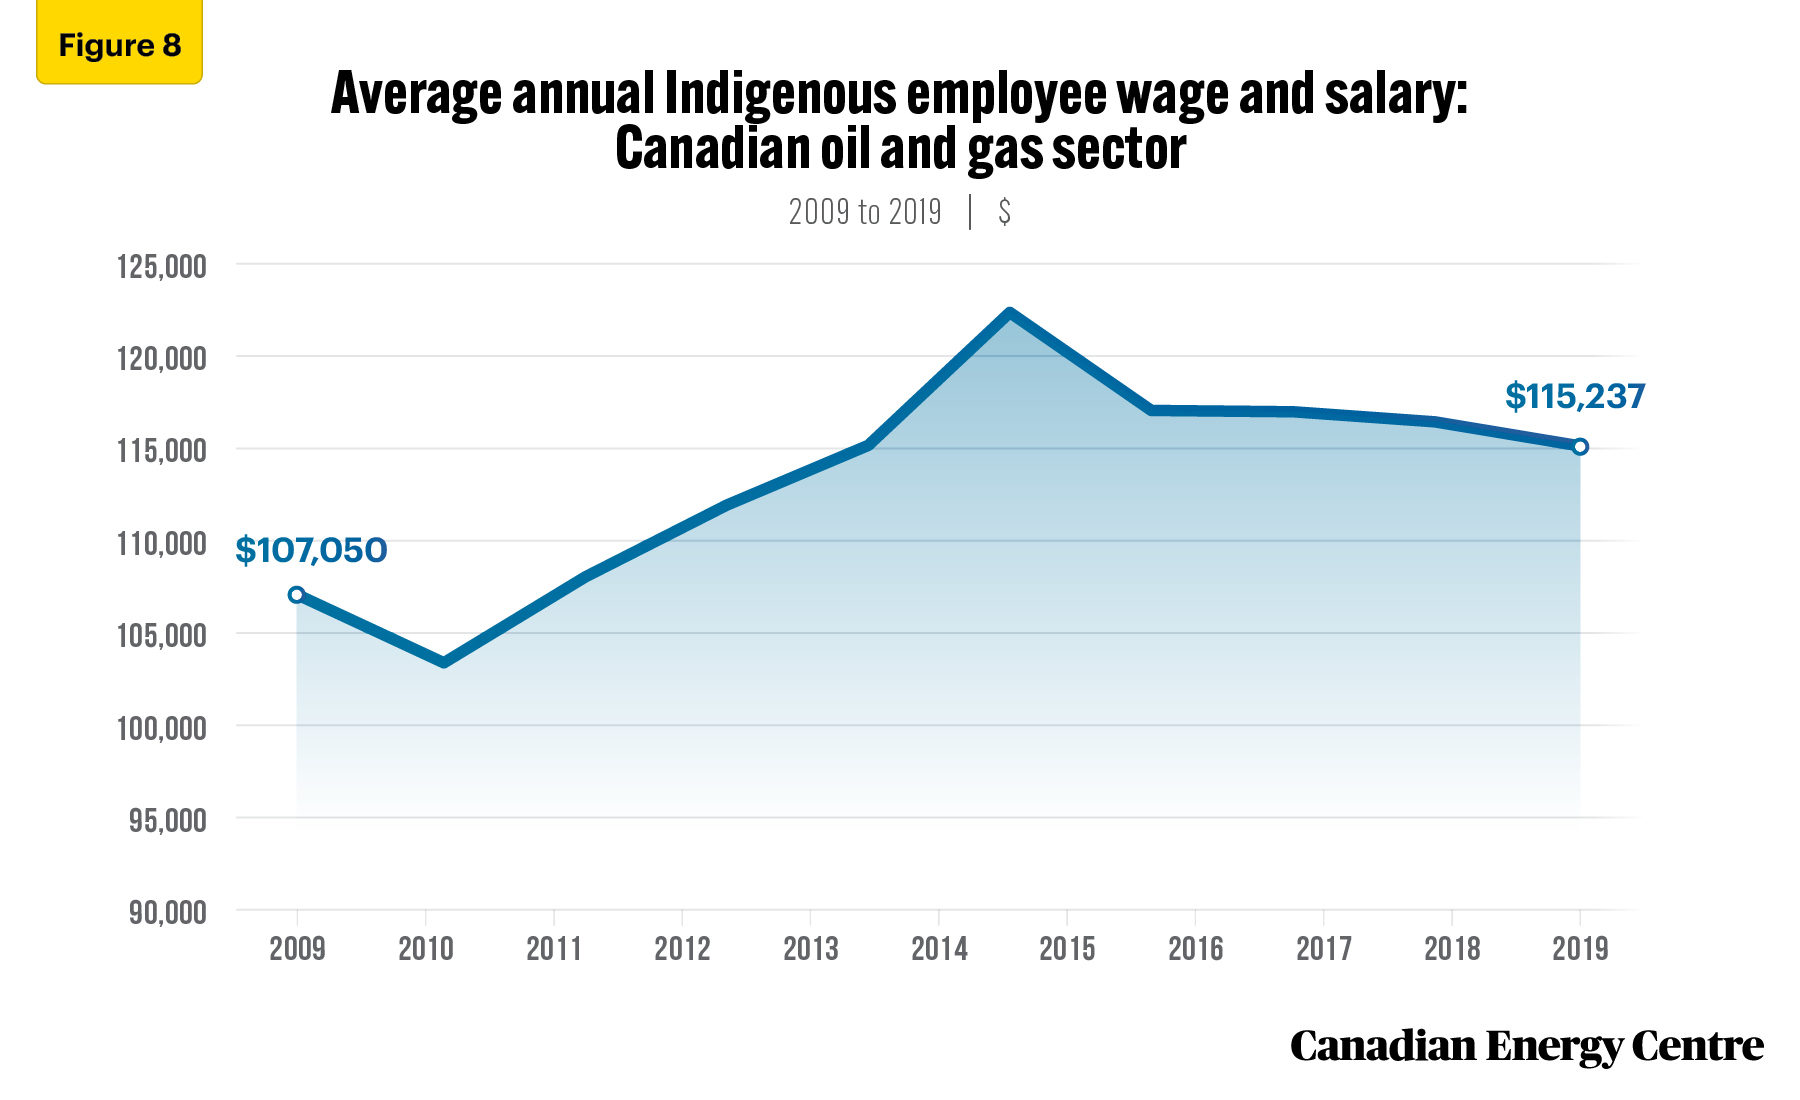
In 2019, workers identified as Indigenous comprised 6.3 per cent of total employment in the oil and gas sector, as compared to 5.1 per cent in 2009. The average wage and salary of an Indigenous person employed in the Canadian oil and gas sector reached $122,447 by 2015, before declining to $115,237 in 2019. However, between 2009 and 2019, the average wage and salary of an Indigenous person employed in the Canadian oil and gas sector increased by over 7 pe rcent (see Figure 8).
Source: Statistics Canada (2021d)
Over 26% of workers in the Canadian oil and gas sector have a university degree or higher
The number of workers in the Canadian oil and gas sector with a university degree or higher rose to 41,252 by 2014, declining to 31,616 in 2016, the result of the energy price slump, before recovering to 37,078 by 2019. Between 2009 and 2019, the number of workers in the Canadian oil and gas sector with a university degree or higher increased by nearly 12 per cent (see Figure 9).
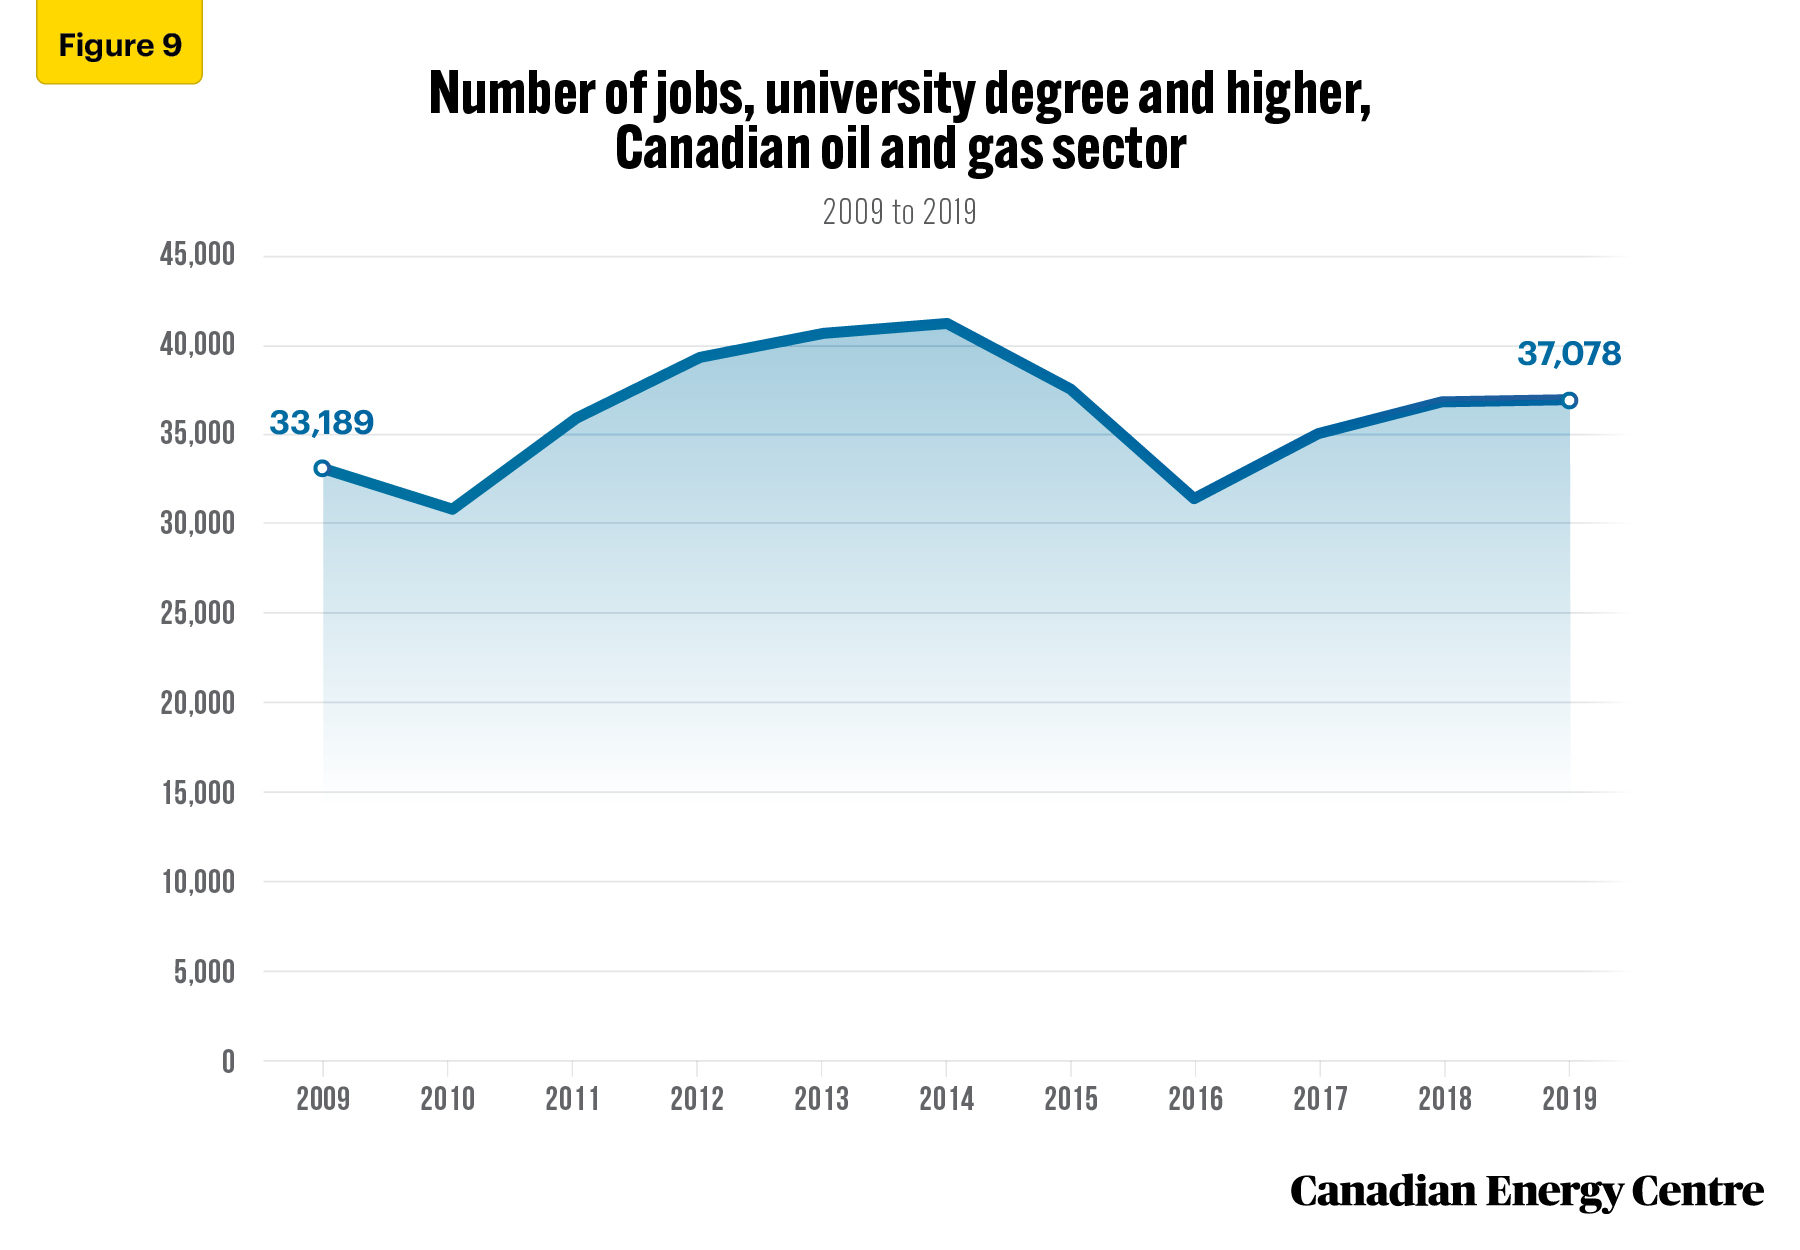
Source: Statistics Canada (2021d)
In 2019, workers with a university degree or higher comprised 26.5% of total employment in the Canadian oil and gas sector, as compared to 23.8% in 2009.
The average wage and salary of a worker with a university degree or higher employed in the Canadian oil and gas sector reached $176,588 in 2016, before declining to $158,666 in 2019. Between 2009 and 2019, the average wage and salary of a worker with a university degree or higher employed in the Canadian oil and gas sector increased by over 8 per cent (see Figure 10).
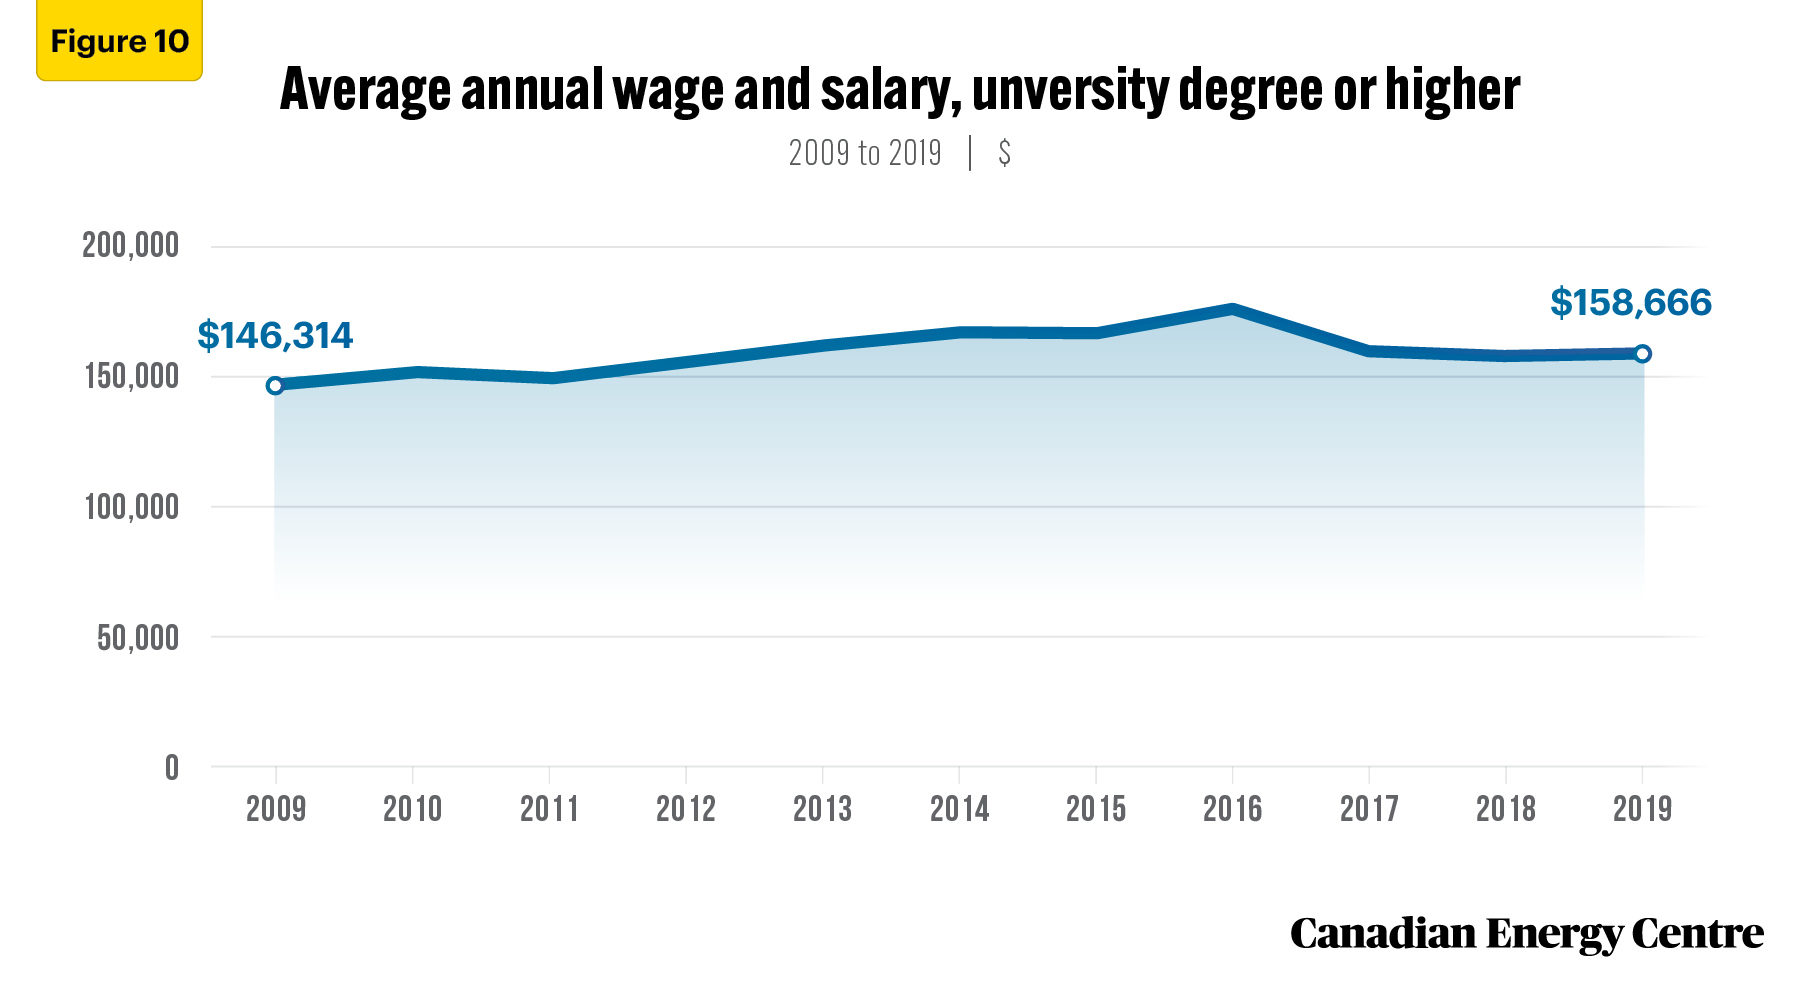
Source: Statistics Canada (2021d)
Nearly 24% of workers in the Canadian oil and gas industry identify as visible minorities
The number of workers in the Canadian oil and gas sector identified as members of a visible minority reached 38,782 in 2014, declining to 28,548 in 2016, before recovering to 33,586 in 2019. Between 2009 and 2019, 2009, the number of workers in the Canadian oil and gas sector identified as members of a visible minority increased by nearly 36 per cent (see Figure 11).
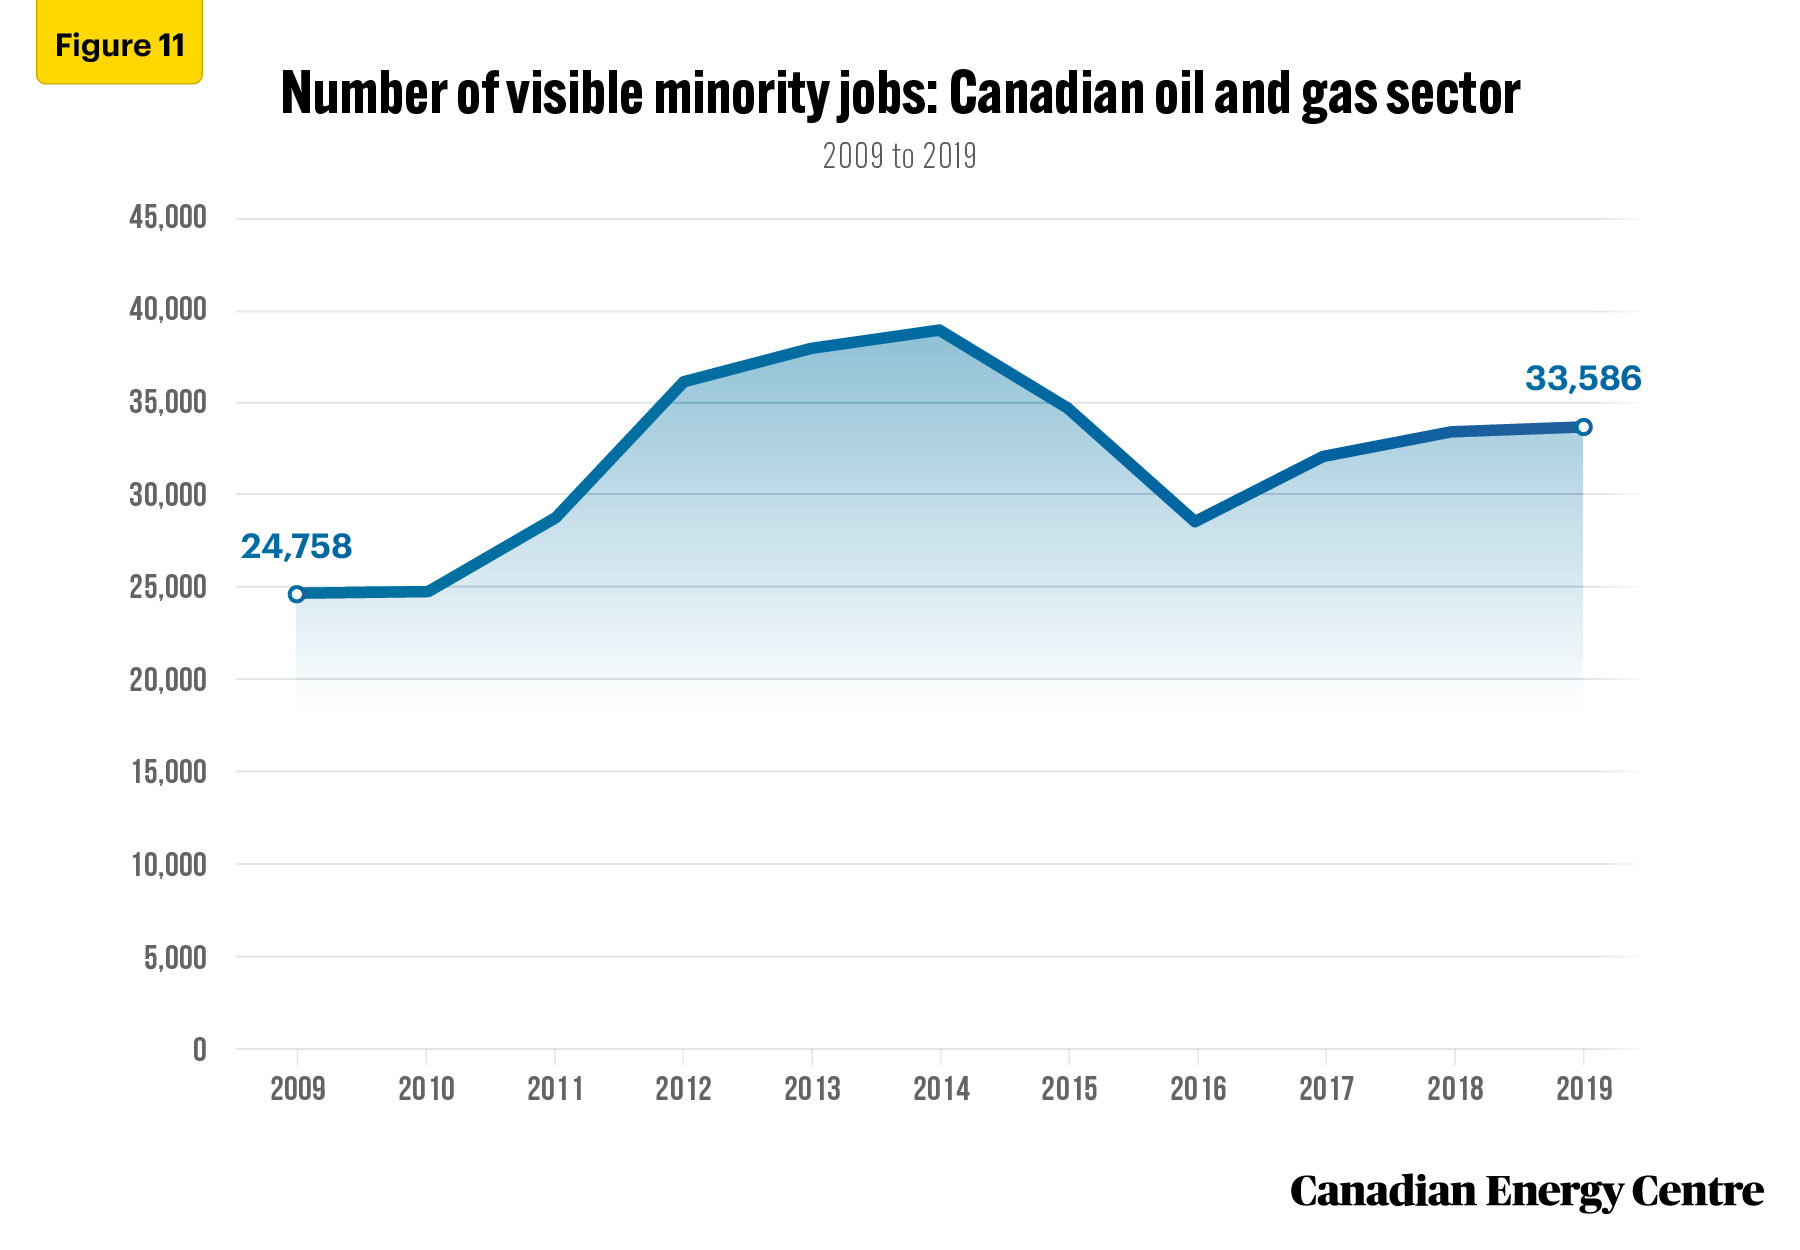
Source: Statistics Canada (2021d)
The average wage and salary of a worker identified as members of a visible minority in the Canadian oil and gas sector was $114,988 in 2019. This represents an increase of over 12 per cent since 2009 (see Figure 12).
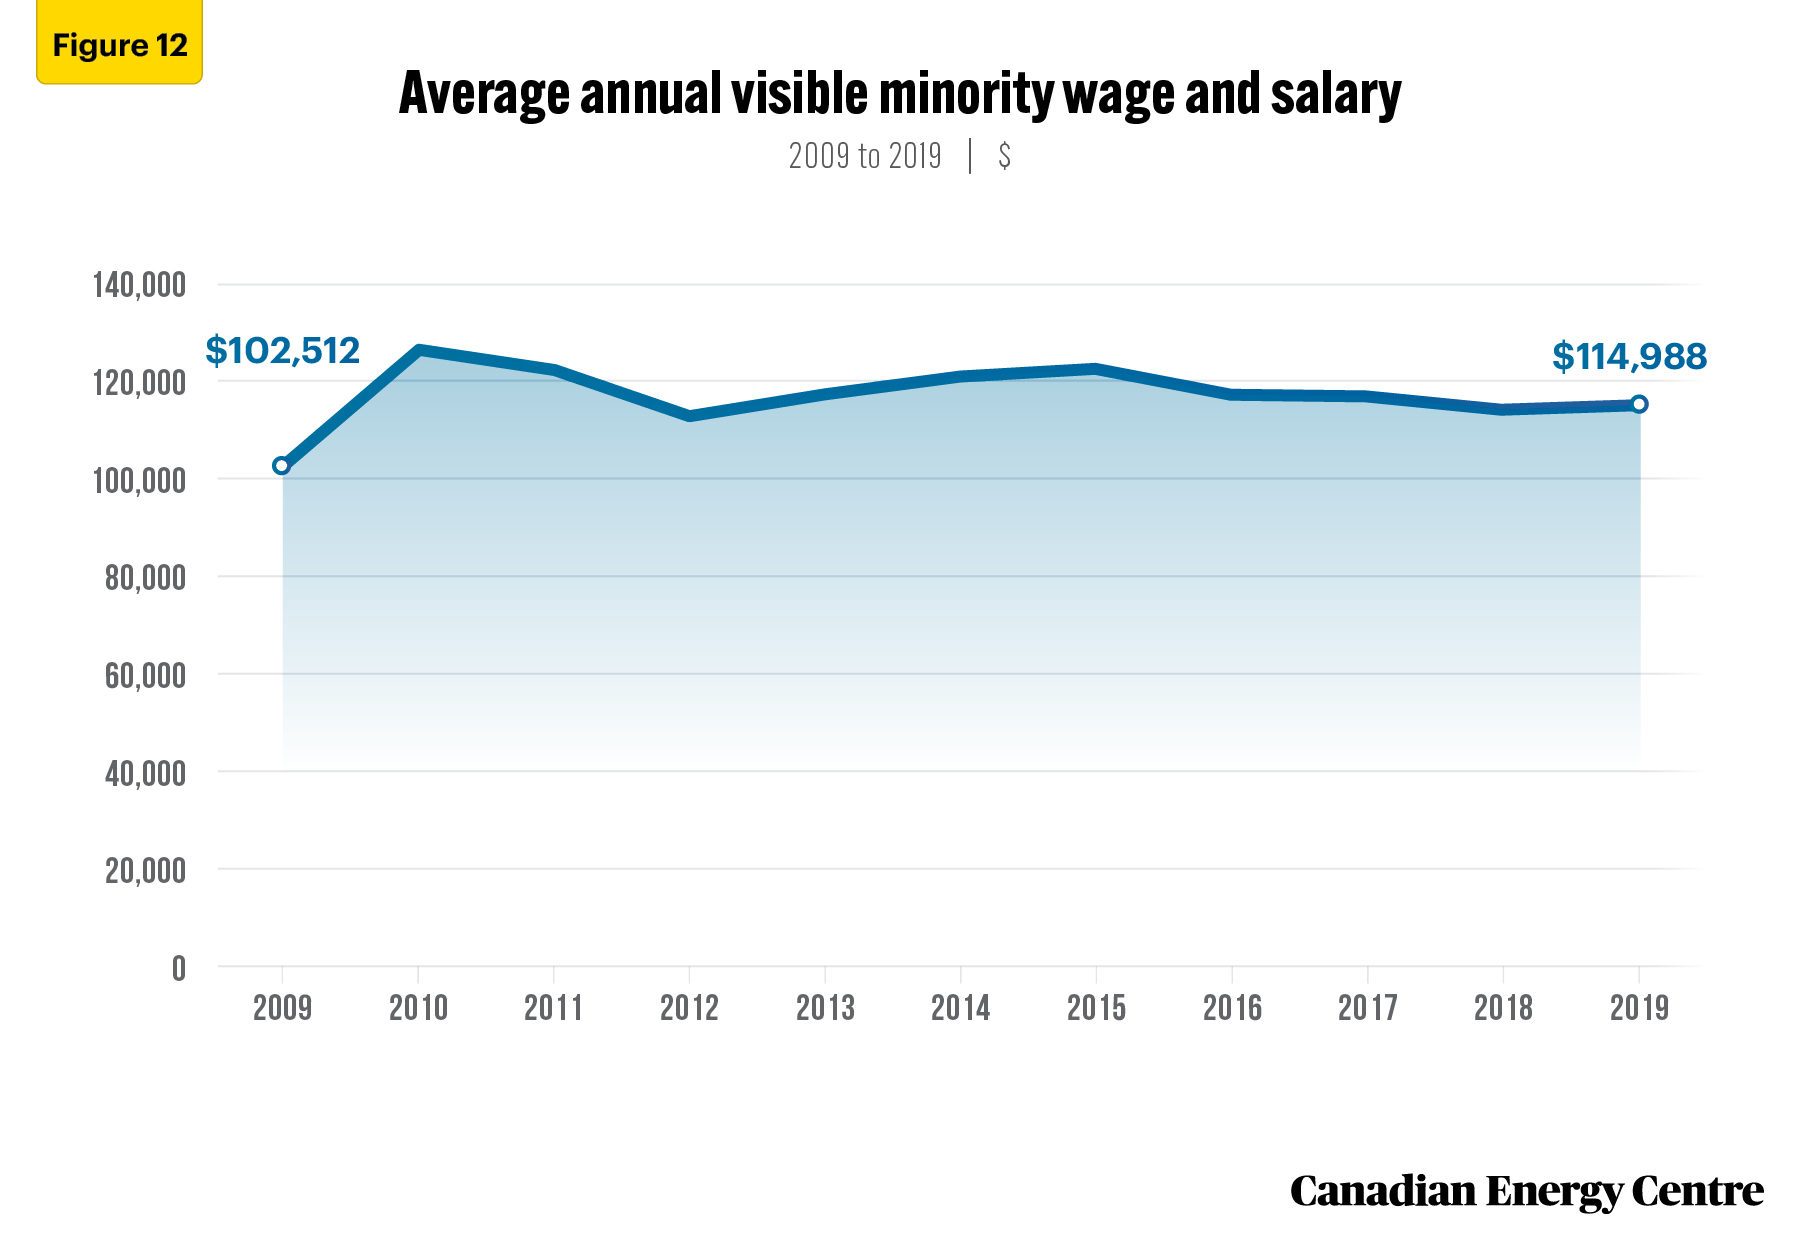
Source: Statistics Canada (2021d)
Conclusion
Despite the continuation of the energy price slump and unfavourable regulatory, environmental and fiscal policies from the federal government, the oil and gas sector in Canada continued to be a strong performer in 2019.
In 2019, the Canadian oil and gas sector still directly employed nearly 140,000 Canadians. Oil and gas jobs continued to pay very well. In 2019, the average wage and salary of a worker in the Canadian oil and gas sector was $124,679, an increase of over 17 per cent since 2009.
Examining the key demographic characteristics of those employed in the Canadian oil and gas sector shows a workforce that is becoming increasingly diverse.
- Nearly 31 per cent of jobs in the Canadian oil and gas sector are held by women, and the average pay has increased by over 30 per cent since 2009.
- Over 35 per cent of jobs in the Canadian oil and gas sector are held by immigrants, and average pay has increased by nearly 14 per cent since 2009.
- In 2019, 6.3 per cent of workers in the Canadian oil and gas sector identified as Indigenous, with average pay increasing by nearly 7 per cent since 2009.
- Nearly 24 per cent of workers in Canadian oil and gas sector identify as visible minorities, with average pay increasing by over 12 per cent since 2009.
Notes
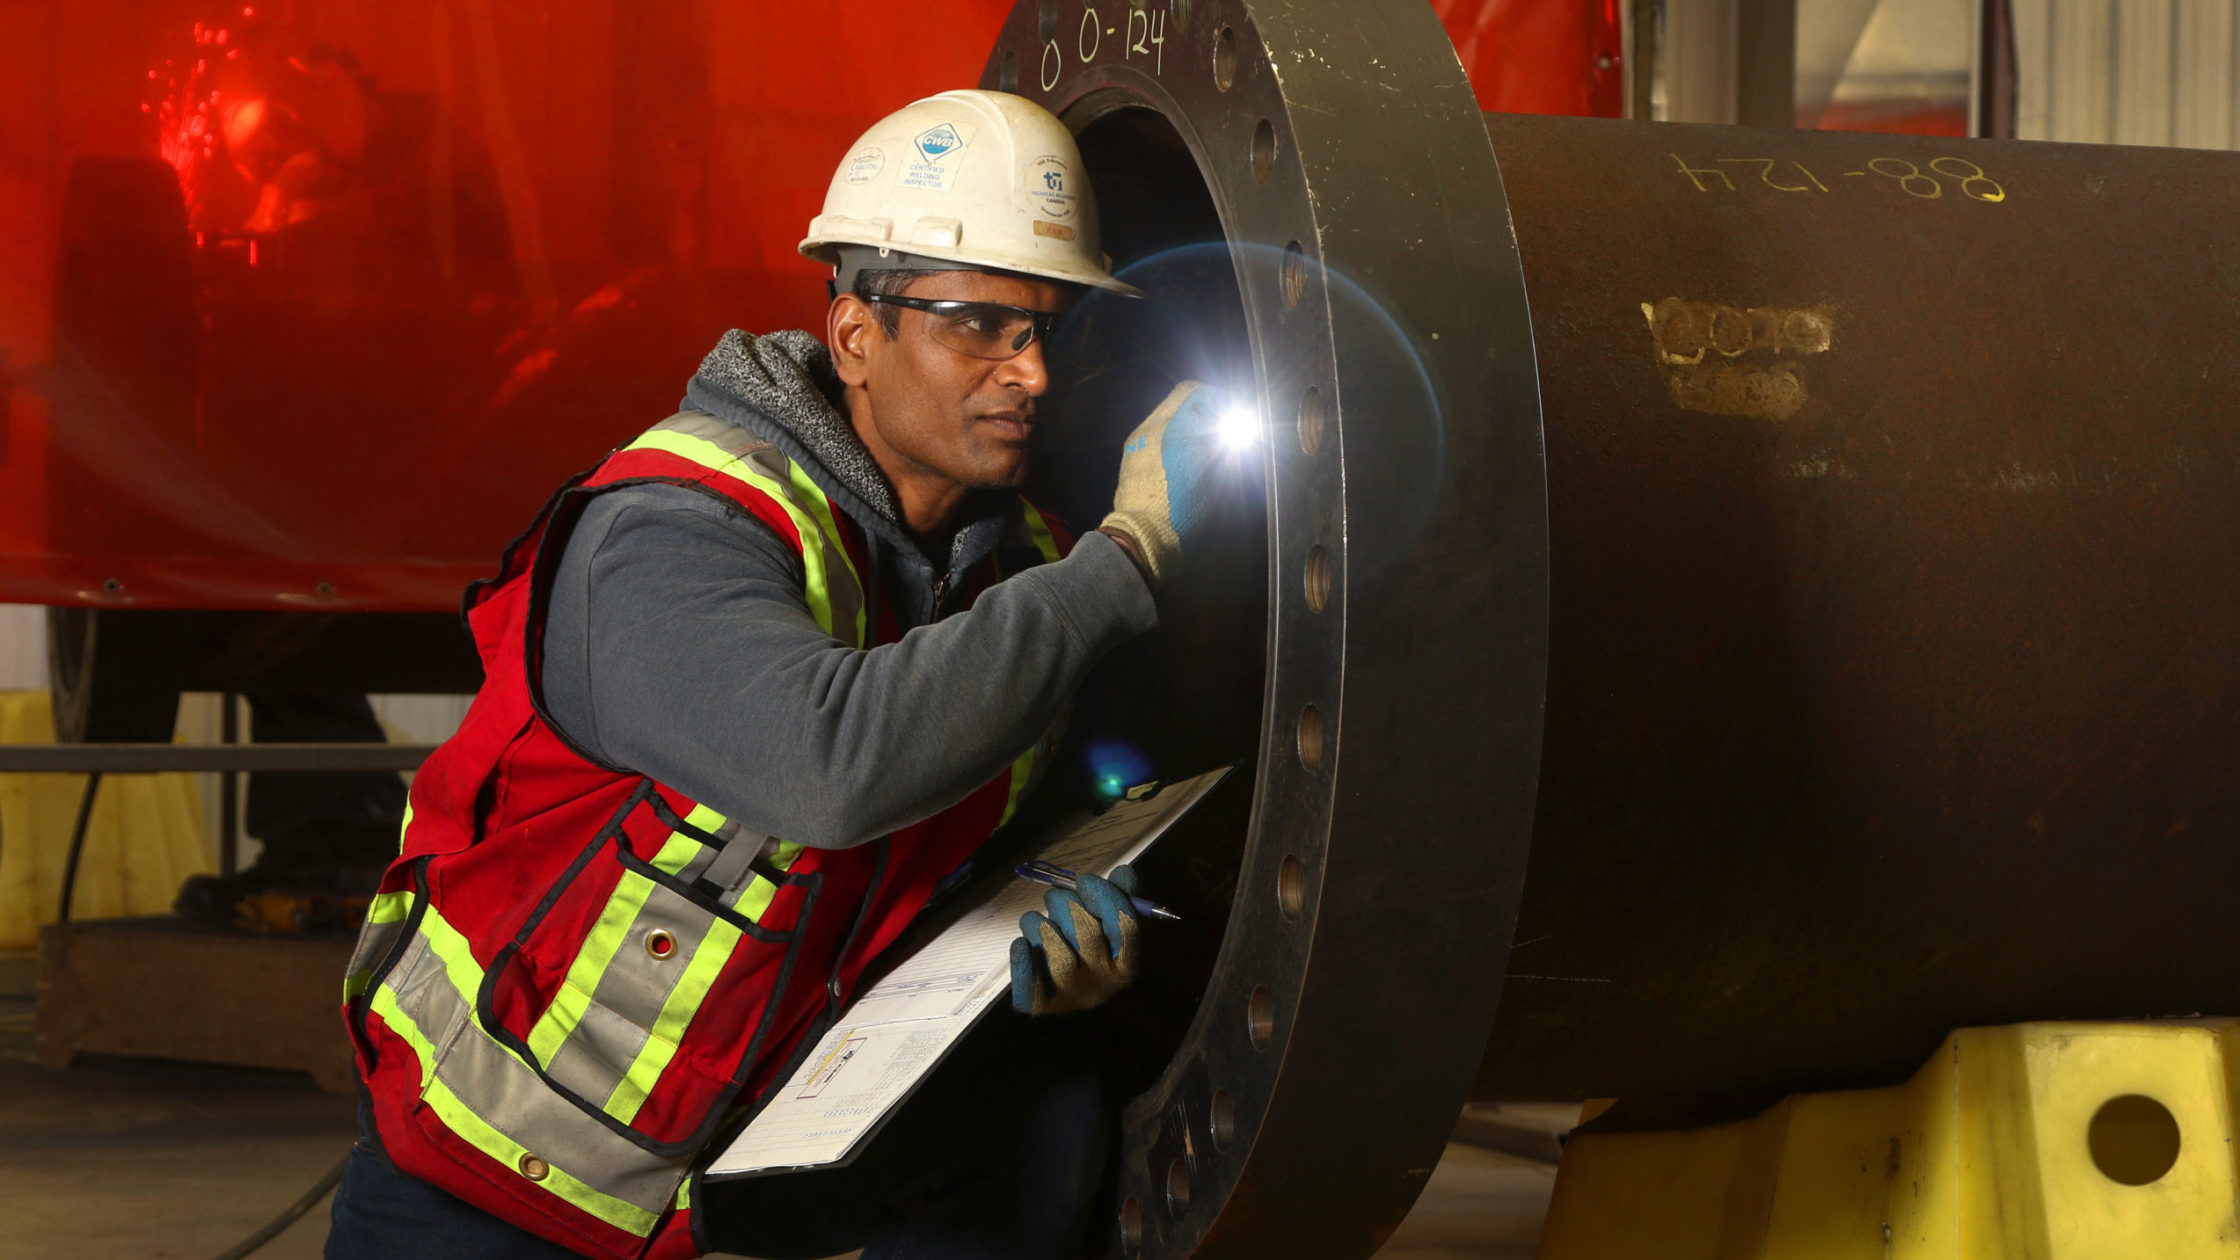
This CEC Fact Sheet was compiled by Lennie Kaplan at the Canadian Energy Centre (www.canadianenergycentre.ca). The author and the Canadian Energy Centre would like to thank and acknowledge the assistance of Dennis Sundgaard and an anonymous reviewer in reviewing the original data and research for this Fact Sheet. Image credits: Qiujusong
References (all links live as of January 11, 2022)
Statistics Canada, 2017. The Natural Resources Satellite Account: Sources and Methods, <https://bit.ly/2VZ1th4>; Statistics Canada, 2021a. Employment Characteristics for the Oil and Gas Sector. <https://bit.ly/3lP4o4G>; Statistics Canada, 2021b. Natural Resources Satellite Account, Employment (x 1,000). <https://bit.ly/3tXR6qi>; Statistics Canada, 2021c. Natural Resources Satellite Account: Human Resource Module, 2009 to 2019. <https://bit.ly/3zAwcPu>; Statistics Canada, 2021d. Natural Resources Satellite Account: Human Resource Module, 2009 to 2019. Special Tabulation.
Creative Commons Copyright
Research and data from the Canadian Energy Centre (CEC) is available for public usage under creative commons copyright terms with attribution to the CEC. Attribution and specific restrictions on usage including non-commercial use only and no changes to material should follow guidelines enunciated by Creative Commons here: Attribution-NonCommercial-NoDerivs CC BY-NC-ND.