Social
To sign up to receive the latest Canadian Energy Centre research to your inbox email: research@canadianenergycentre.ca
Download the PDF here
Download the charts here
Introduction
Many people are interested in whether a barrel of oil produced by the Canadian upstream oil sector is becoming cleaner on an emissions per barrel basis.
To answer this important question, this CEC Fact Sheet examines Environment and Climate Change Canada (ECCC) historical greenhouse gas (GHG) emissions intensity numbers, expressed as kilograms of CO2e (CO2e) per barrel, for the Canadian upstream oil sector (defined as the sum of the oil sands subsector and the conventional oil subsector).
Historical emissions intensity of Canada’s upstream oil sector
Emissions intensity is the emission rate of a given pollutant relative to the intensity of a specific activity or industrial production process. Emissions intensity is determined by dividing the amount of absolute emissions by some unit of output, such as GDP, energy used, population, or barrel of oil produced.
Reducing emissions intensity means reducing the amount of greenhouse gases (GHGs) emitted per unit of output.
Overall Canadian oil GHG emissions intensity per barrel down by over 10% since 2000, oil sands GHG emissions intensity down by nearly 23%, and conventional GHG emissions intensity down by over 32%
Using ECCC numbers drawn from the 2019 National Inventory Report (NIR), the overall GHG emissions intensity of Canadian oil production rose from just under 59 kilograms of CO2e per barrel in 1990 to just over 72 kilograms of CO2e per barrel in 2000, an increase nearly 23 per cent. Then, between 2000 and 2019, the GHG emissions intensity of oil from the Canadian upstream sector fell to just under 65 kilograms of CO2e per barrel in 2019, an overall reduction in those two decades of over 10 per cent (see Figure 1).
Blending the oil sands subsector and the conventional oil subsector into a measure of total GHG emissions intensity for the Canadian upstream oil sector masks some important trends unfolding in the two subsectors. Note that for oil sands mining, ECCC uses the crude bitumen produced from surface mining to calculate intensity. For oil sands upgrading, ECCC uses the volume of synthetic crude oil (SCO) produced for calculating intensity. And, for in-situ bitumen, ECCC uses the volume of bitumen produced at in-situ facilities for calculating intensity. When calculating the overall oil sands intensity, ECCC uses the total SCO production volume plus the total volume of non-upgraded bitumen production, as some of the bitumen produced at in-situ facilities and surface mines is upgraded into SCO.
In the oil sands subsector, GHG emissions intensity rose from just over 116 kilograms of CO2e per barrel in 1990 to just over 117 kilograms of CO2e per barrel in 1992. After 1992, the oil sands subsector GHG emissions intensity fell to just under 104 kilograms of CO2e per barrel by 2000 (a decline of over 11 per cent) and then fell again to just under 80 kg of CO2e per barrel by 2019, an overall decline of nearly 23 per cent from 2000 levels (see Figure 1).
Meanwhile, in the conventional oil subsector, GHG emissions intensity grew from just under 44 kilograms of CO2e per barrel in 1990 to just under 59 kilograms of CO2e per barrel in 2000, an increase nearly 35 per cent. However, since then, the GHG emissions intensity in the conventional oil sector has fallen—to just under 40 kilograms of CO2e per barrel in 2019, a decrease of over 32 per cent in those two decades (see Figure 1).
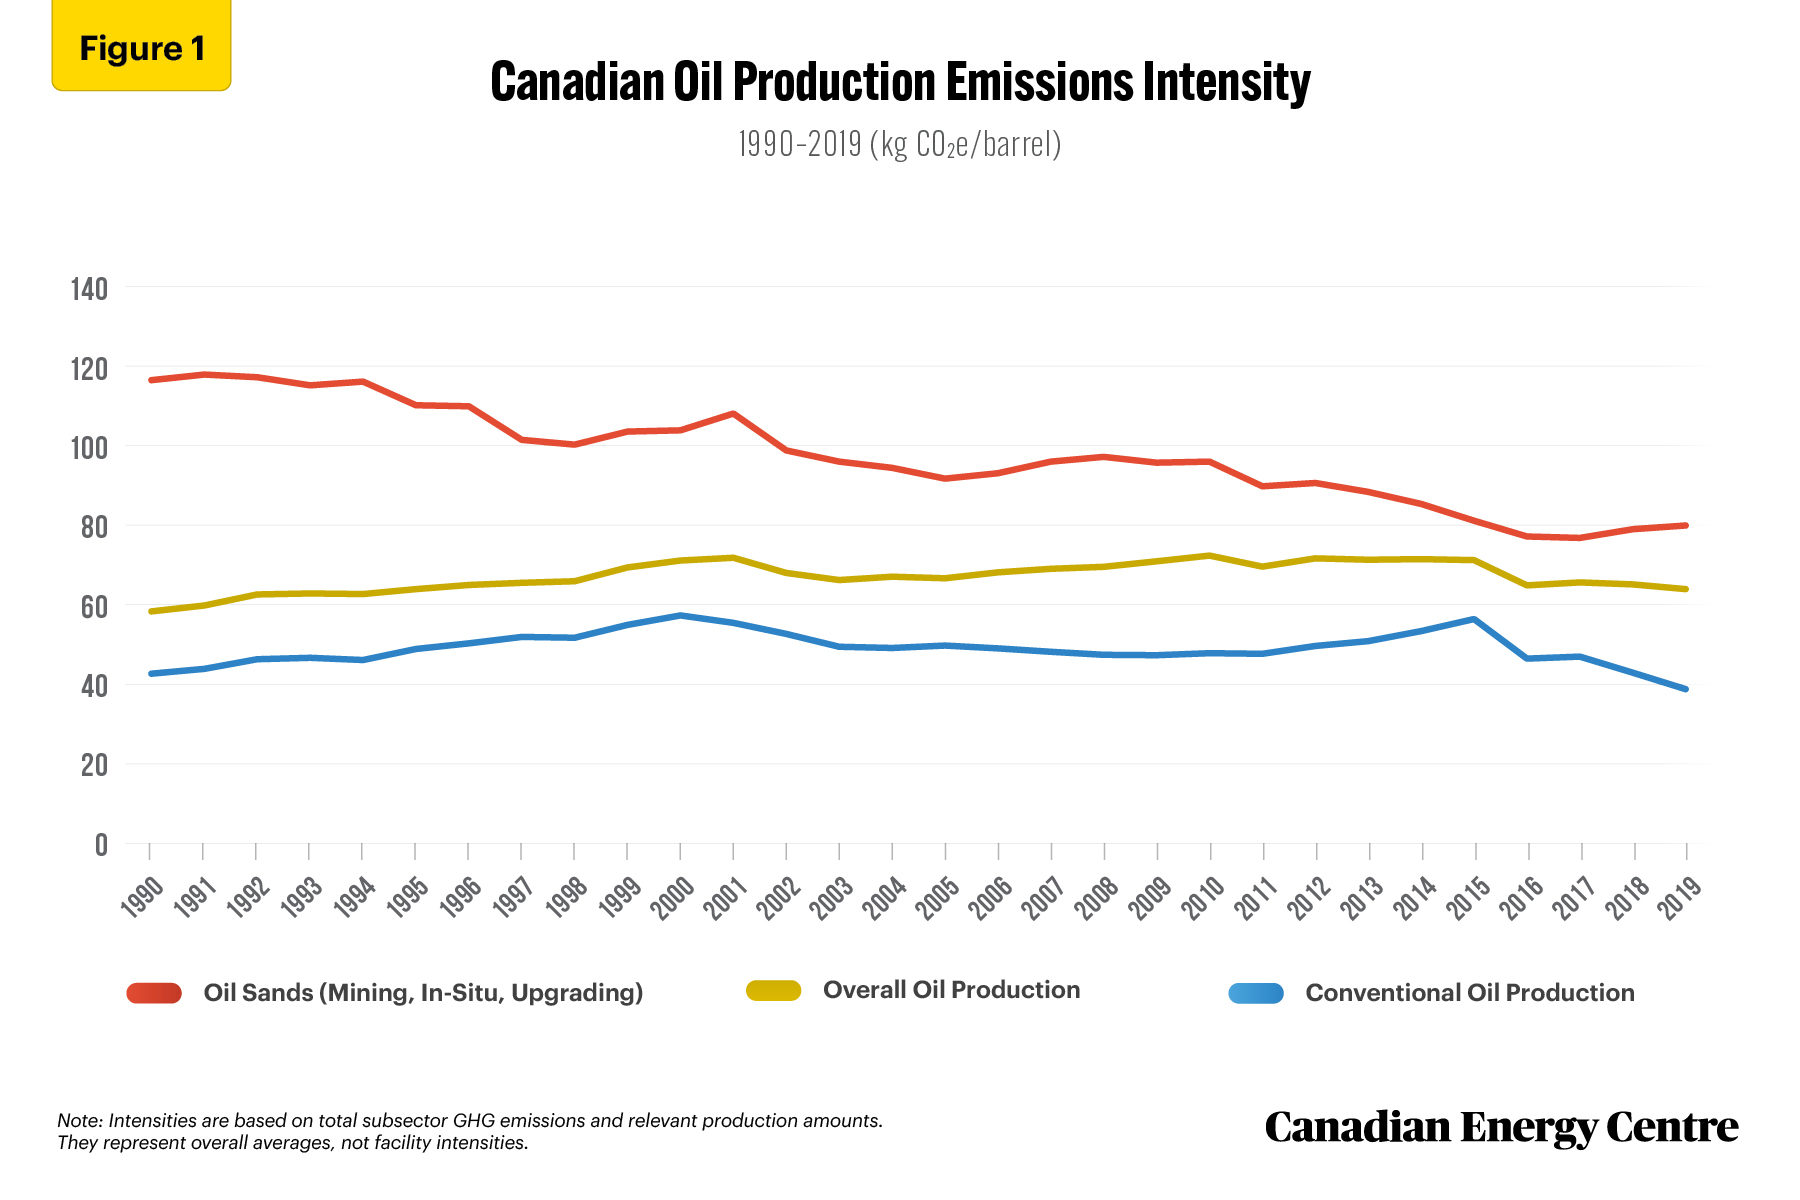
Source: Derived from Environment and Climate Change Canada, 2021a.
How developments in Canada’s oil sands subsector have influenced overall emissions intensity
Clearly the reason that the GHG emissions intensity of the overall Canadian upstream oil sector didn’t drop more between 2000 and 2019 is that oil sands production increased as a fraction of overall oil production.
Using production data from Statistics Canada and the Alberta Energy Regulator (AER), we find that in 2000, the country’s total oil production was about 2 million barrels per day, with production from the oil sands subsector comprising about 610,000 barrels per day, or 30 per cent of total upstream oil production. In 2000, the split in oil sands subsector production was 57 per cent mining and 43 per cent in-situ. In contrast, by 2019, Canada’s total upstream oil production was 4.4 million barrels per day, with oil sands production at 3.1 million barrels per day, or over 70 per cent of total oil production. In-situ production was about 50 per cent of total oil sands production in 2019.
A look at historical milestones in the Canadian oil sands subsector reveals the rapid changes that have occurred, particularly since 1990 (see Table 1).
In 1990, total Canadian upstream oil production was about 1.5 million barrels per day. Of that, about 345,000 barrels per day, or 23 per cent, came from the oil sands subsector. Furthermore, in that year oil sands production was largely from mining operations (65 per cent), with the remainder (35 per cent) from Cyclic Steam Stimulation (CSS) in-situ projects.
In 1990, the only large-scale oil sands plants in operation were the mining operations at Alberta’s Suncor Base Plant and Syncrude Mildred Lake Plant. There was also an Imperial CSS in-situ plant at Cold Lake, Alberta. In 1990, in-situ/SAGD (Steam Assisted Gravity Drainage) as a method for oil sands recovery was largely in its infancy; only a few small pilot in-situ/SAGD demonstration projects were being co-funded at that time through the Alberta Oil Sands Technology and Research Authority (AOSTRA) and the private sector.
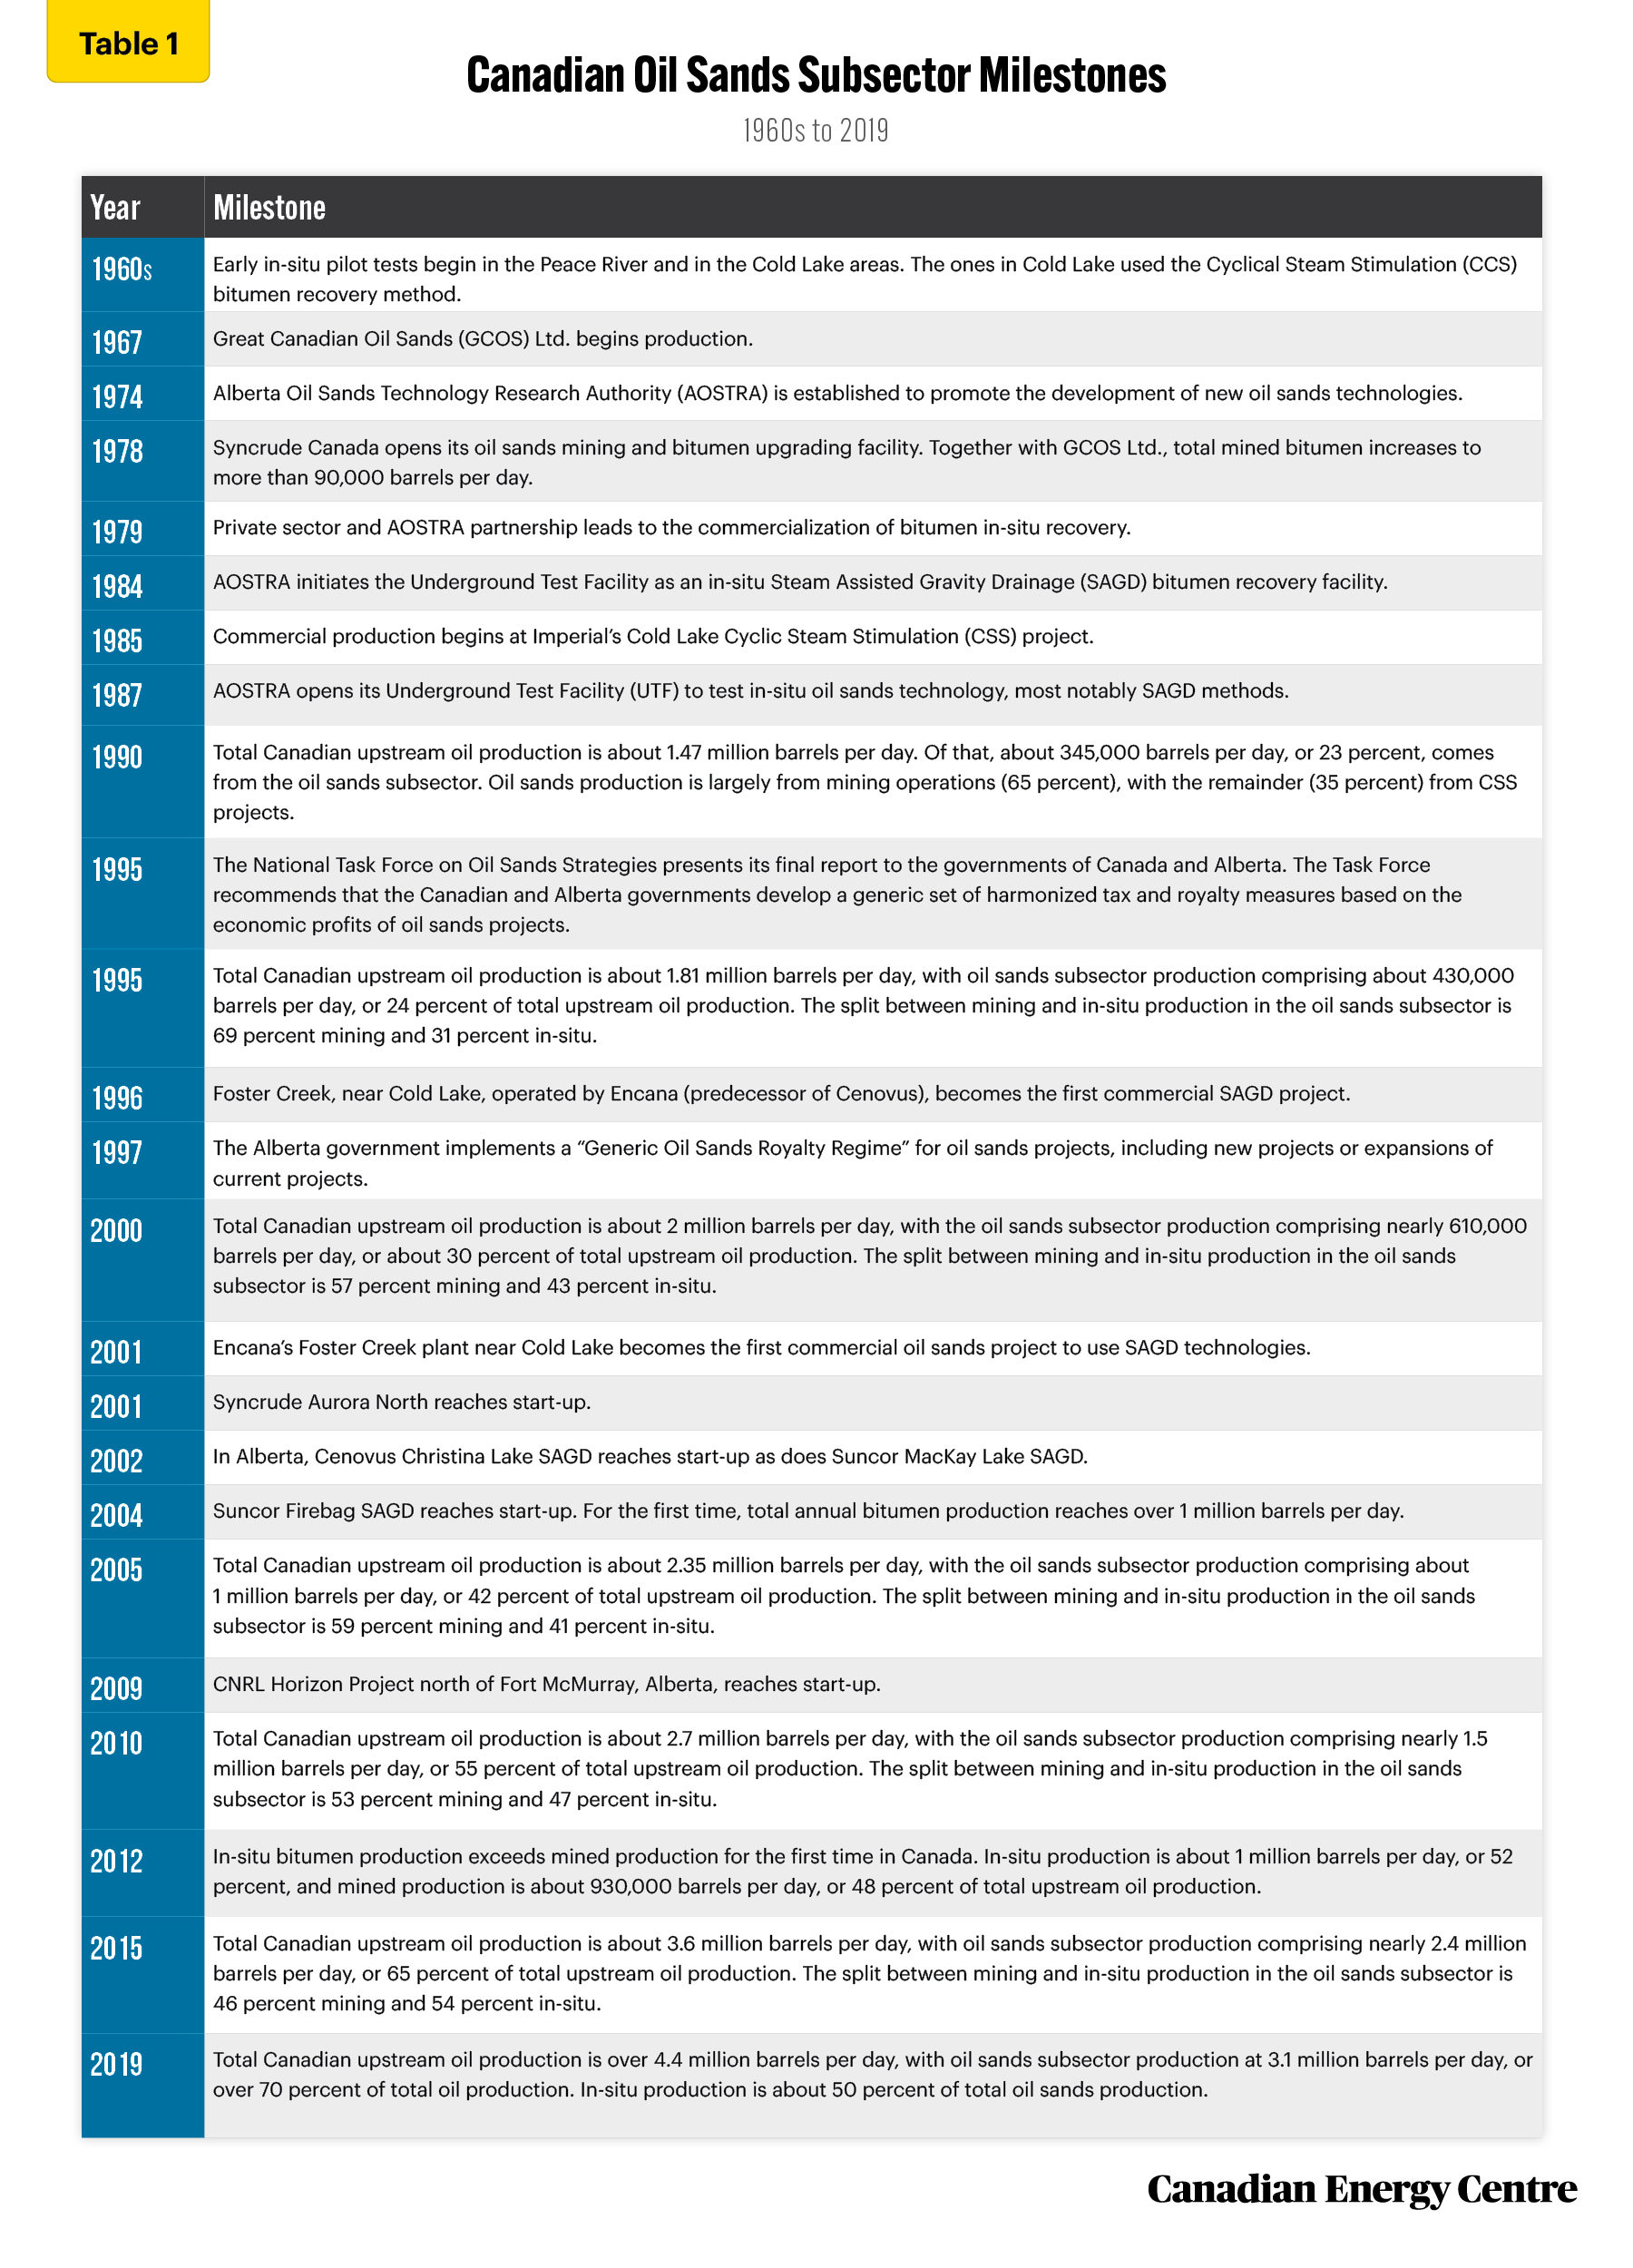
Source: Derived from the Oil Sands Discovery Centre, undated; and the Canadian Association of Petroleum Producers, 2021.
Thus, 2000 seems an appropriate year to compare trends in emissions intensity in the Canadian upstream oil sector because of the rapid changes occurring in the oil sands subsector and the lack of reliable data back in 1990.
The World Resources Institute (WRI) notes: “Choose a base year or base period for which representative, reliable, and verifiable emissions data are available to enable comprehensive and consistent tracking of emissions over time” (WRI, 2014).
According to IPICEA (the global oil and gas industry association for environmental and social issues), API (the American Petroleum Institute), and OGP (the International Association of Oil & Gas Producers): “Companies that have not yet begun (or have only recently begun) to report emissions will usually find it difficult to reliably estimate their emissions as far back as 1990. For other companies, the amount of reorganization that has occurred within the petroleum industry since 1990 makes it difficult to quantify base year emissions that occurred that long ago (IPICEA, API and OGP, 2011)
And finally, the Government of Canada notes: “Since 2005 was adopted as a base year for Canada’s targets, many of the metrics in this report are presented in that context, in addition to the 1990 base year as required by the UNFCCC Reporting Guidelines” (Canada, 2020).
Summing Up: Canada’s upstream oil sector is becoming cleaner on an emissions per barrel basis
Clearly, since 2000, the Canadian upstream oil sector is becoming cleaner on an emissions per barrel basis.
- Between 2000 and 2019, the GHG emissions intensity of the Canadian upstream sector fell from just over 72 kilograms of CO2e per barrel to just under 65 kilograms of CO2e per barrel, an overall reduction of over 10 per cent.
- Between 2000 and 2019, the GHG emissions intensity of the oil sands subsector fell from 104 kilograms of CO2e per barrel to just under 80 kilograms of CO2e per barrel, a decline of nearly 23 per cent.
- Between 2000 and 2019, the GHG emissions intensity in the conventional oil sector has fallen from just under 59 kilograms of CO2e per barrel to just under 40 kilograms of CO2e per barrel, a decrease of over 32 per cent.
Another factor closely related to Canada’s cleaner oil is the country’s high ESG rating among major oil producing nations. According to the Bank of Montreal,
Canada is among the most responsible of the major oil producing countries overall. Based on reputable third-party assessments, Canada continues to top global ESG ratings given performance across a full spectrum of factors from environmental policy to social progress/welfare, political stability, regulatory oversight and corporate governance… we have aggregated rankings on three main ESG categories for the world’s top-15 oil reserve holders. Benchmarks used include the Yale/Columbia Environmental Performance Index (EPI), Social Progress Imperative’s Social Progress Index, and World Bank’s Worldwide Governance Indicators. Canada ranks #1 in all measures when compared to the world’s top oil reserve holders. The country also ranks third overall among the world’s current top oil producing regions, next to Norway and the U.K. (Bank of Montreal, 2021)
As GHG emissions intensity in the Canadian upstream oil sector continues to decline, along with Canada’s highly rated ESG performance, Canadian oil has the potential to become the barrel of choice on the world stage.
Notes
This CEC Fact Sheet was compiled by Lennie Kaplan at the Canadian Energy Centre (www.canadianenergycentre.ca). The author and the Canadian Energy Centre would like to thank and acknowledge the assistance of Philip Cross and two anonymous reviewers in reviewing the original data and research for this Fact Sheet. Image credits: Nataliia Kvitovska from Unsplash.com
References (As of November 2, 2021)
Alberta. 2021. Alberta Oil Sands Greenhouse Gas Emission Intensity Analysis. Government of Alberta. <https://bit.ly/2Vc89oy>.
Alberta Energy Regulator. 2021. ST98: Alberta Energy Outlook. Alberta Energy Regulator. <https://bit.ly/3ai84GY>.
Bank of Montreal. 2021. Survivor Canada: The Unparalleled Position of Canadian Oil in a Transition Challenge. Bank of Montreal.
<https://bit.ly/3FuPzNR>.
Canada, 2021. Greenhouse Gas Sources and Sinks: Executive Summary 2021. Government of Canada. <https://bit.ly/3mo9feZ>.
Canada. Undated, various. National Inventory report: Greenhouse Gas Sources and Sinks in Canada. Government of Canada.
<https://bit.ly/3iHWsBE>.
Canadian Association of Petroleum Producers [CAPP]. 2021. Alberta Oil Sands History and Milestones. CAPP. <https://bit.ly/3vIK61n>.
Environment and Climate Change Canada, 2021. National Inventory Report 1990-2019: Greenhouse Gas Sources and Sinks in Canada. Government of Canada. <https://bit.ly/3v7v3yh>.
IPICEA, the American Petroleum Institute [API], and the International Association of Oil & Gas Producers [OGP]. 2011. Petroleum Industry Guidelines for Reporting Greenhouse Gas Emissions. OGP Report number 446. IPICEA, API, and OPG. <https://bit.ly/3oUv4Ey>.
Natural Resources Canada. 2021. NEUD Tables. Government of Canada. <https://bit.ly/3uRNcQi>.
Oil Sands Discovery Centre. Undated. Facts about Alberta’s Oil Sands and Its Industry. Government of Alberta. <https://bit.ly/3Bt8TZm>.
Oil Sands Magazine. 2021. Project and Infrastructure Database. Oil Sands Magazine. <https://bit.ly/3mDoCim>.
Statistics Canada. 2021a. Table: 25-10-0063-01: Supply and disposition of crude oil and equivalent. Statistics Canada. <https://bit.ly/3ApBtd5>.
Statistics Canada. 2021b. Table 25-10-0014-01: Crude oil and equivalent, monthly supply and disposition. Statistics Canada. <https://bit.ly/3AsyvEq>.
World Resources Institute and World Business Council for Sustainable Development. 2004. The Greenhouse Gas Protocol: A Corporate Accounting and Reporting Standard. World Resources Institute and World Business Council for Sustainable Development. <https://bit.ly/3v6MwH0>.
World Resources Institute [WRI]. 2014. GHG Protocol Mitigation Goal Standard: An Accounting and Reporting Standard for National and Subnational Greenhouse Gas Reduction Goals. WRI. <https://bit.ly/3EinmIG>.
Creative Commons Copyright
Research and data from the Canadian Energy Centre (CEC) is available for public usage under creative commons copyright terms with attribution to the CEC. Attribution and specific restrictions on usage including non-commercial use only and no changes to material should follow guidelines enunciated by Creative Commons here: Attribution-NonCommercial-NoDerivs CC BY-NC-ND.