Social
To sign up to receive the latest Canadian Energy Centre research to your inbox email: research@canadianenergycentre.ca
Download the PDF here
Download the charts here
Overview
Canada has committed itself to a series of ambitious emissions reduction targets for 2030 (40 per cent to 45 per cent below 2005 levels) and 2050 (net zero emissions or NZE) for the oil and gas sector. A significant effort in reducing emissions will fall on Canada’s natural gas production and processing subsector. Finding, developing, processing and transporting natural gas involves four main steps: exploration, development, processing and distribution.
Under the federal government’s 2030 Emissions Reduction Plan (ERP), the natural gas production and processing subsector is targeted for a 24 Mt, or 45 per cent, reduction between 2019 and 2030 (from 53 Mt to 29 Mt) (Environment and Climate Change Canada, 2022).
Natural gas, as a lower emitting fuel, will play a critical role in meeting rising global energy demand, while transitioning to NZE. This will require a significant increase in the world production of liquefied natural gas (LNG) from current levels.
In this CEC Fact Sheet, using data drawn from Rystad’s UCube and Gas MarketCube, we assess the future of Canada’s natural gas production and processing subsector under NZE, and where Canada can play a role as a secure and reliable supplier of low-emitting natural gas, in the form of LNG, to a world in transition, hungry for natural gas as a fuel source. The written content in this report was prepared by the Canadian Energy Centre (CEC) and does not represent the views of Rystad Energy.
Background on Rystad UCube and Gas Market Cube
Rystad Energy is an independent energy research company providing data, analytics and consultancy services to clients around the globe.
UCube is Rystad Energy’s global upstream database, including production and economics (costs, revenues, and valuations) for more than 80,000 assets, covering the portfolios of more than 3,500 companies.
The UCube data set is used to study all parts of the global oil and gas exploration and production (E&P) activity value chain, including operational costs (opex), capital investment (capex), fiscal terms, and net cash flows for projects and companies, both globally and by country. (Rystad Energy, 2022c).
The Rystad Energy GasMarketCube is a database that provides a comprehensive overview of production assets, country-specific demand, international pipeline gas and LNG trade, economic and financial field and infrastructure data, contract data, as well as long-term price forecasts for the main global trading hubs. It analyzes natural gas balances, including pipeline and LNG trade flows (Rystad Energy, 2022b).
Global natural gas markets under net zero emissions
Under the Rystad Energy base case, global natural gas demand grows from 3,985 billion cubic metres (bcm) per year in 2021 to 4,522 bcm in 2032, before increasing slightly to 4,522 bcm per year in 2035. This represents an increase of over 13 per cent (see Figure 1).
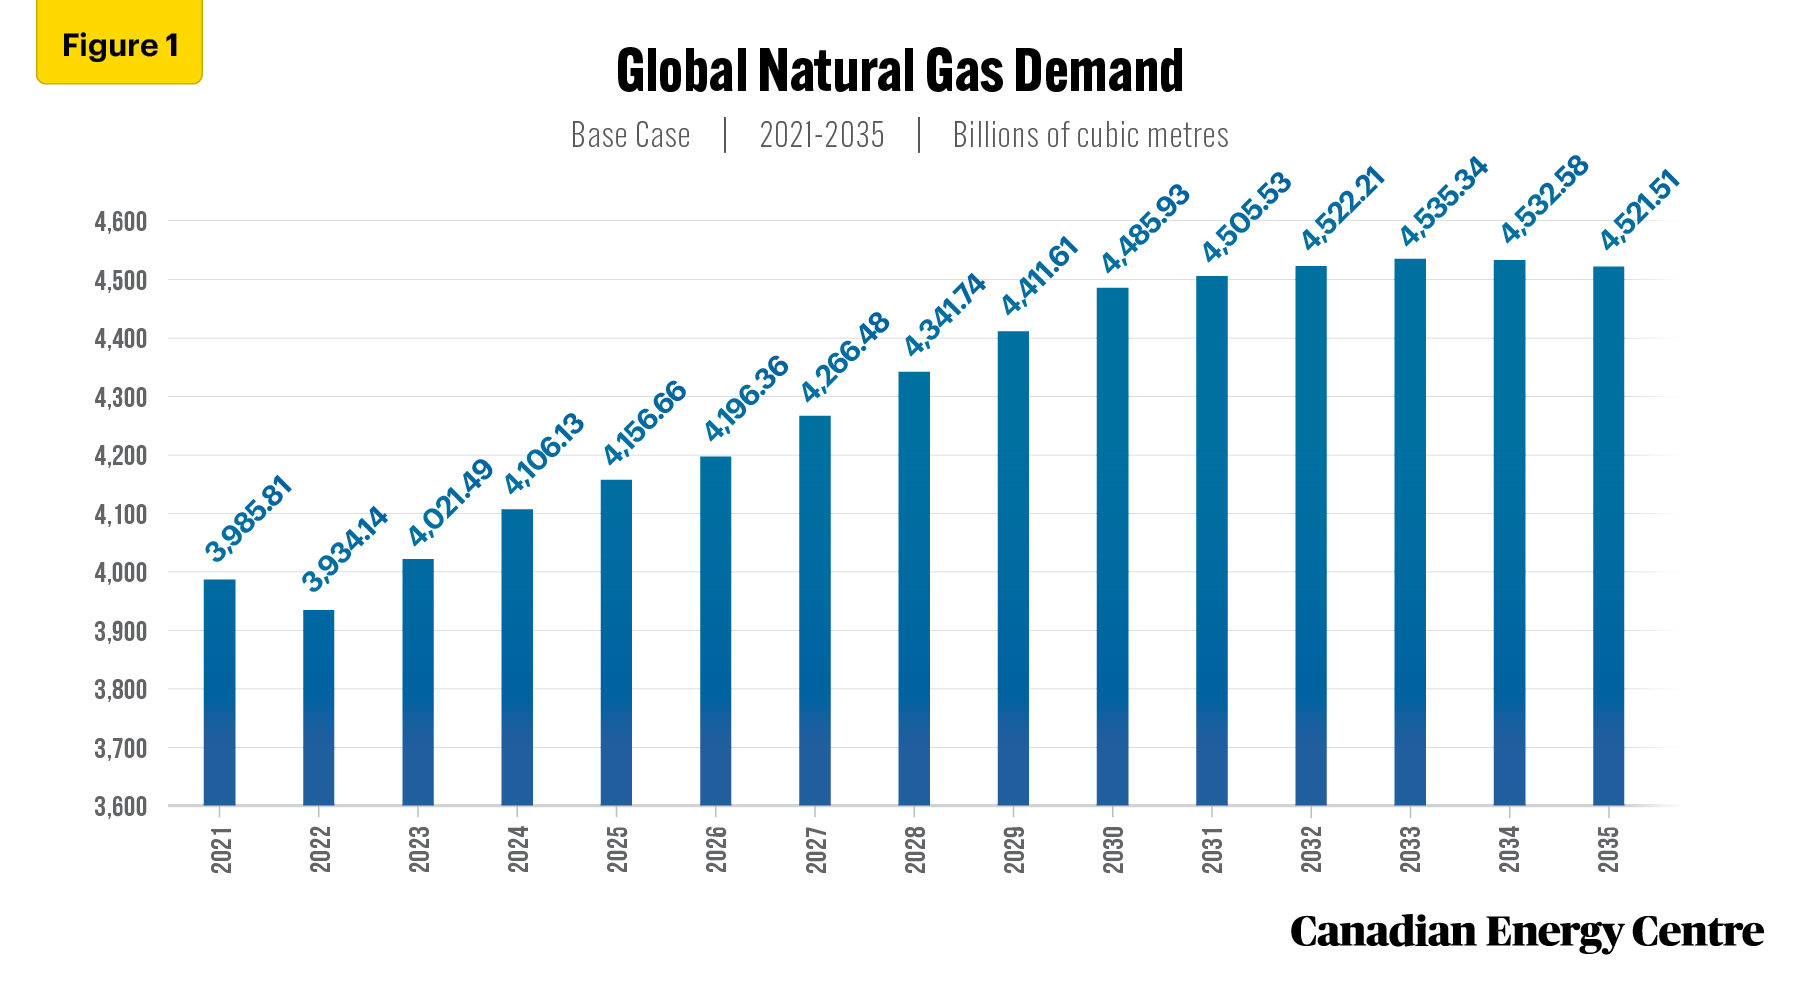
Source: Derived from the Rystad Energy GasMarketCube
Natural gas demand is particularly robust in Asia and Africa over the next decade and a half. Demand for natural gas in Asia grows from 959 bcm in 2021 to 1,335 in 2035, an increase of 39 per cent. Meanwhile in Africa, natural gas demand grows from 170 bcm in 2021 to 212 bcm in 2035, an increase of over 24 per cent.
Under the Rystad Energy base case, global natural gas production grows from 4,006 bcm per year in 2021 to 4,550 bcm in 2032, before declining slightly to 4,471 bcm per year in 2035. This represents an overall increase of nearly 12 per cent (see Figure 2).
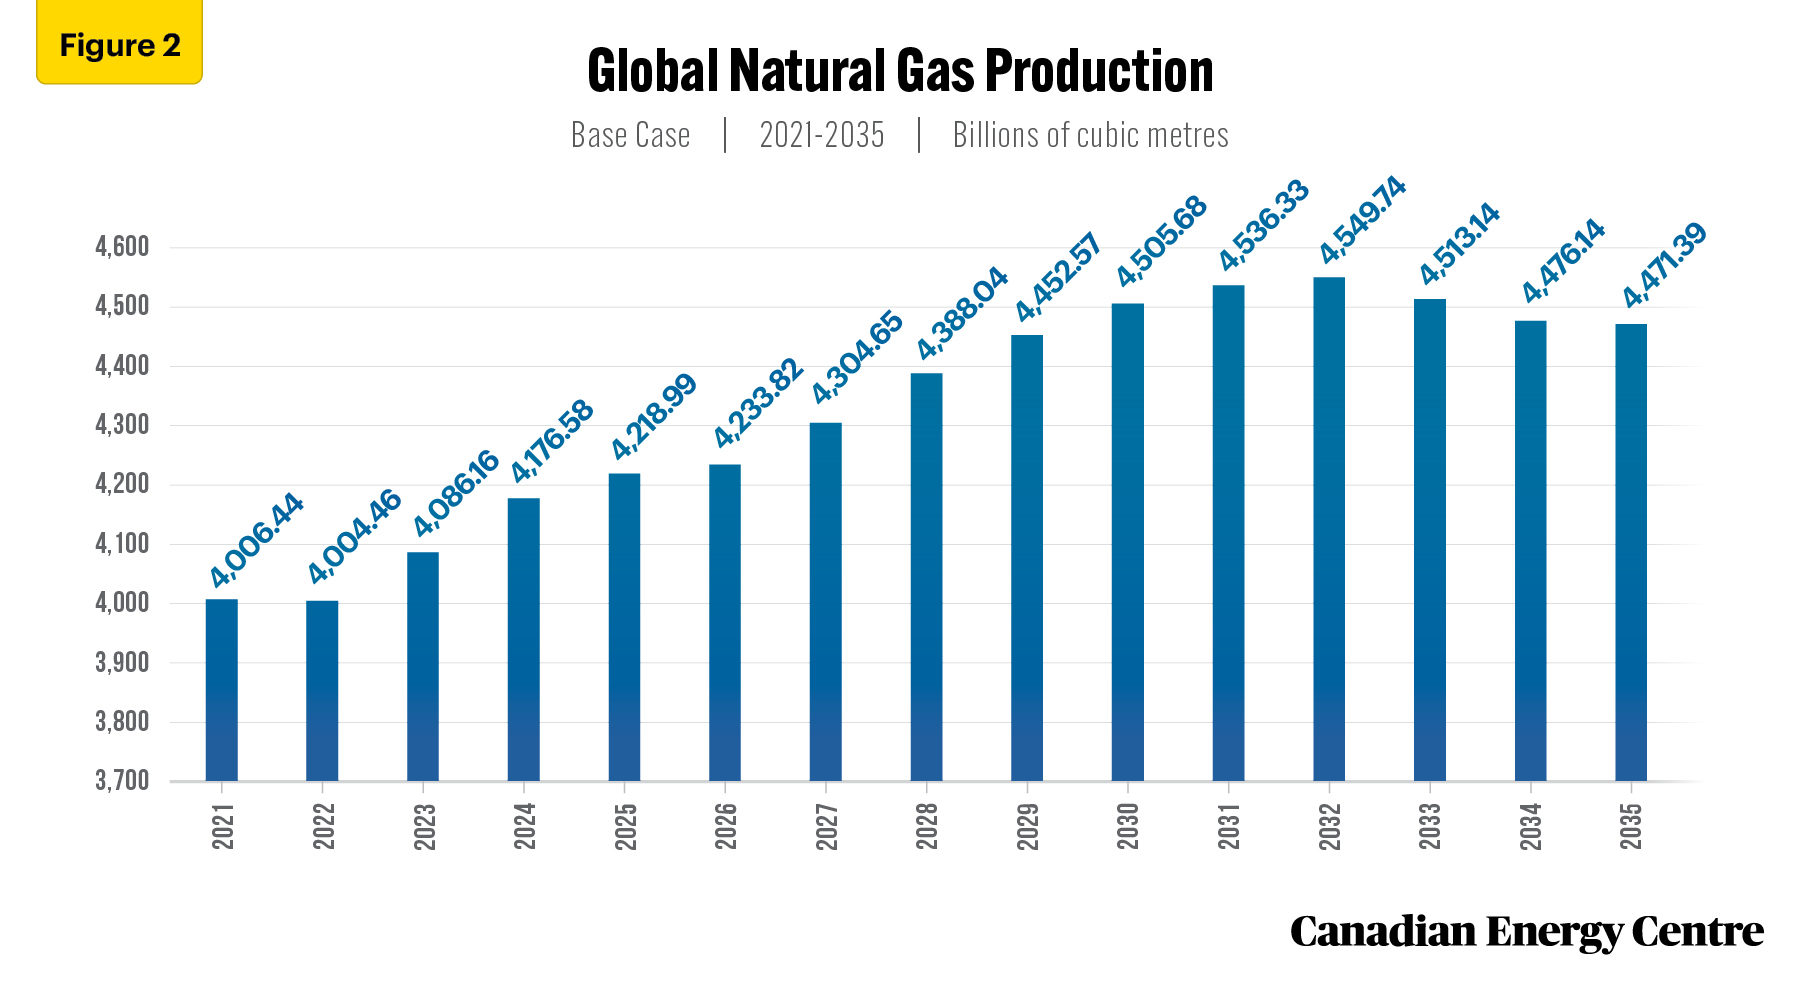
Source: Derived from the Rystad Energy GasMarketCube
Natural gas production is particularly robust from North America and the Middle East over the next decade and a half. Production of natural gas in North America grows from 1,149 bcm in 2021 to 1,444 in 2035, an increase of nearly 26 per cent. Meanwhile in the Middle East, natural gas production grows from 678 bcm in 2021 to 923 bcm in 2035, an increase of over 36 per cent.
At the same time, natural gas production from Asia falls from 667 bcm in 2021 to 599 bcm in 2035, a decline of over 10 per cent, while natural gas production from Europe falls from 223 bcm in 2021 to 151 bcm in 2035, a decline of over 32 per cent (see Figure 3).
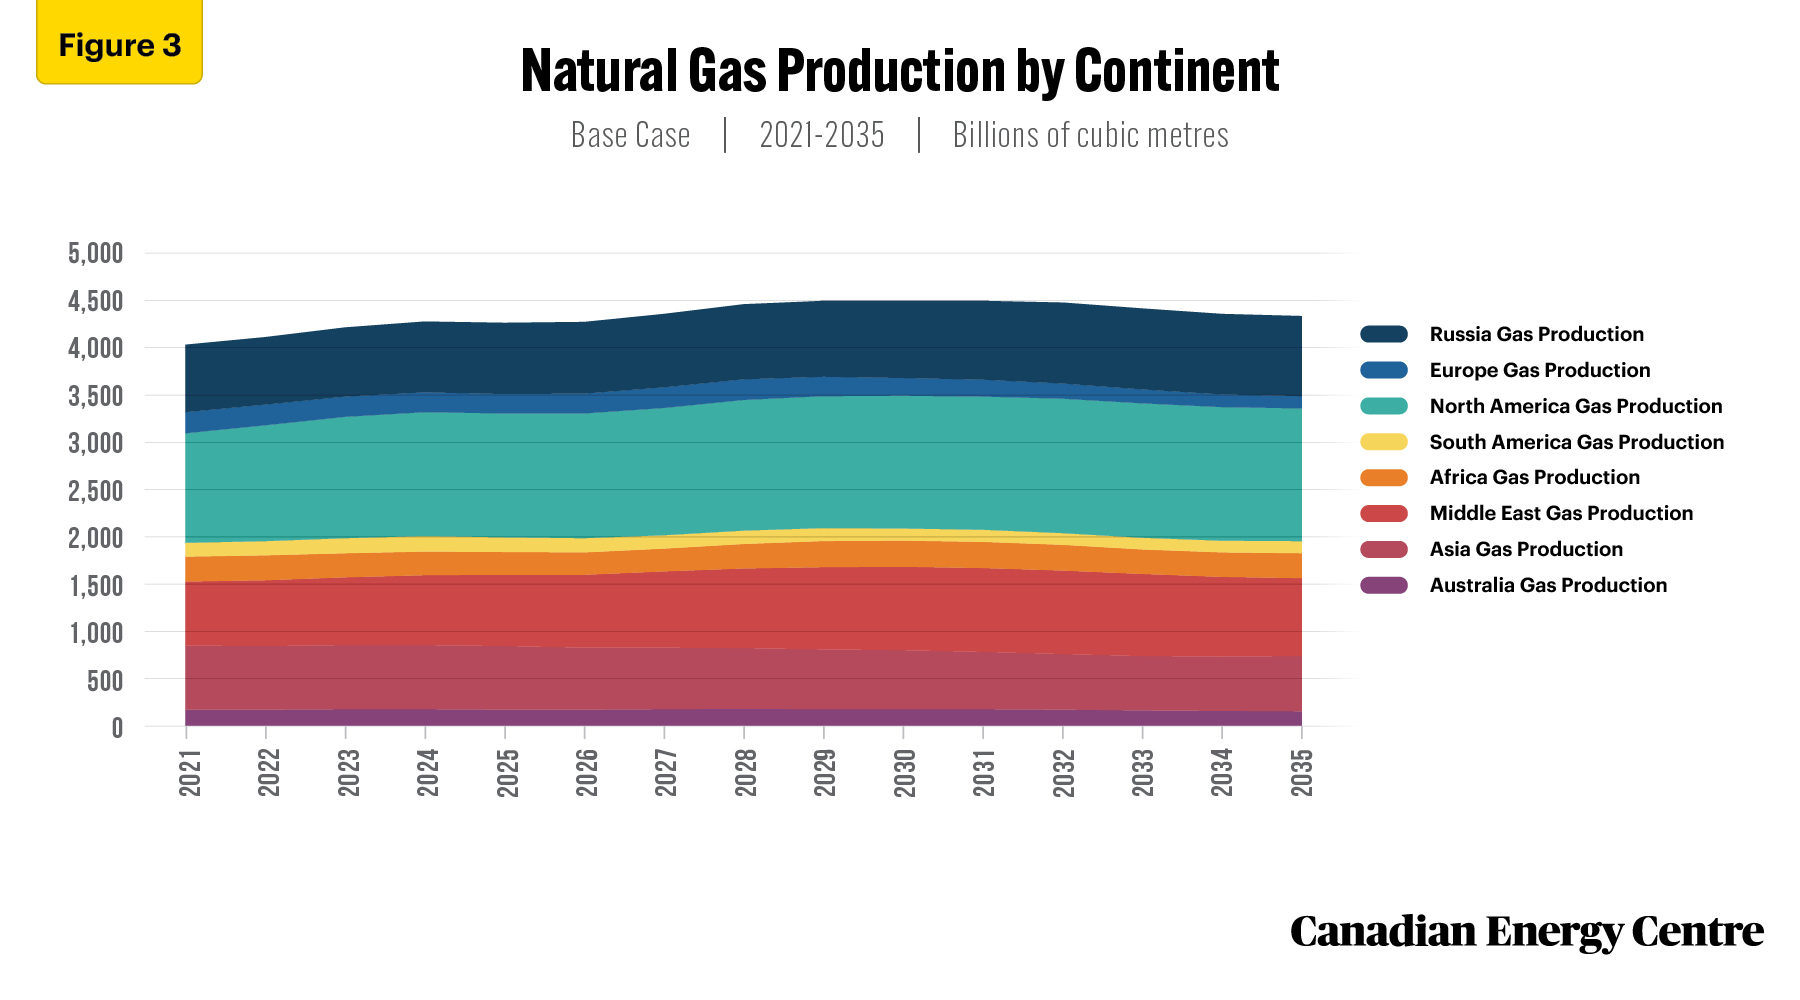
Source: Derived from the Rystad Energy GasMarketCube
According to McKinsey and Company, factors contributing to the strength of natural gas include the following:
- Lower carbon intensity and lower particulate emissions. Gas generates lower emissions per unit of energy than coal or oil, both before and during combustion.
- Rapid overall energy demand growth in Asian markets. Asia has seen a rapid increase in power-sector and industrial demand. The former will see substantial additional coal-to-gas switching as well as gas and renewables working as complementary technologies. And the latter will see the need for new infrastructure to meet industrial demand for gas.
- A significant reduction in the cost of carbon capture, utilization, and storage (CCUS) technology could lead to widespread adoption, which would result in higher levels of gas use in power and industry (McKinsey and Company, 2021).
The export of LNG, particularly to the Asia-Pacific region, offers a means to backstop declining natural gas production in the region during the energy transition.
As McKinsey and Company goes on to explain:
LNG is a delivery mechanism that can reach markets with limited pipeline import infrastructure as well as markets in Asia where domestic production is declining, LNG holds a strong advantage and is expected to see continued strength until about 2040 (McKinsey and Company, 2021).
Global LNG supply, under the Rystad base case, is forecast to increase to nearly 698 million tonnes per annum (mtpa) by 2035, a jump of about 83 per cent (see Figure 4).
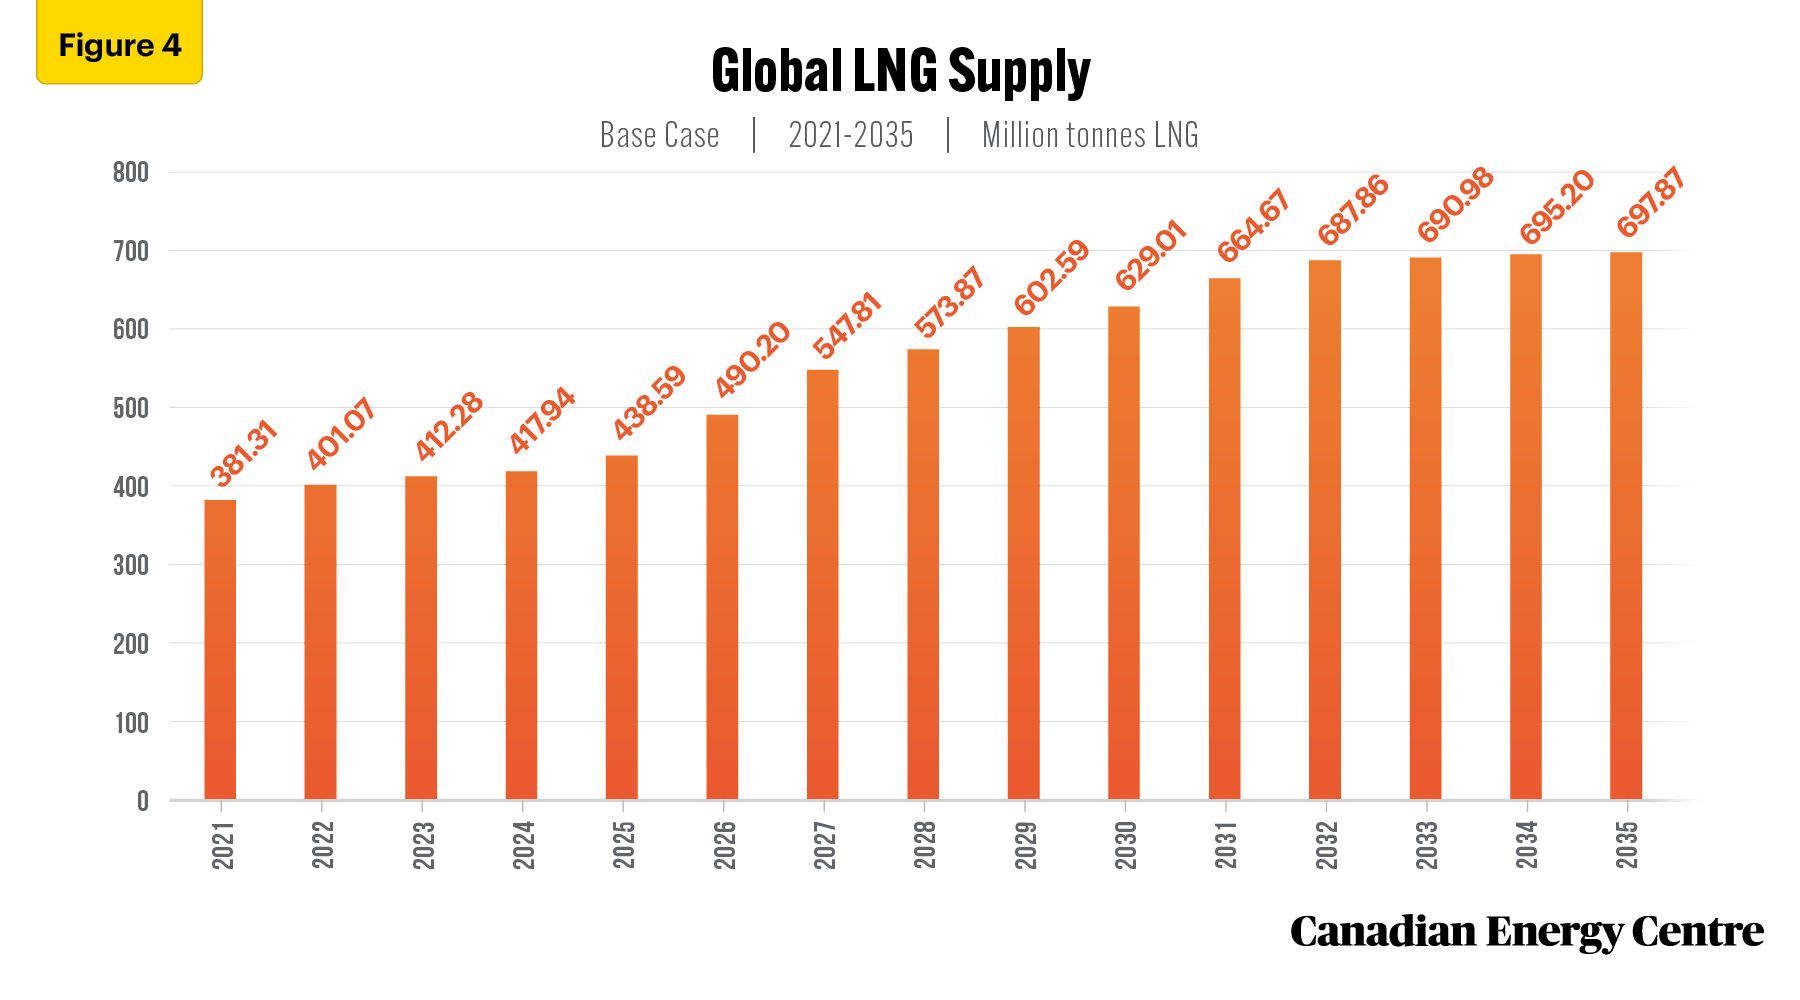
Source: Derived from the Rystad Energy GasMarketCube
Figure 5 shows LNG supply from 2021 to 2035 by major LNG-producing countries. In 2021, Australia was the world’s leading LNG supplier at 79 mtpa, followed by Qatar at 77 mtpa, and the United States at 73 mtpa. By 2035, the United States will permanently replace Australia and Qatar as the world’s leading LNG supplier at 205 mtpa, followed by Qatar at 111 mtpa, and Australia at 67 mtpa. Russian LNG supply was expected to grow to 58 mtpa by 2035, but this is now in question, leaving opportunities for countries such as Canada to fill the void (see Figure 5).
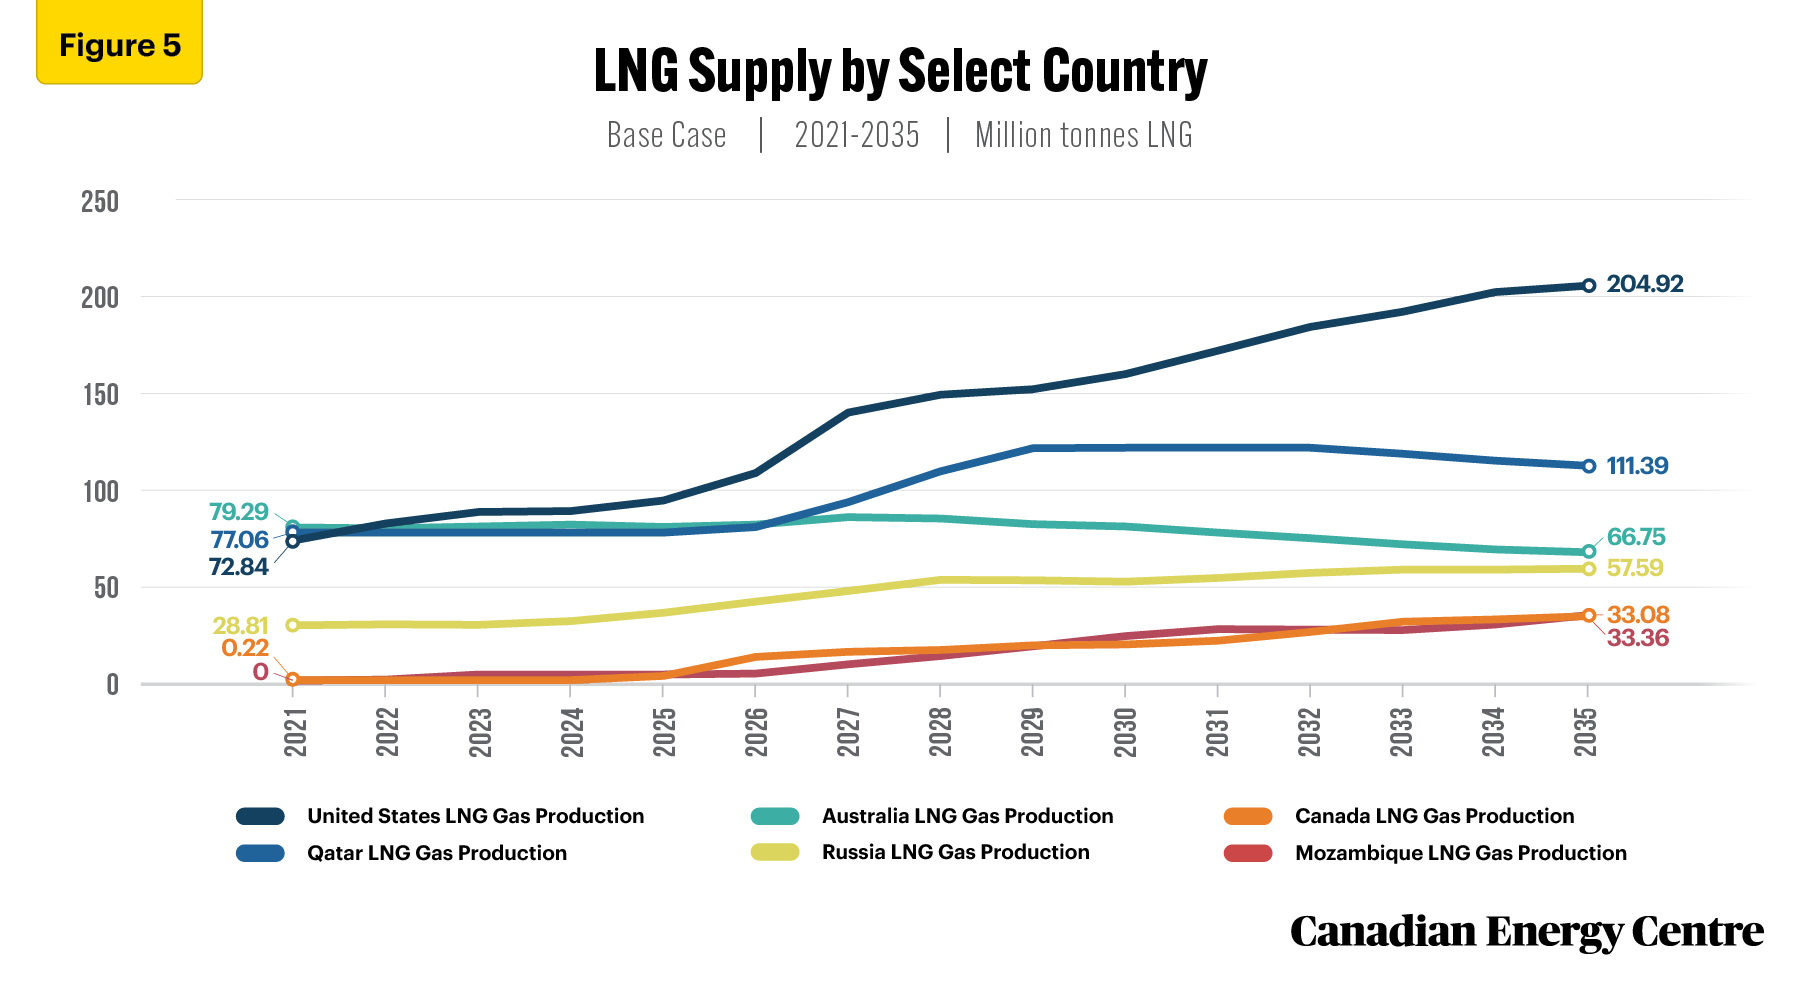
Source: Derived from the Rystad Energy GasMarketCube
As noted in Figure 6, global LNG demand is expected to grow from 385 mtpa in 2021 to 733 mtpa by 2035, a jump of over 90 per cent in the next decade and a half, according to Rystad Energy (see Figure 6).
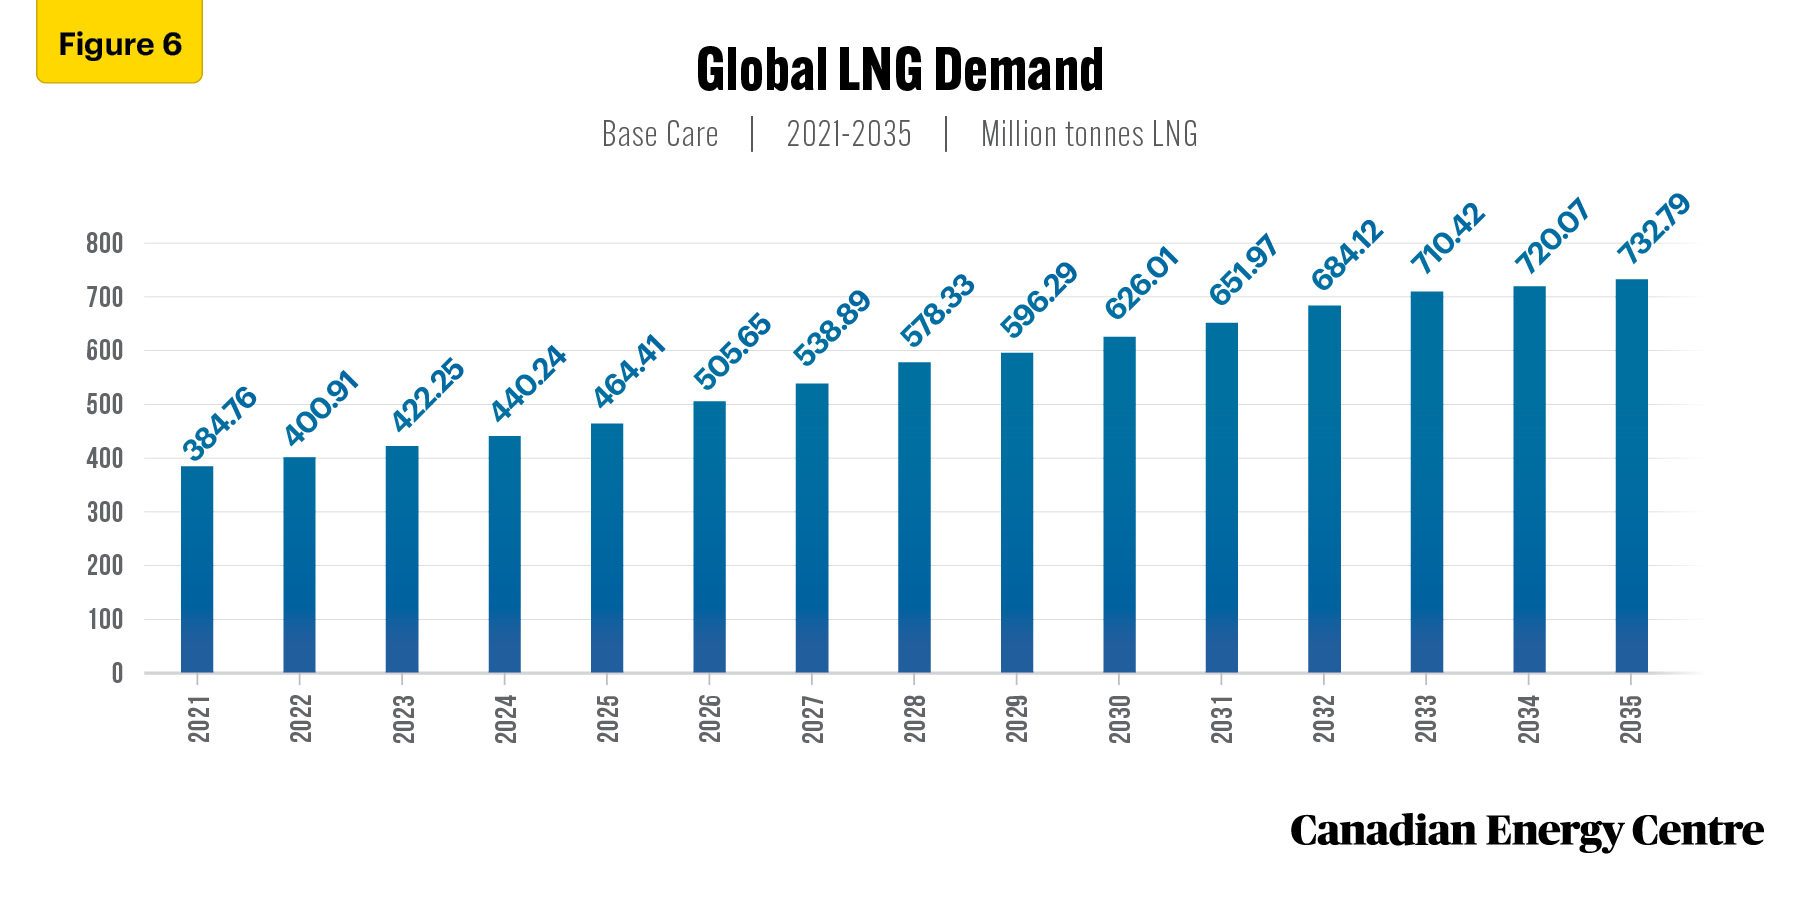
Source: Derived from the Rystad Energy GasMarketCube
China is currently the world’s largest consumer of LNG at 78 mpta in 2021, followed by Japan at 77 mtpa and South Korea at 47 mtpa. By 2035, LNG consumption in China is forecast to reach 176 mtpa, followed by Japan at 61 mtpa, South Korea at 56 mtpa and India at 53 mtpa. The largest demand markets for LNG are clearly in Asia (see Figure 7).
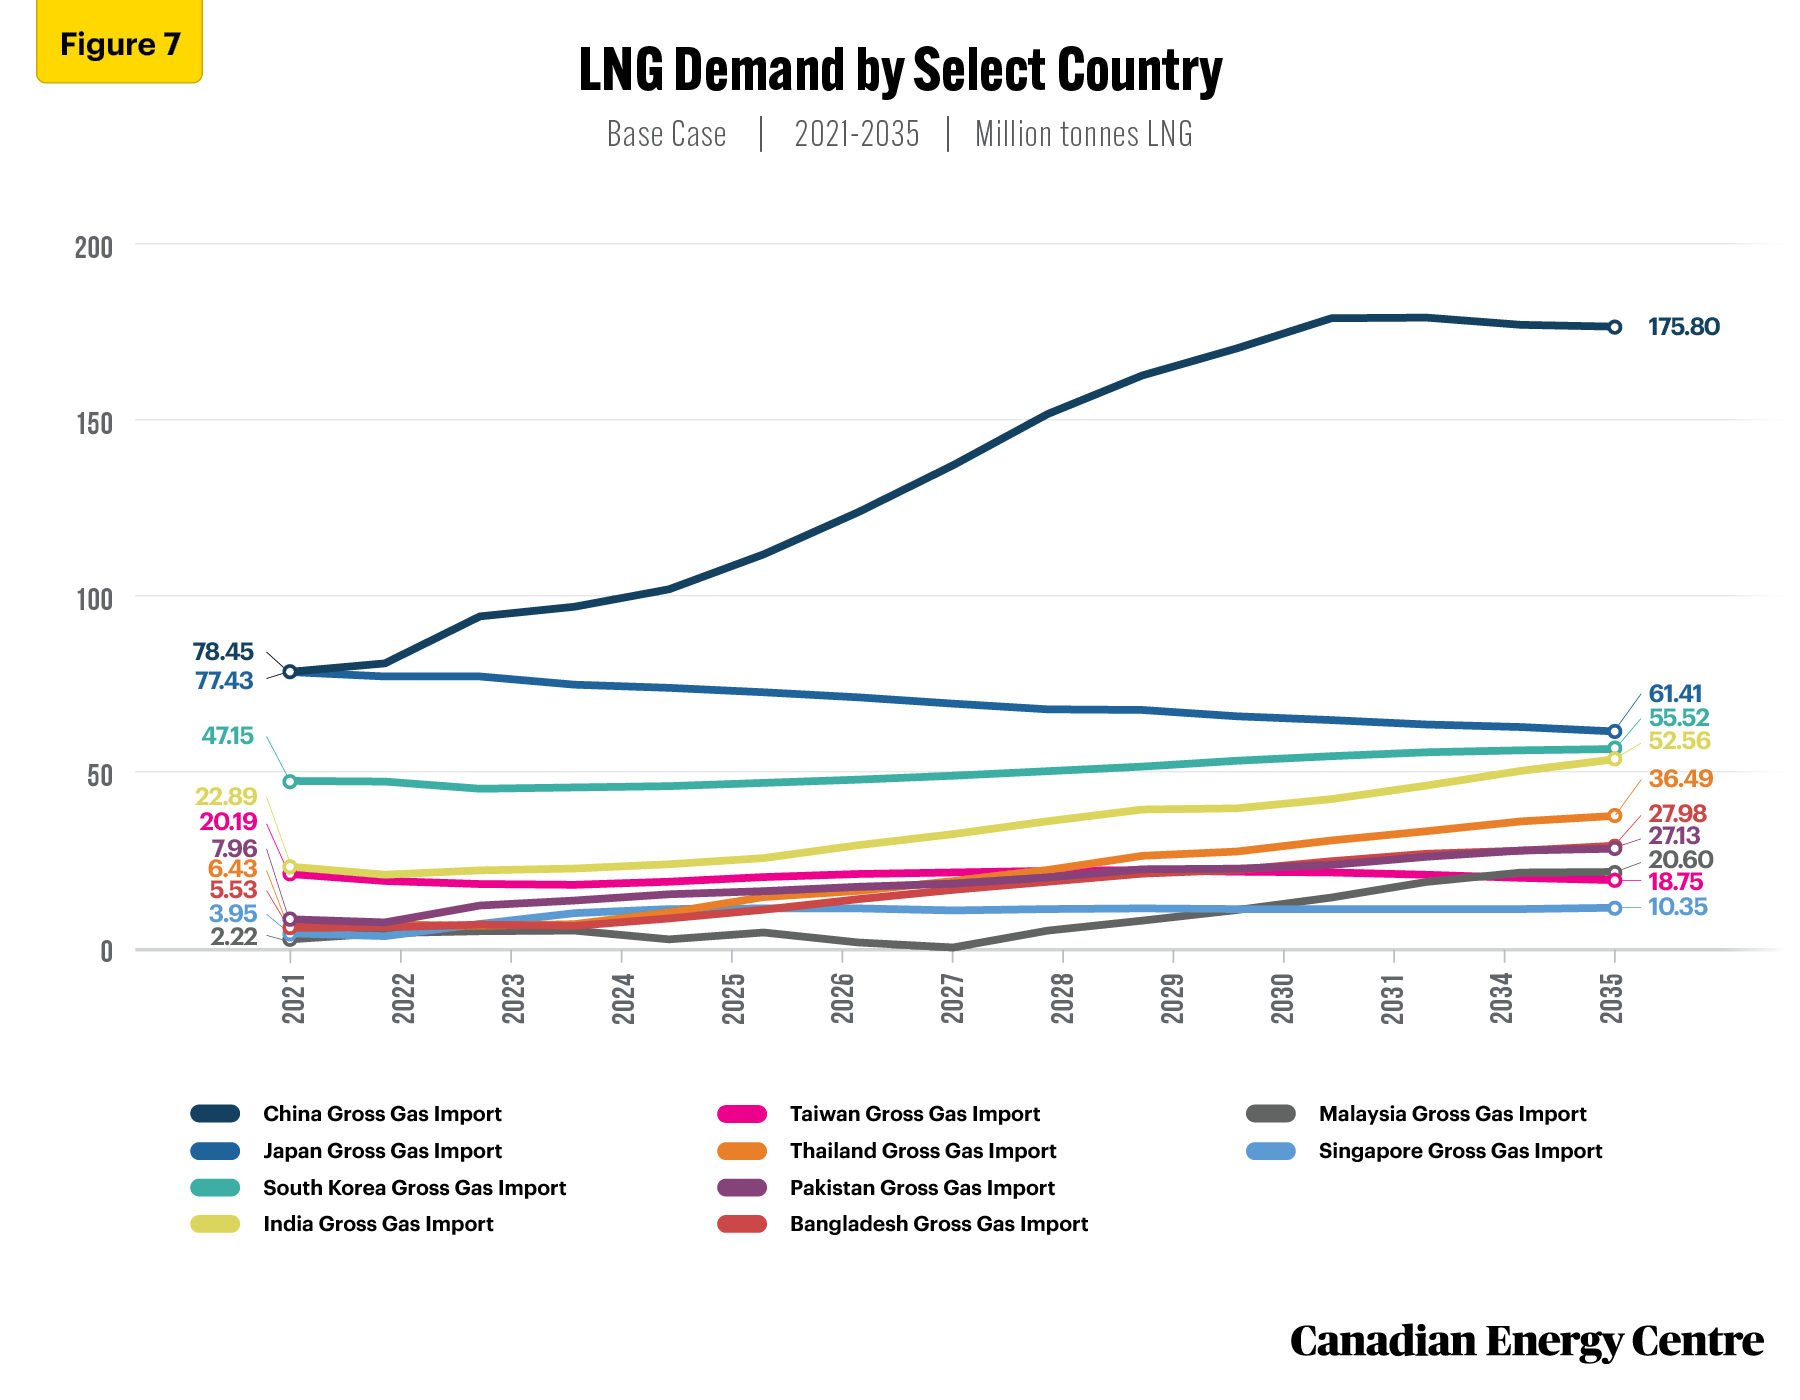
Source: Derived from the Rystad Energy GasMarketCube
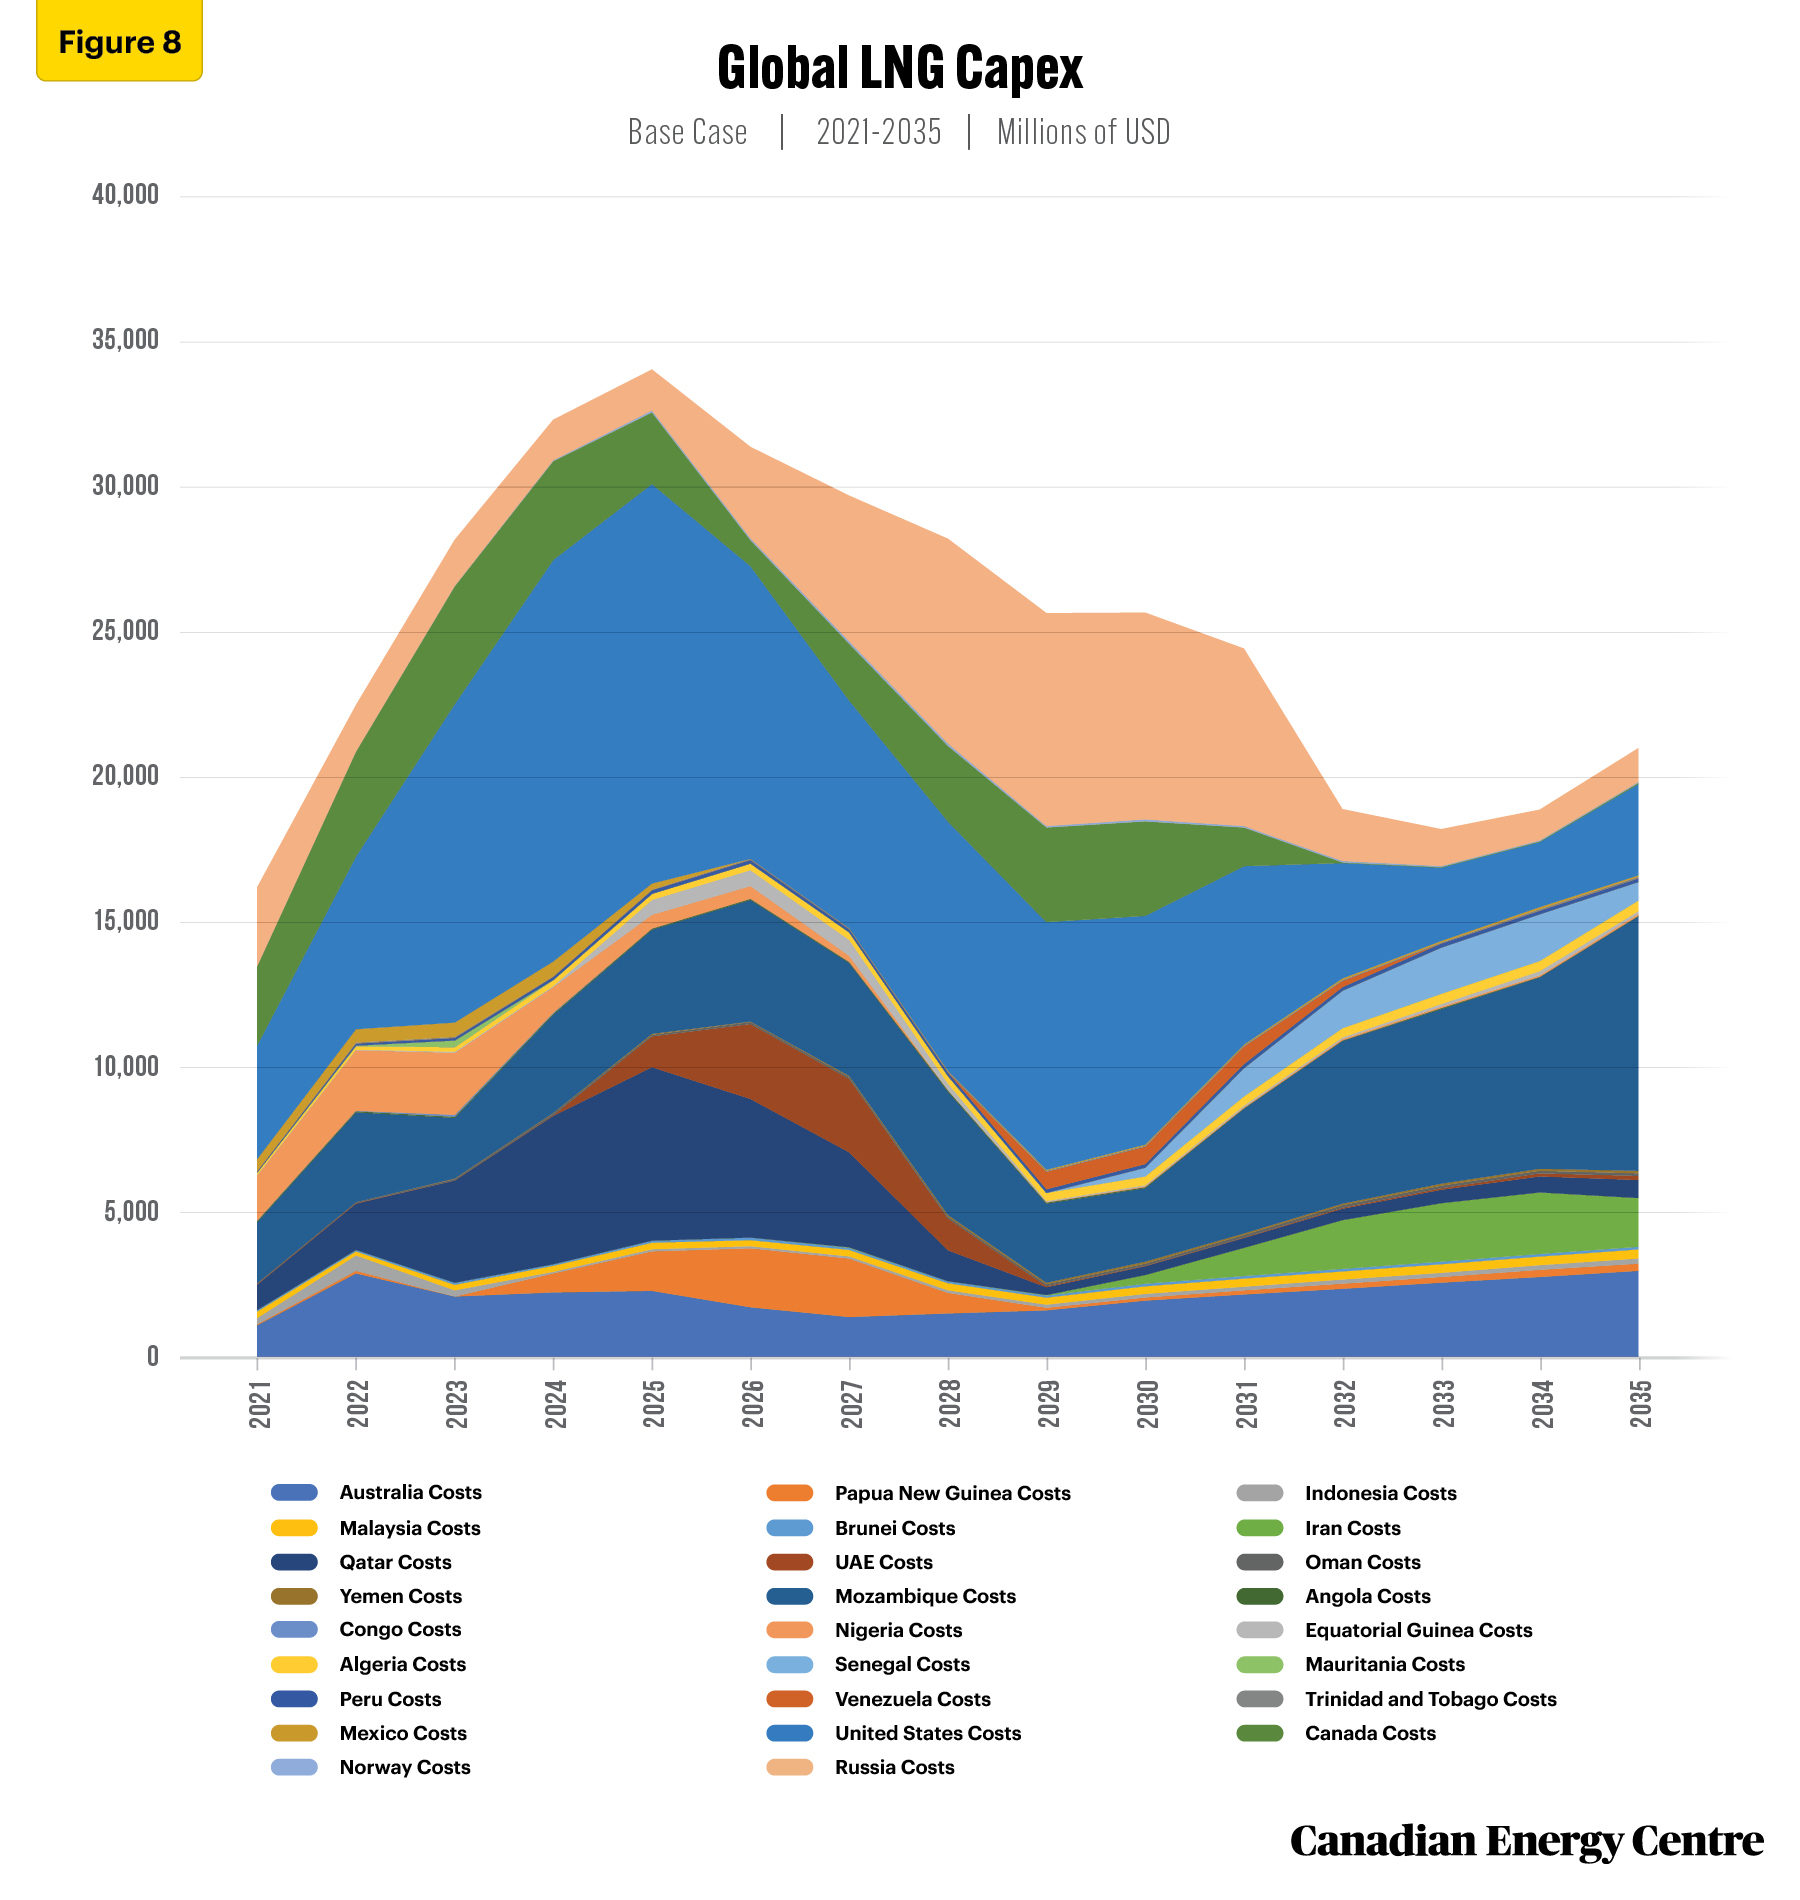
Figure 8 depicts global capital expenditures (capex) for producing, under development and planned LNG projects by country between 2021 and 2035. LNG capex includes finding the gas reserves; developing the gas fields (wells, well site facilities, gas gathering systems); gas processing plants (to process the gas to pipeline specifications); transmission pipelines (to transport the natural gas to the LNG facility); LNG facilities (to liquify the natural gas, store and load on LNG carrier ships); LNG carriers (for sea shipment); regassification terminal (to receive LNG from carriers and convert LNG to gaseous state); transmission pipelines (to transport the gas to the market area); and distribution system (to deliver the gas to the end users), but does not include CCUS facilities.
Cumulative global LNG capex is estimated at over $376 billion between 2021 and 2035. The U.S. leads the way at $110 billion, followed by Mozambique at nearly $63 billion, and Russia at $50 billion (see Figure 8). Russia and Mozambique capex for LNG are questionable at present due to geopolitical conflicts and growing insurgency, respectively.
Source: Derived from the Rystad Energy GasMarketCube
Canada’s role in the natural gas market energy transition
Russia’s invasion of the Ukraine has focused attention on finding alternative supplies for Europe, giving impetus to longdelayed projects to ship Canadian LNG abroad (Financial Post, 2022).
Much of the 45 per cent emissions reduction target for natural gas production and processing in Canada will be met through methane reductions (the federal government has set a 75 per cent reduction target for methane by 2030 compared with 2012 levels) and by switching to low- or zero-emitting electricity, such as hydroelectricity from British Columbia (Financial Post, 2022).
Under the Rystad base case, natural gas production in Canada is forecast to be strong during energy transition, rising from 173 bcm in 2021 to 265 bcm in 2035, an increase of nearly 48 per cent (see Figure 9).

Source: Derived from the Rystad Energy GasMarketCube
As a significant producer of natural gas, Canada is uniquely positioned over the medium-term to help improve world energy security through investment in infrastructure that would allow LNG to be shipped to Asia and Europe.
to Canada’s advantage in a competitive global LNG market is an abundance of low-cost natural gas to supply west coast LNG capacity. West coast LNG has advantages in shipping and feedgas costs over the U.S. Gulf Coast (USGC), being around $1.00 per mmbtu less on each.
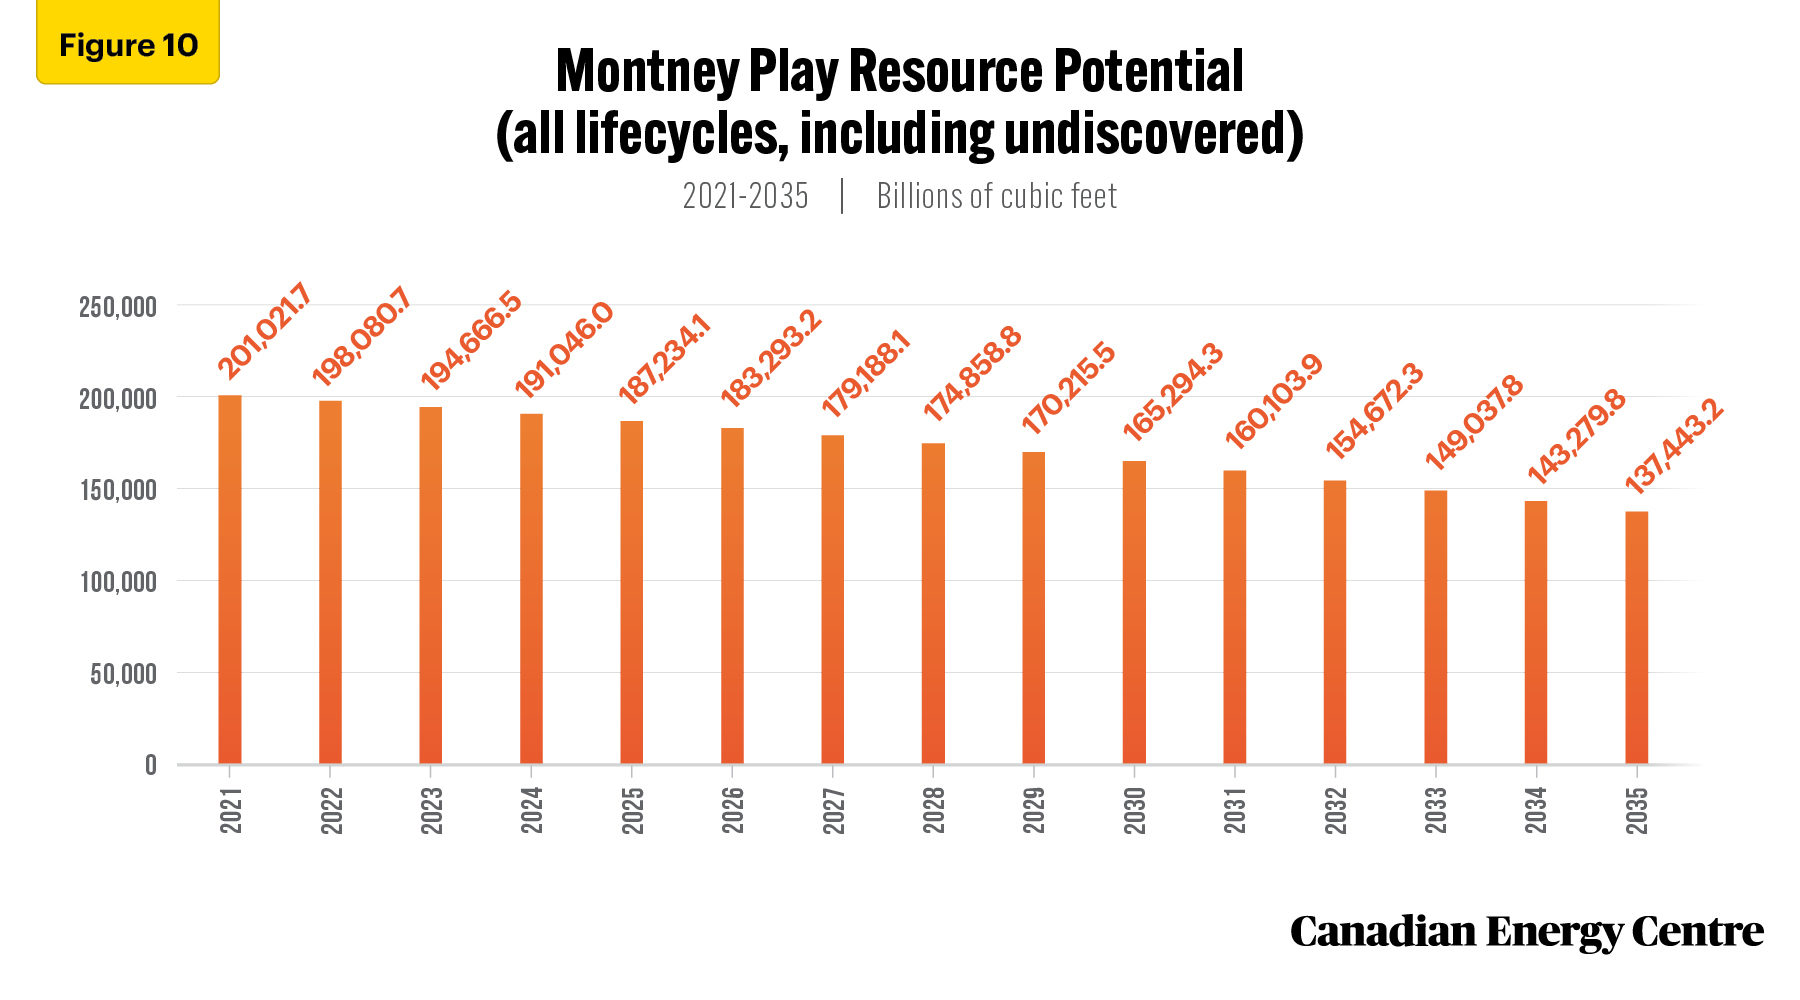
The LNG Canada project, for example, is expected to source a lot of its feedgas from the Montney Basin. According to Rystad Energy, as of 2021, the Montney Play holds over 200 trillion cubic feet (tcf) of commercial reserves (see Figure 10).
Source: Derived from the Rystad Energy GasMarketCube
The economics of Montney as feedgas for LNG are very favourable, with plays in Montney currently breaking even at about US$2.86 per mmbtu, compared to Barnett Shale at US$6.92 per mmbtu; Fayeteville at US$8.29 per mmbtu; Eagle Ford at US$3.29 per mmbtu; Marcellus Shale at US$3.44 per mmbtu; and Haynesville at US$3.54 per mmbtu (see Figure 11).

Source: Derived from the Rystad Energy GasMarketCube
Assuming the beginning of LNG exports from the Canadian west coast in the mid-2020s, and incremental pipeline export capacity to markets in the U.S. and Eastern Canada being in place, the Montney play alone has an estimated ultimate production capacity of 15.9 billion cubic feet per day (bcf/d) of gas by 2035.
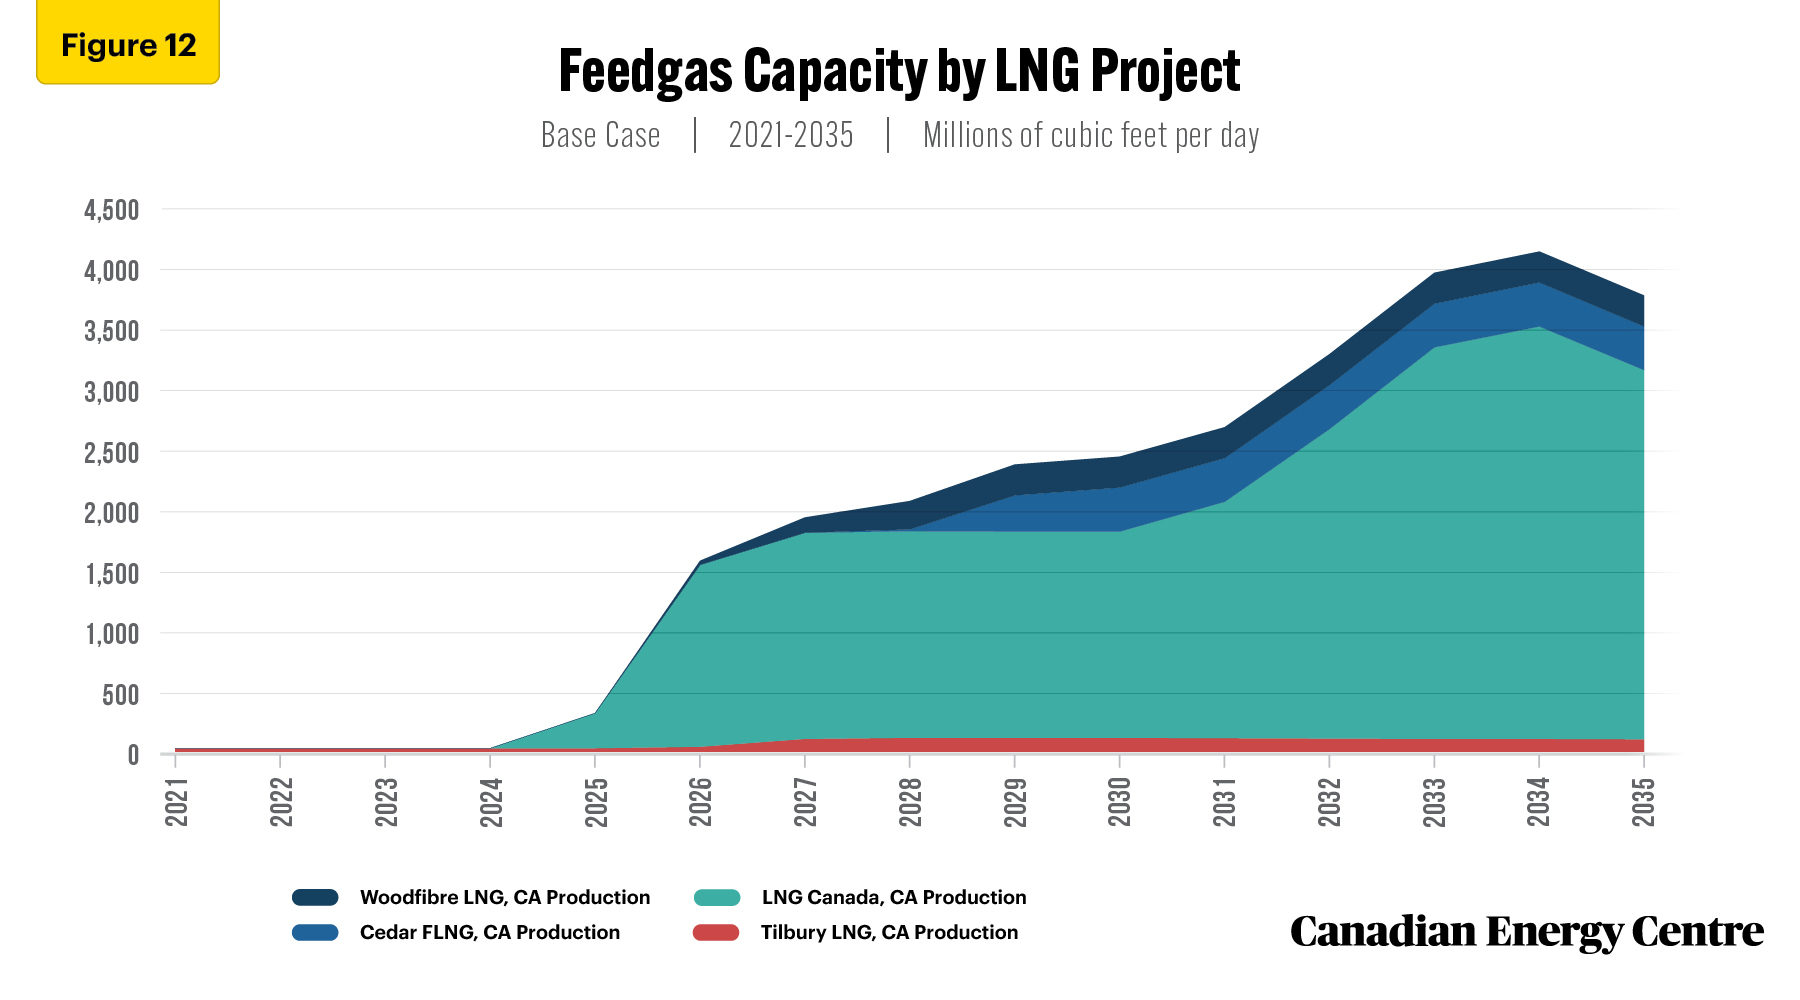
A 2025 startup for the LNG Canada 1 and 2 export facility could absorb up to 3.05 bcf/d of feedgas by the mid-2030s. Overall, if all major LNG projects in the planning stages were to go forward in Canada, feedgas production would increase from 0.032 bcf/d in 2021 to 2.44 bcf/d by 2030 and 3.77 bcf/d in 2035 (see Figure 12).
Source: Derived from the Rystad Energy GasMarketCube
The abundance of low-cost feedgas to supply west coast LNG projects, and the shorter shipping times to Asia, as compared to the U.S. Gulf Coast (USGC), offers Canadian LNG projects economic and emission advantages.
The LNG industry is still in its infancy in Canada and there is no infrastructure and liquefaction capacity at present to facilitate the export of LNG to Asia or Europe. There are at least seven major LNG export facilities at various development stages in Canada– LNG Canada, Goldboro LNG, Cedar LNG, Ksi Lisims LNG, Woodfibre LNG, and LNG Newfoundland and Labrador.
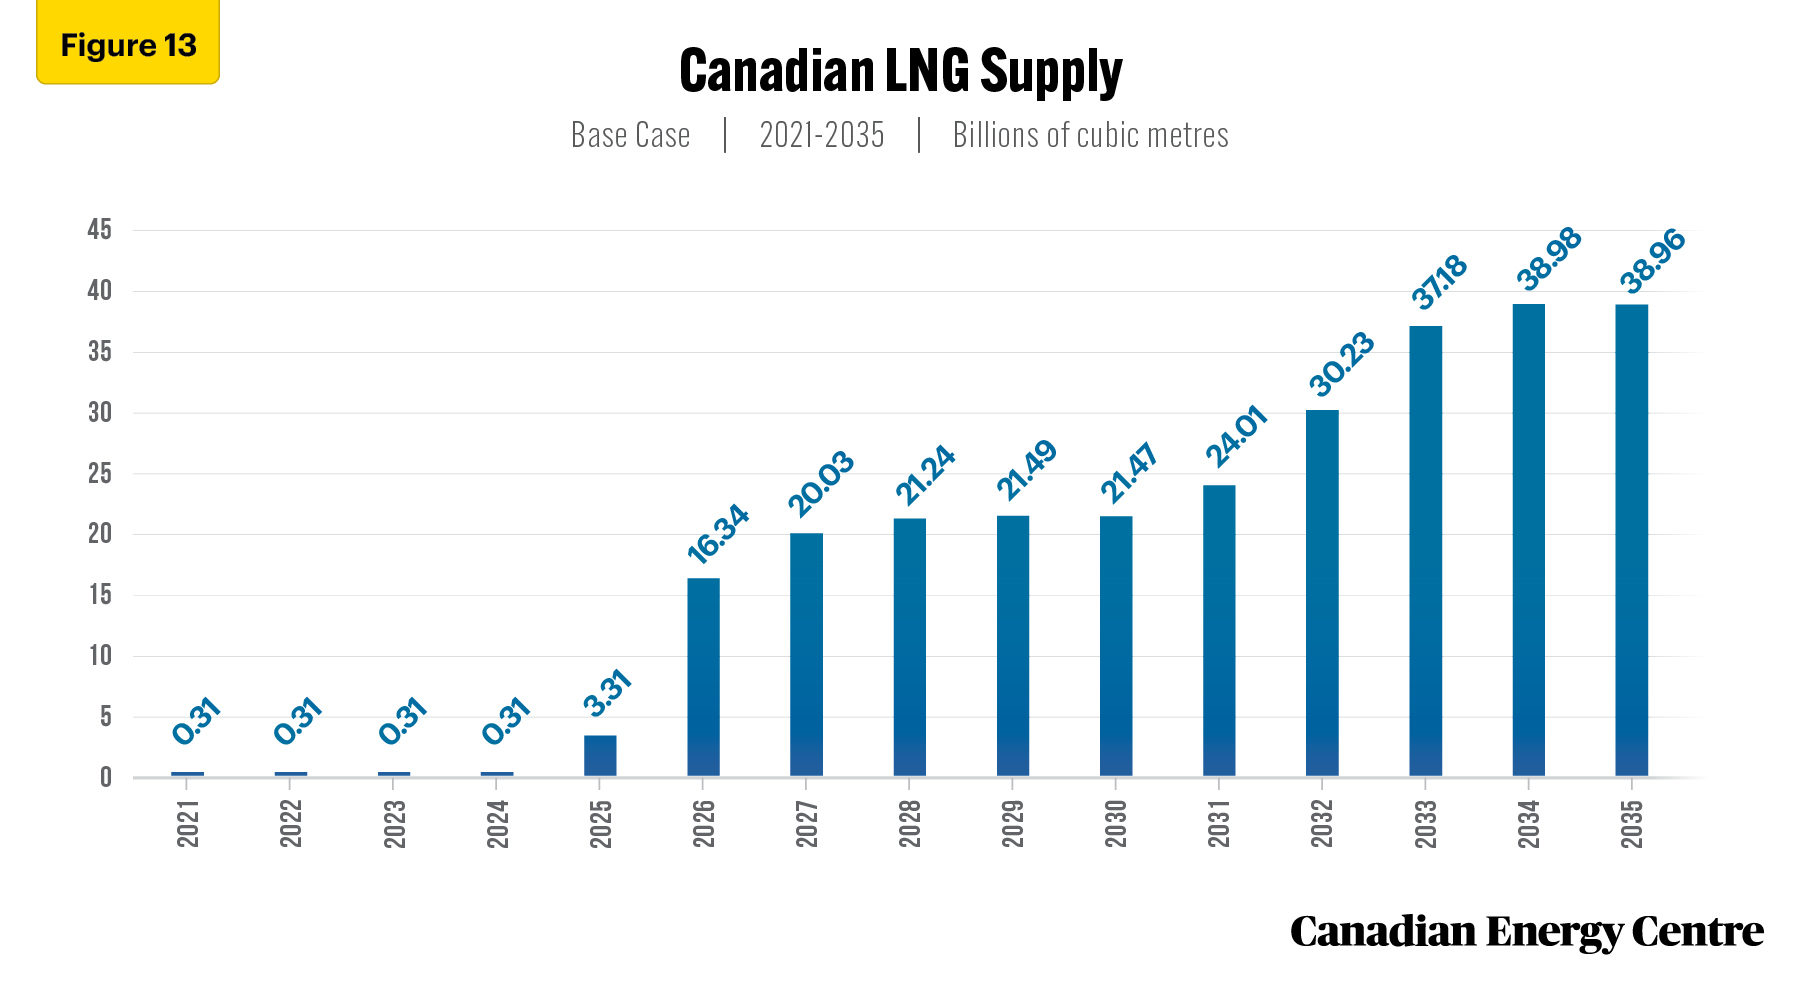
Under the Rystad Energy base case, LNG supply in Canada would begin by 2025 (at 3.31 bcm per year), rising to 38.98 bcm per year by 2034, before falling slightly to 38.96 bcm by 2035 (see Figure 13). Most of these volumes will go to Asia through the B.C. west coast, but some of Canada’s LNG could be sent to Europe by building transportation and liquefaction infrastructure on Canada’s east coast.
Source: Derived from the Rystad Energy GasMarketCube
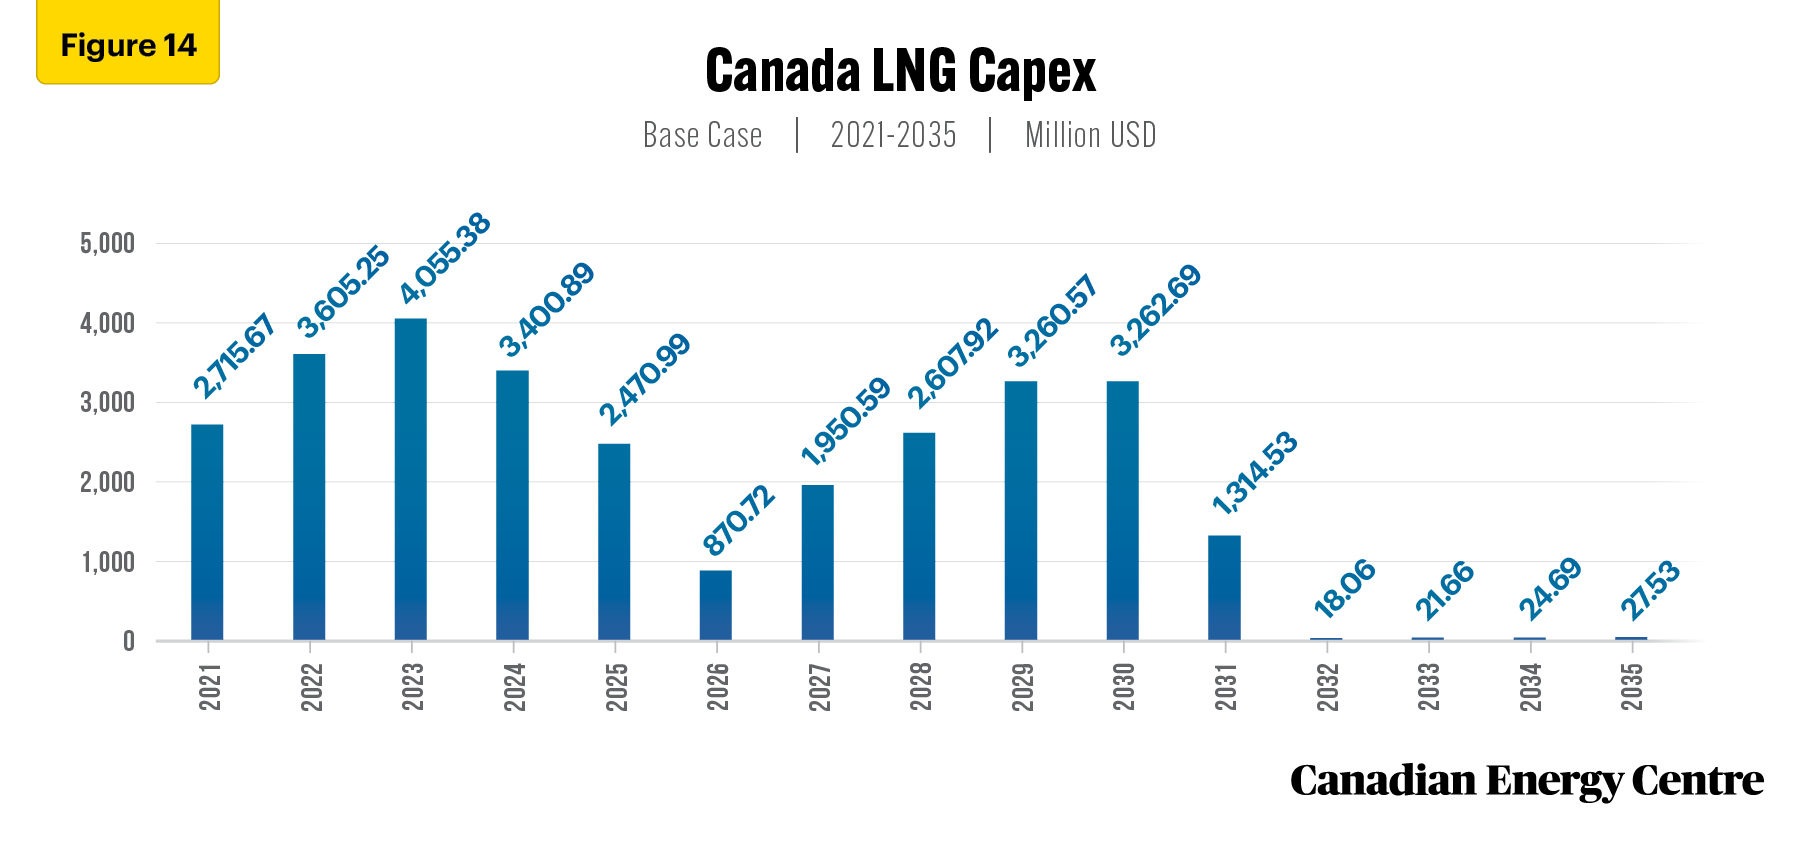
The growth in LNG production in Canada over the next decade and one half would require a significant increase in LNG investment. Figure 14 depicts total capital expenditures (capex) for LNG projects in Canada between 2021 and 2035. Cumulative LNG capex in Canada is estimated at over $29.6 billion between 2021 and 2035 (see Figure 14).
Source: Derived from the Rystad Energy GasMarketCube
A Canadian LNG project such as LNG Canada has natural advantages in ocean shipping and feedgas costs over the USGC, being around $1.00 per mmbtu lower on both. However, this is offset by higher pipeline transport and plant construction costs.
Canadian LNG may also have a role to play in balancing LNG markets over the medium-term. According to the latest Shell LNG Outlook, 2022:
An LNG supply-demand gap is forecast to emerge in the mid-2020s and focuses attention on the need for more investment to increase supply and meet rising LNG demand, especially in Asia. Switching to gas can significantly lower emissions: switching just 20% of coalfired power in Asia to gas can potentially save 680 mtpa of CO2 (Shell, 2022).
Conclusion
Natural gas will experience strength in world energy markets under NZE. As a lower emitting fuel, natural gas plays a critical role in meet rising global energy demand and reducing global emissions during the energy transition.
Future global gas demand can be supported by Canadian LNG projects expected to come on-line, beginning with LNG Canada in 2025.
With the high probability of present and future energy supply disruptions arising from geopolitical conflicts, Canada has an important role to play in balancing LNG markets.
With the inherent advantages of access to low cost feedgas, shorter shipping distances, and a low emissions intensity footprint, Canadian LNG is well positioned to act as a secure and reliable supplier of LNG to a world where demand for LNG is growing at rapid pace.
The rate at which the LNG industry evolves in Canada will depend on responsible fiscal and regulatory regimes at the federal and provincial level.
CEC Research Briefs
Canadian Energy Centre (CEC) Research Briefs are contextual explanations of data as they relate to Canadian energy. They are statistical analyses released periodically to provide context on energy issues for investors, policymakers, and the public. The source of profiled data depends on the specific issue. All percentages in this report are calculated from the original data, which can run to multiple decimal points. They are not calculated using the rounded figures that may appear in charts and in the text, which are more reader friendly. Thus, calculations made from the rounded figures (and not the more precise source data) will differ from the more statistically precise percentages we arrive at using the original data sources.
About the author
This CEC Research Brief was compiled by Lennie Kaplan, Executive Director of Research for the Canadian Energy Centre.
Acknowledgments and Notes
The author and the Canadian Energy Centre would like to acknowledge the assistance of Dennis Sundgaard and two anonymous reviewers.
References (Links live as of September 2, 2022)
Environment and Climate Change Canada. (2022). Canada publishes progress report towards 2025 methane emissions reduction target and launches consultations on 2030 target. <https://bit.ly/3xd1yfA>; Financial Post. (2022). Natural gas producers to face greatest burden under Trudeau’s climate plan. <https://bit.ly/3y6MKRP>; Forbes. (2021). Carbon-Neutral LNG: Another Reason Why Natural Gas Could Win ‘The Energy Transition. <https://bit.ly/3LBX8F1>; McKinsey and Company. (2021). The impact of decarbonization on the gas and LNG industry. <https://mck.co/3F2VKsA>; Rystad Energy. (2021). Canada seeks to re-enter global LNG race with focus on First Nation involvement. <https://bit.ly/3krikBS>; Rystad Energy. (2022a). Energy Transition Risk. <https://bit.ly/3LEk6eE>; Rystad Energy. (2022b). GasMarketCube. <https://bit.ly/3vfs1K1>; Rystad Energy UCube. (2022c). <https://bit.ly/3veaMIV>; Rystad Energy. (2022d). The new center of the LNG universe. <https://bit.ly/3krikBS>.
Creative Commons Copyright
Research and data from the Canadian Energy Centre (CEC) are available for public usage under creative commons copyright terms with attribution to the Canadian Energy Centre. Attribution and specific restrictions on usage including non-commercial use only and no changes to the material should follow guidelines enunciated by Creative Commons here: Attribution-NonCommercial-NoDerivs CC BY-NC-ND.