Social
To sign up to receive the latest Canadian Energy Centre research to your inbox email: research@canadianenergycentre.ca
Download the PDF here
Download the charts here
Overview
The federal government, through Environment and Climate Change Canada (ECCC), has recently released a discussion paper on options to cap and cut oil and gas greenhouse gas (GHG) emissions to achieve net zero emissions (NZEs) by 2050.
However, the ECCC discussion paper provides no economic risk analysis of the impact on oil and gas sector free cash flow, capex, government take and net present value, arising from the two options it presents to get the oil and gas sector to NZE 2050.
Quantifying the impact of the energy transition or NZE on Canada’s upstream oil and gas sector is critical for business planning. Companies and governments must be able to identify, assess and manage risk presented by NZE.
Companies are then able to mitigate risk through the adoption of low emissions technology such as CCUS, blue and green hydrogen, capture of methane gas, and leak detection and quantification (LDAR), among others. Governments are able to respond to risks by establishing appropriate fiscal and regulatory instruments to incent private sector investment in these low emissions technologies.
In this CEC Fact Sheet, we use data drawn from the Rystad Energy Upstream Energy Transition Risk Dashboard to assess the energy transition or NZE risk for the Canadian upstream oil and gas sector. We explain and evaluate the impact of NZE for Canada’s upstream oil and gas sector by quantifying how much of the sector’s valuation might be at risk if global energy markets shift from an OPEC scenario to an IEA Net Zero Emissions (NZE) pathway.
The written content in this report was prepared by the Canadian Energy Centre (CEC) and does not represent the views of Rystad Energy.
Background on Rystad Energy UCube and the Upstream Energy Transition Risk Dashboard
Rystad Energy is an independent energy research company providing data, analytics and consultancy services to clients around the globe.
UCube is Rystad Energy’s global upstream database, including production and economics (costs, revenues, and valuations) for more than 80,000 assets, covering the portfolios of more than 3,500 companies.
The UCube data set is used to study all parts of the global exploration and production (E&P) activity value chain, including operational costs, investment (capex and opex), fiscal terms, and net cash flows for projects and companies, both globally and by country.
Through the Upstream Energy Transition Risk Dashboard, Rystad Energy has developed methods to quantify energy transition risk across energy producers and energy service companies, utilizing a bottom-up approach to decompose transition risk down to single asset, products and services lines. The focus is on value at risk, utilizing an asset-based valuation framework to run alternative future scenarios on energy demand, energy prices and emission costs (Rystad Energy, 2022a).
Explaining the energy transition scenarios
Energy transition risk analysis is based on six energy transition scenarios, namely Sigma+, Sigma-, Mean, OPEC, Announced Pledges Scenario (APS), and IEA Net Zero Emissions (NZE). Each scenario has different speeds of energy transition. For the upstream oil and gas sector in Canada, the difference between the scenarios leads to both resource risk and value risk (Rystad Energy, 2022c).
- The OPEC scenario sees global oil demand increase by 17.6 million barrels per day (mbpd) between 2020 and 2045, rising from 90.6 mbpd in 2020 to 108.2 mbpd in 2045
- The Sigma+ scenario limits global temperature rise to 2 degrees C. Oil demand peaks in 2028 at 106 mbpd and declines to 74 mbpd in 2050
- The Mean scenario limits global temperature rise to 1.8 degrees C. Oil demand peaks at 104 mbpd in 2025 and declines to 51 mbpd in 2050.
- Announced Pledges Scenario (APS): Oil demand peaks at 102 mbpd in 2028 and declines to 83 million mbpd in 2050.
- The Sigma- scenario limits global temperature rise to 1.6 degrees C. Oil demand peaks at 102 mbpd in 2024 and falls to 33 mbpd in 2050
- The IEA NZE or NZE scenario sees the global energy sector attain net zero emissions by 2050. Global temperature rise by 1.5 degrees C. Oil demand peaks at 91 mbpd in 2021 and them falls to 21 mbpd by 2050. This scenario is based on the projections for the global oil and gas sector as laid out in IEA Report, Net Zero by 2050, May 2021 (Rystad Energy 2022b).
In this analysis, we evaluate Canadian upstream oil and gas sector transition risk as the difference between the OPEC scenario and the IEA NZE scenario for key value risk and cost risk metrics.
Free cash flow (FCF) at risk
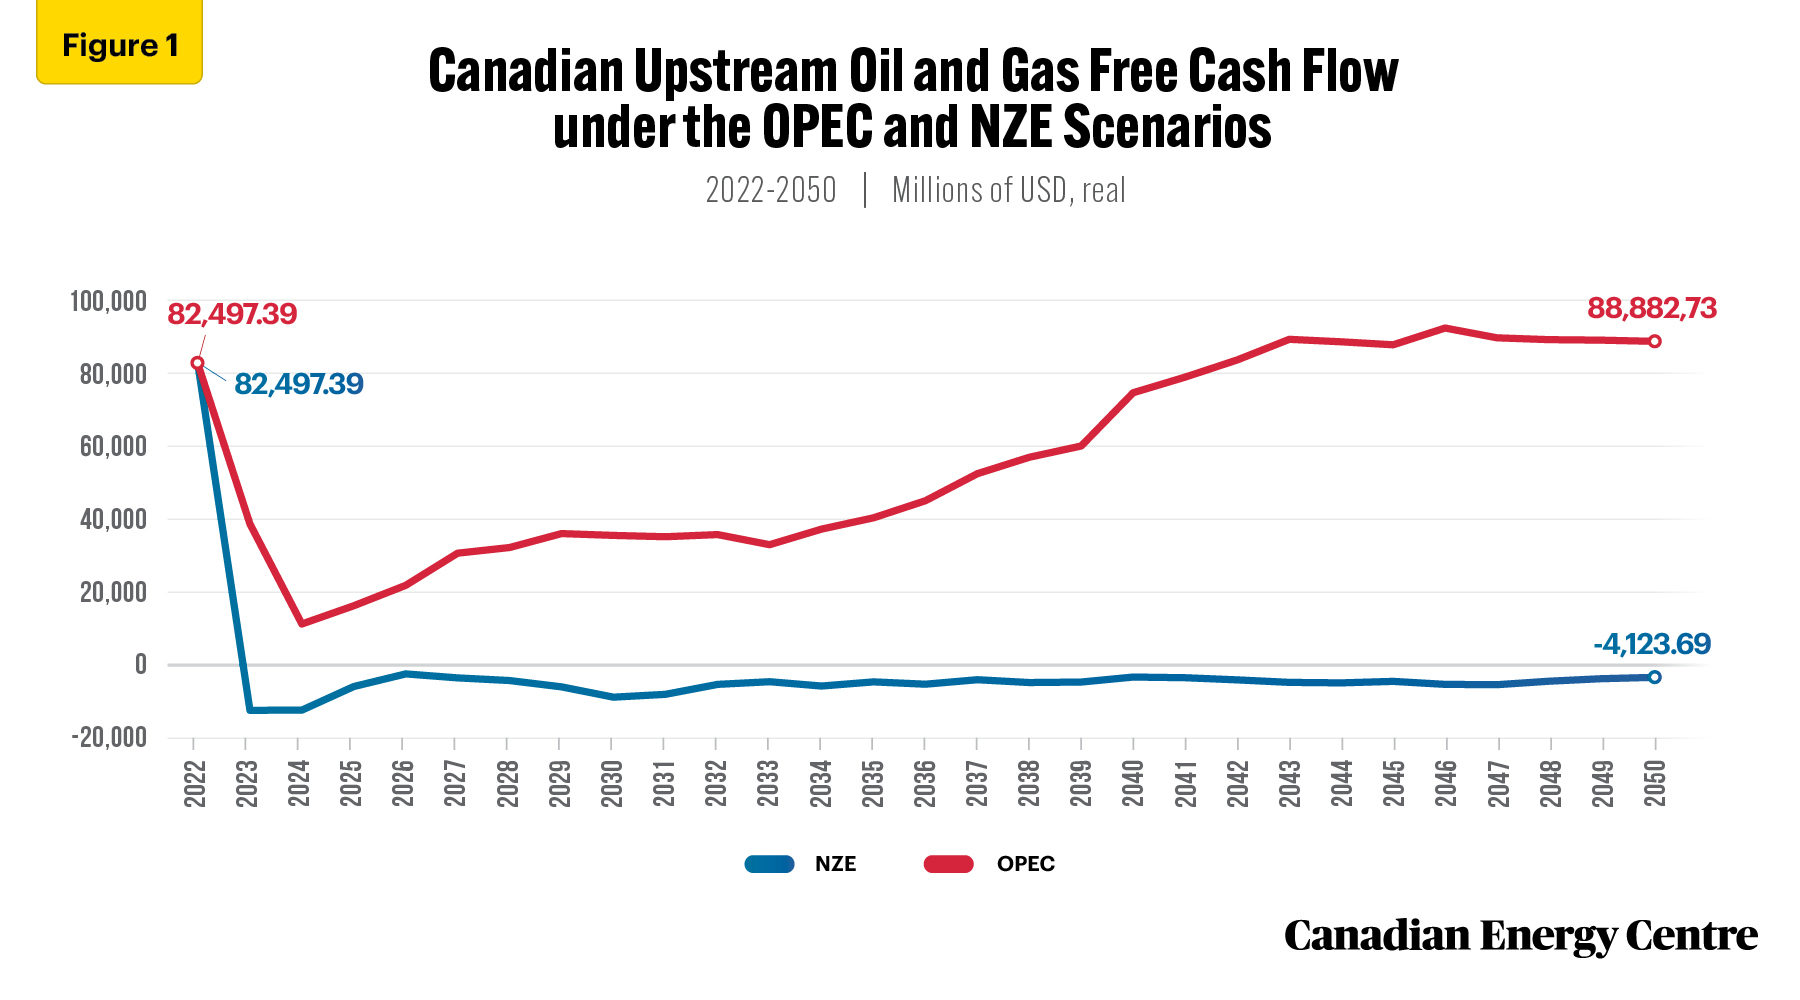
Free cash flow (FCF) represents the cash flow the Canadian upstream oil and gas sector generates after accounting for cash outflows to support operations and maintain capital assets. The value at risk for the upstream oil and gas sector can be assessed by examining the reduction in the net present value (NPV) of future FCF between the OPEC scenario and the IEA NZE scenario.
Total free cash flow (FCF) generated by the Canadian upstream oil and gas sector in 2022 is projected at $82.5 billion (USD, real). Going forward, under the OPEC scenario, Canadian upstream oil and gas sector FCF reaches nearly $88.9 billion by 2050. On the other hand, under the IEA NZE scenario, Canadian upstream oil and gas sector FCF declines and is negative $4.1 billion by 2050 (see Figure 1).
On a cumulative basis, between 2022 and 2050, approximately $2.2 trillion of Canadian upstream oil and gas FCF is at risk under IEA NZE.
Source: Derived from the Rystad Energy Upstream Energy Transition Risk Dashboard
Net present value (NPV) at risk
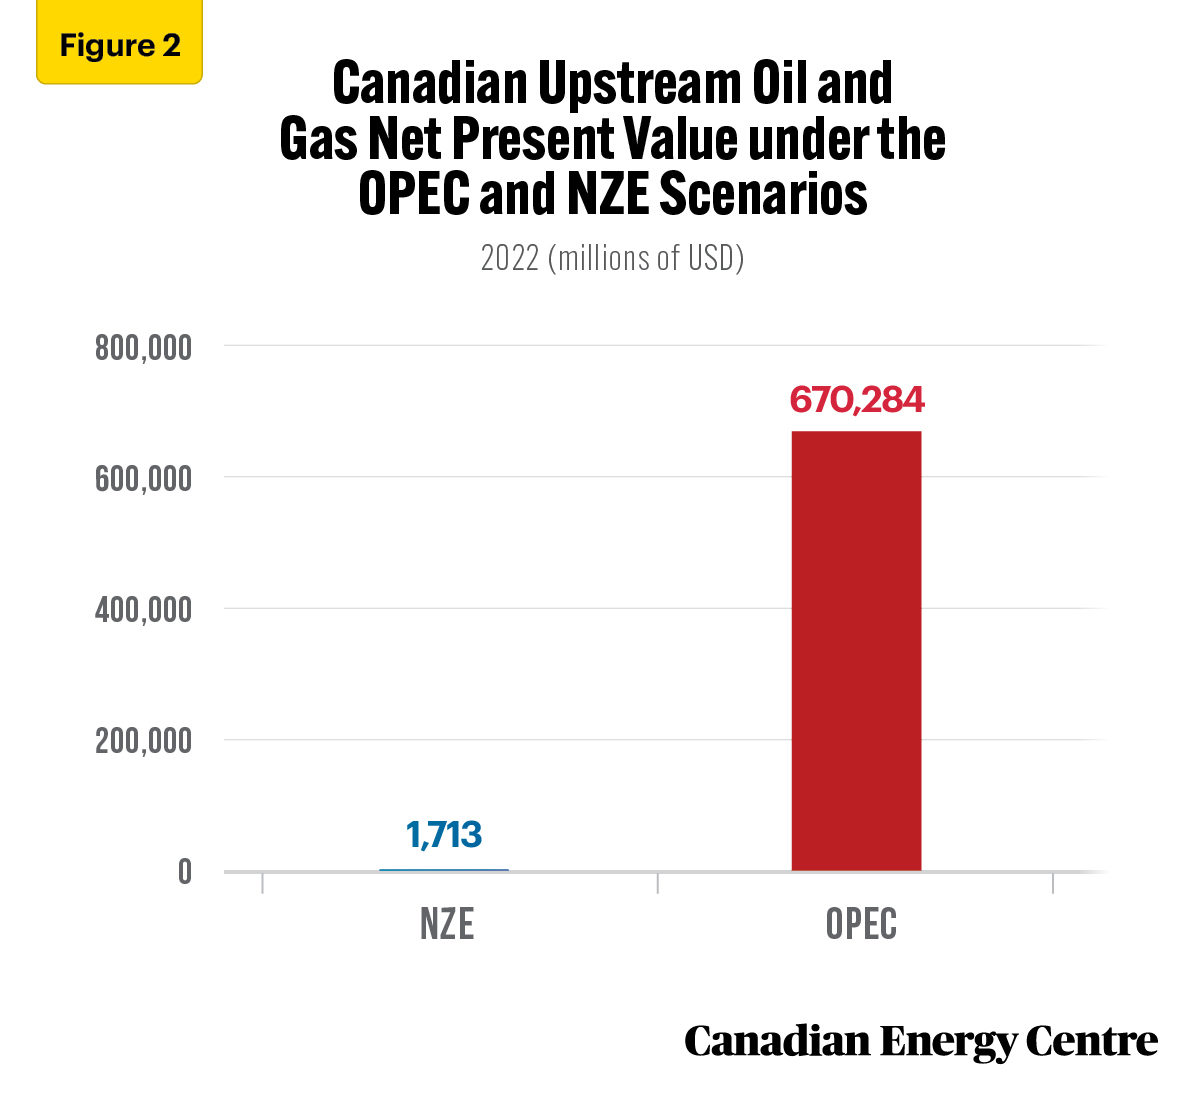
Net present value (NPV) is the difference between the present value of cash inflows for the upstream oil and gas sector and the present value of cash outflows over a period of time.
NPV is used in capital budgeting and investment planning to analyze the profitability of a projected oil and gas investment or project. NPV is the result of calculations used to find today’s value of a future stream of payments.
If the NPV of an oil and gas project or investment is negative, it means that the discounted present value of all future cash flows related to that project or investment will be negative, and therefore unattractive. In this risk analysis, the NPV calculations assume a 10 per cent discount rate.
Under the OPEC scenario, NPV for the Canadian upstream oil and gas sector is $670.3 billion (USD). Under the IEA NZE scenario, NPV for the upstream oil and gas sector is just $1.7 billion (see Figure 2).
In this risk analysis, the difference in NPV between the OPEC scenario is $668.6 billion under the IEA NZE scenario represents the Canadian upstream oil and gas sector NPV at risk.
Source: Derived from the Rystad Energy Upstream Energy Transition Risk Dashboard
Capital expenditures (Capex) at risk
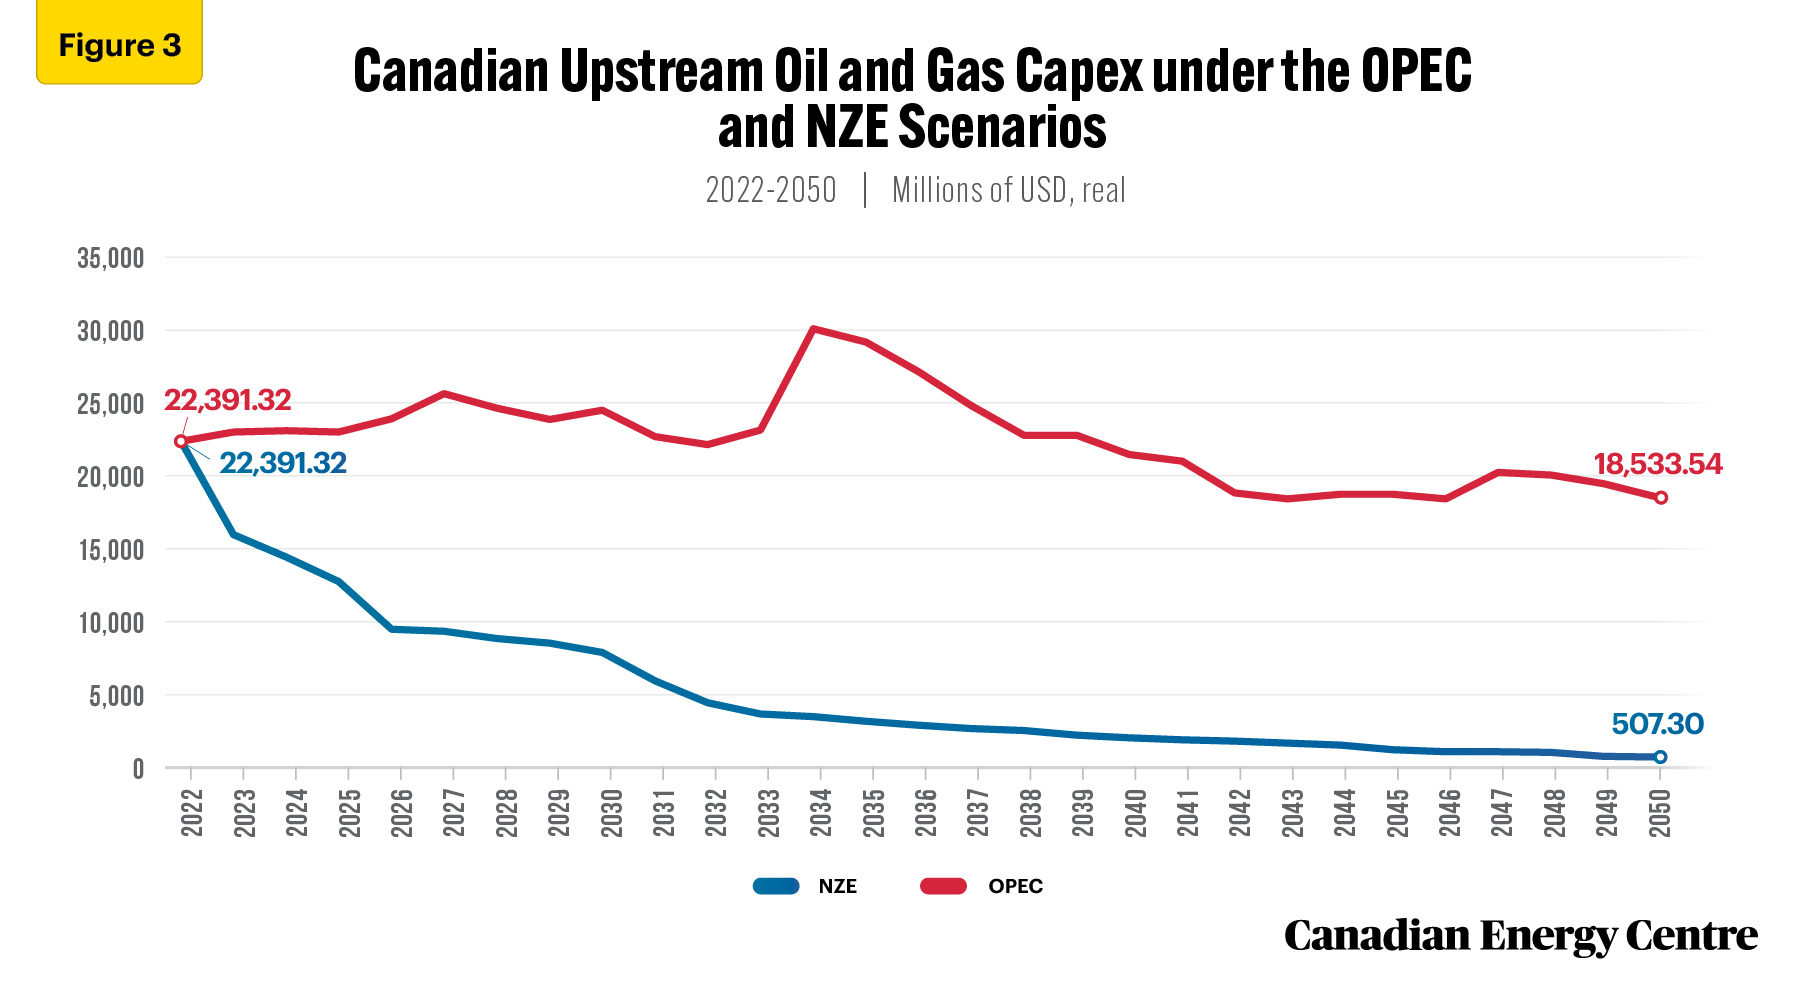
The capital expenditures (capex) risk for the Canadian upstream oil and gas sector is defined as the cumulative reduction in capex between the OPEC and the IEA NZE scenarios.
Under the OPEC scenario, upstream oil and gas capex grows from $22.4 billion (USD, real) in 2022 to $30.4 billion in 2034, before declining to $18.5 billion in 2050. Under the IEA NZE scenario, upstream oil and gas investment falls from $22.4 billion in 2022 to $507.3 million in 2050 (see Figure 3).
On a cumulative basis, between 2022 and 2050, $503.4 billion of Canadian upstream oil and gas sector capex is at risk under the IEA NZE scenario.
Source: Derived from the Rystad Energy Upstream Energy Transition Risk Dashboard
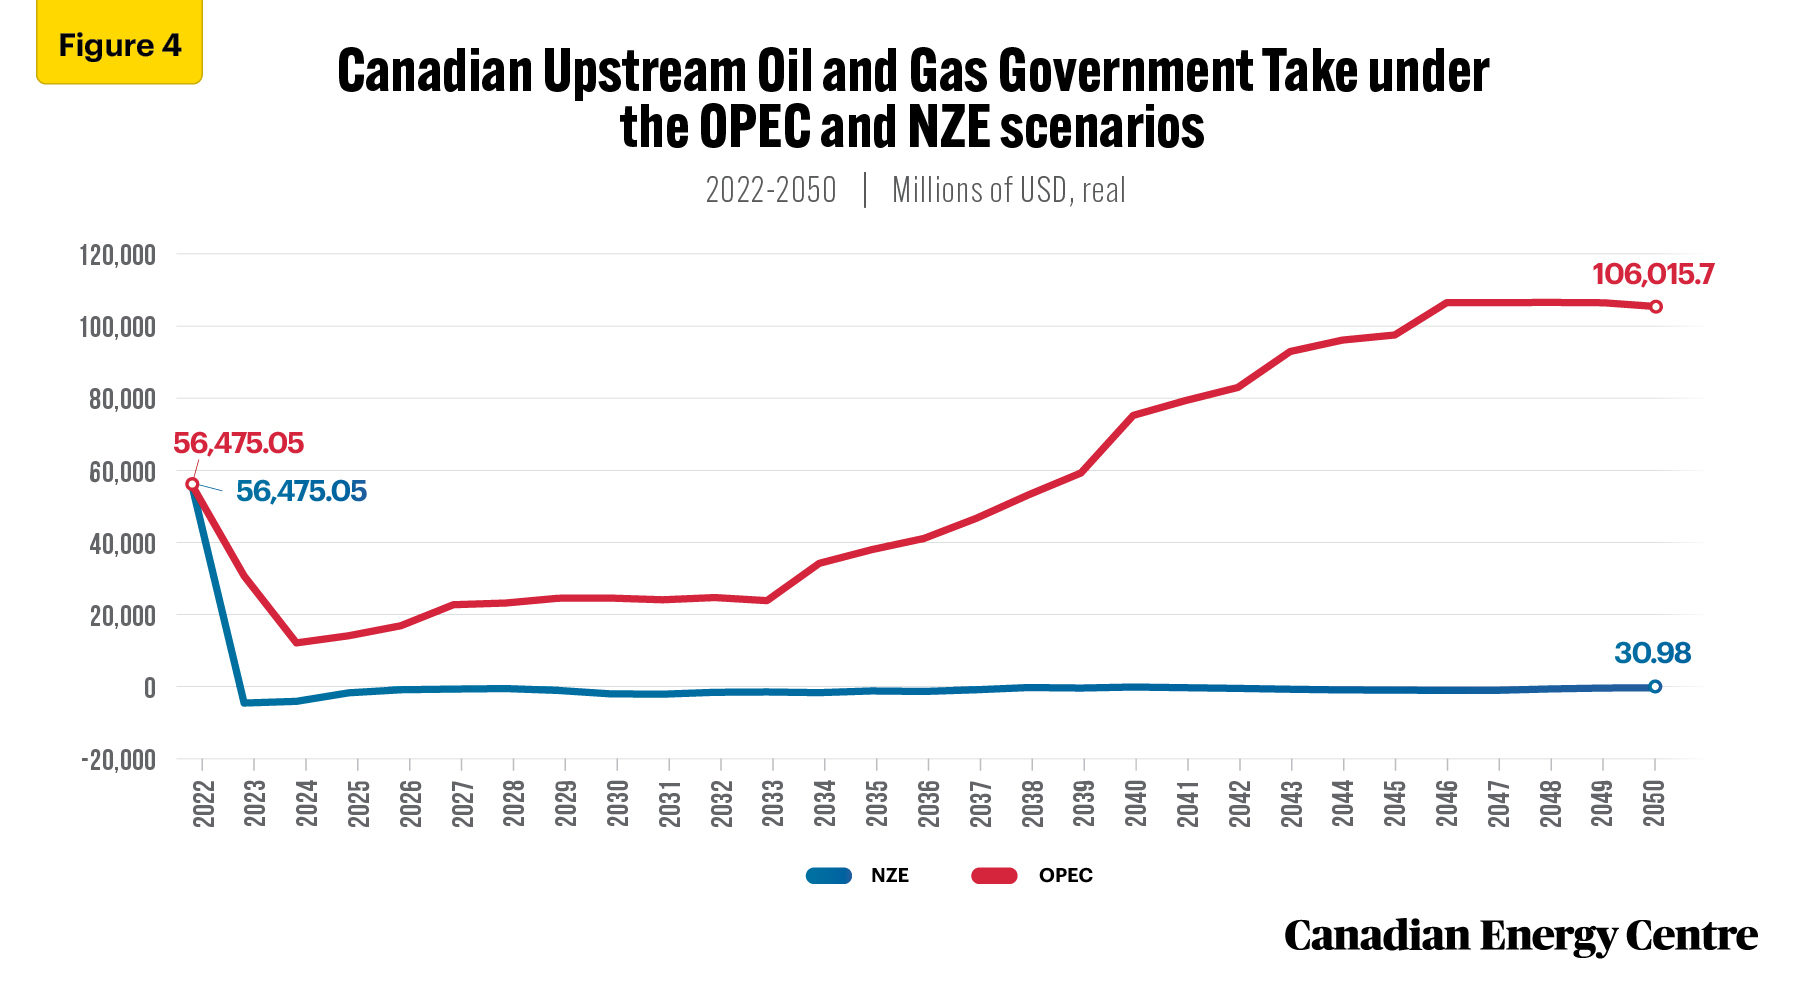
Government take at risk
Government take is defined as upstream oil and gas revenues received by federal and provincial governments from income taxes, royalties and bonuses.
The government take risk for the upstream oil and gas sector is thus the cumulative reduction in government take from 2022 through 2050, between the OPEC and the IEA NZE scenarios.
Under the OPEC scenario, Canadian upstream oil and gas government take grows from $56.5 billion (USD, real) in 2022 to $106.0 billion in 2050. On the other hand, under the IEA NZE scenario, Canadian upstream oil and gas government take falls from $56.5 billion in 2022 to $31 million in 2050 (see Figure 4).
On a cumulative basis, between 2022 and 2050, $1.6 trillion of Canadian upstream oil and gas sector government take is at risk under the IEA NZE scenario.
Source: Derived from the Rystad Energy Upstream Energy Transition Risk Dashboard
Conclusion
The Canadian upstream oil and gas sector is significantly exposed to energy transition or NZE risk under a global energy market shift from an OPEC scenario to an IEA NZE scenario.
The recent ECCC discussion paper on options to cap and cut oil and gas sector GHG emissions to achieve net zero by 2050 fails to acknowledge and disclose the extent of these risks for the Canadian upstream oil and gas sector.
Canadian upstream oil and gas companies are mitigating exposure to NZE risk through the adoption of such technologies as carbon capture and storage (CCUS); blue and green hydrogen; using solar panels to power pumps, eliminating the venting of emissions that result from traditional sources of power; installing systems at natural gas facilities designed to capture vented gases, including methane; using sophisticated modelling software to detect methane leaks from shale gas production, storage and transportation facilities, and oil sand; Leak Detection and Quantification (LDAR), equipment electrification or replacement, instrument air systems, and vapor-recovery units.
A fiscal and regulatory regime that is responsive to the adoption of these low emission technologies will be critical to mitigating the energy transition or NZE risk and preserving Canada’s role as a safe and secure supplier of crude oil and natural gas to a world that needs energy but faces increasing uncertainty of supply due to geopolitical conflicts.
Notes
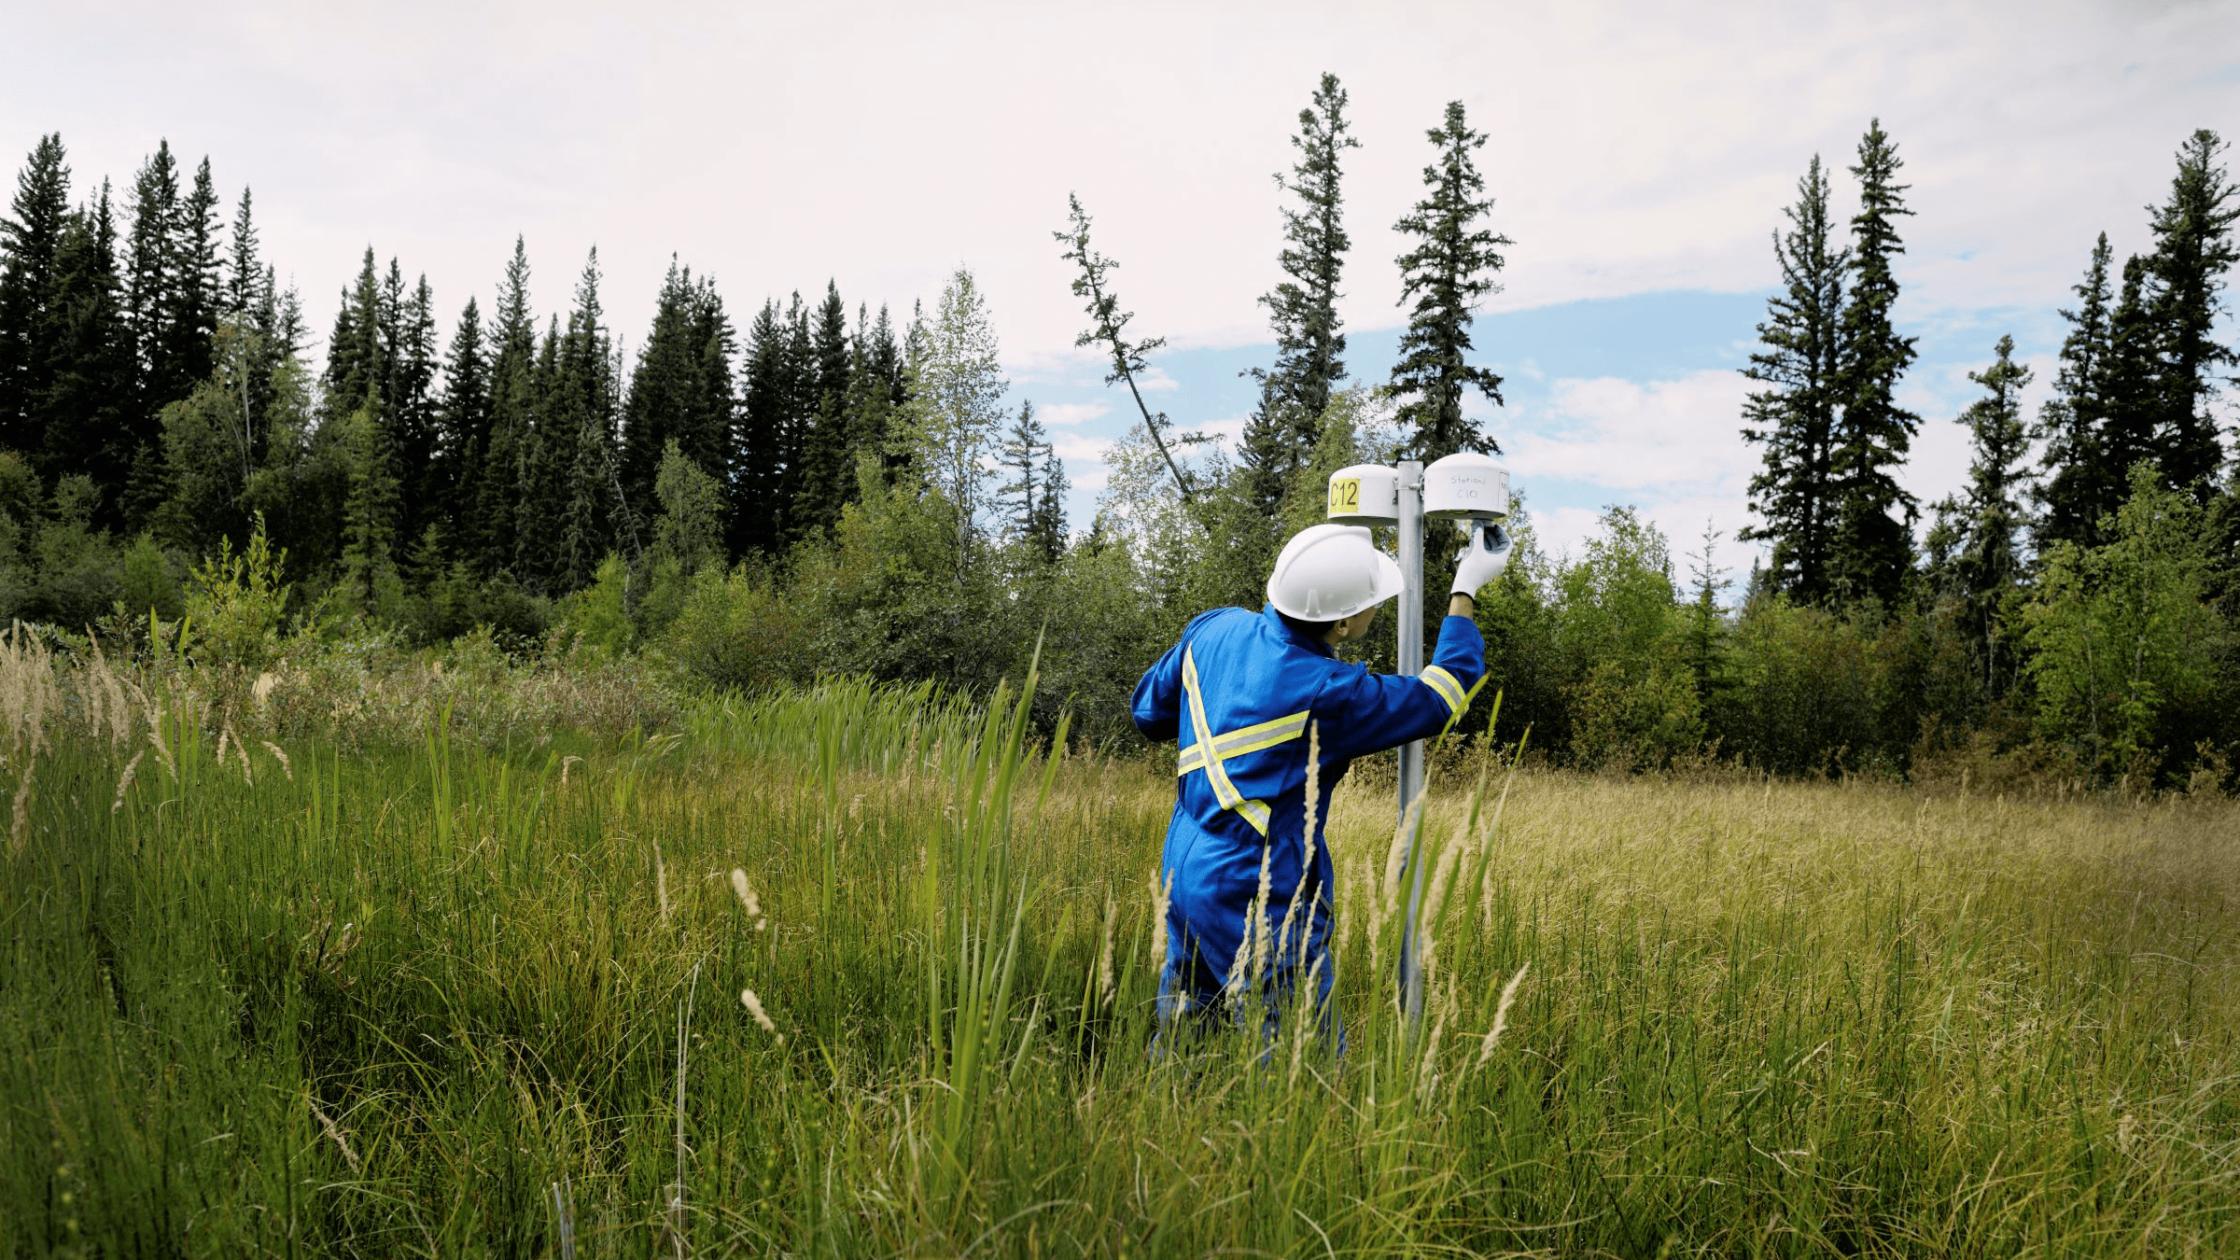
This CEC Fact Sheet was compiled by Lennie Kaplan at the Canadian Energy Centre (www.canadianenergycentre.ca). The author and the Canadian Energy Centre would like to thank and acknowledge the assistance of two anonymous reviewers in reviewing the data and research for this Fact Sheet. Image credits: Cenovus Energy.
The written content in this report was prepared by the Canadian Energy Centre (CEC) and does not represent the views of Rystad Energy.
References (all links live as of July 6, 2022)
R IEA. (2021). Net Zero by 2050. <https://bit.ly/3PaLNxW>; Rystad Energy. (2022a). Energy Transition Risk. <https://bit.ly/3LEk6eE>; Rystad Energy. (2022b). Upstream Energy Transition Risk Dashboard; Rystad Energy. (2022c). Energy Transition Risk for the Upstream Industry; Rystad Energy (2021a). Energy transition risk quantified: Long-term oil price risk worth $10 per barrel, E&P upstream portfolios’ value could dip 30-40%. <https://bit.ly/3LEk6eE>; Rystad Energy. (2021b). North American companies are the most exposed to energy transition risk. <https://bit.ly/3LEk6eE>; Rystad Energy. (2021c). Sizing the risk ahead: Quantifying the Energy Transition’s impact on the E&P sector. <https://bit.ly/3LEk6eE>; Rystad Energy. (2021d). The energy transition could cost $14 trillion in lost tax income. <https://bit.ly/3LEk6eE>; Rystad Energy. (2021e). Understanding the Energy Transition Risks Ahead. <https://bit.ly/3LEk6eE>; Rystad Energy. (2021f). Upstream Energy Transition Risk Special Report. <https://bit.ly/3LEk6eE>; Rystad Energy. (2021g). Upstream Energy Transition Risk Special Report. <https://bit.ly/3LEk6eE>.
Creative Commons Copyright
Research and data from the Canadian Energy Centre (CEC) is available for public usage under creative commons copyright terms with attribution to the CEC. Attribution and specific restrictions on usage including non-commercial use only and no changes to material should follow guidelines enunciated by Creative Commons here: Attribution-NonCommercial-NoDerivs CC BY-NC-ND.