
Social
To sign up to receive the latest Canadian Energy Centre research to your inbox email: research@canadianenergycentre.ca
Download the PDF here
Download the charts here
Introduction
Despite their geographic distance from one another, Canada and Australia have key similarities. Both countries have relatively small populations in relation to their land mass. The economies of both countries are bolstered by trade, particularly the export of energy products such as crude oil, natural gas, and LNG.
The Canadian and Australian oil and gas extraction sectors¹ are important drivers of economic growth and employment, traditionally in Canada and more recently in Australia.
In this CEC Fact Sheet, we assess trends in the performance of the oil and gas sector in Canada and Australia over the past decade based on a number of key metrics: investment, employment, gross domestic product (GDP), and government revenues.
Highlights:
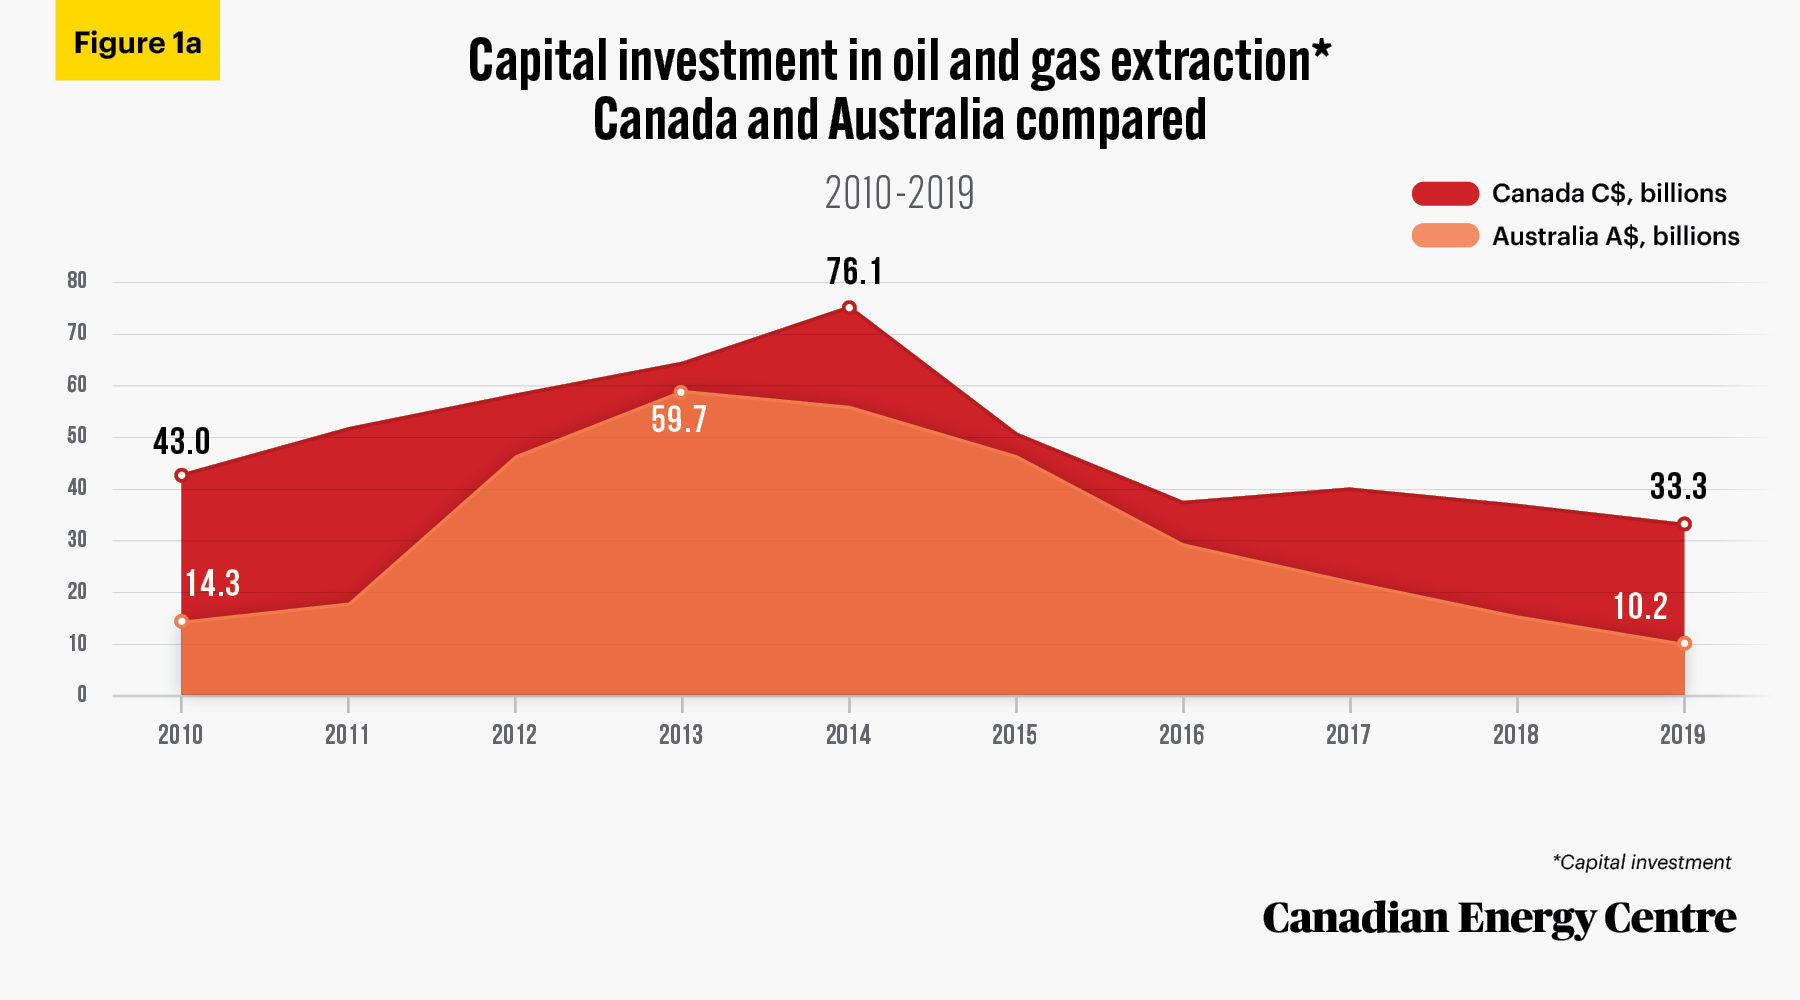
• Both countries have experienced a severe decline in capital investment: Australia’s decline was from a high of $56.6 billion in 2014 to a low of $10.2 billion in 2019; Canada’s decline was from a high of $41.6 billion in 2014 to a low of $33.3 billion in 2019.
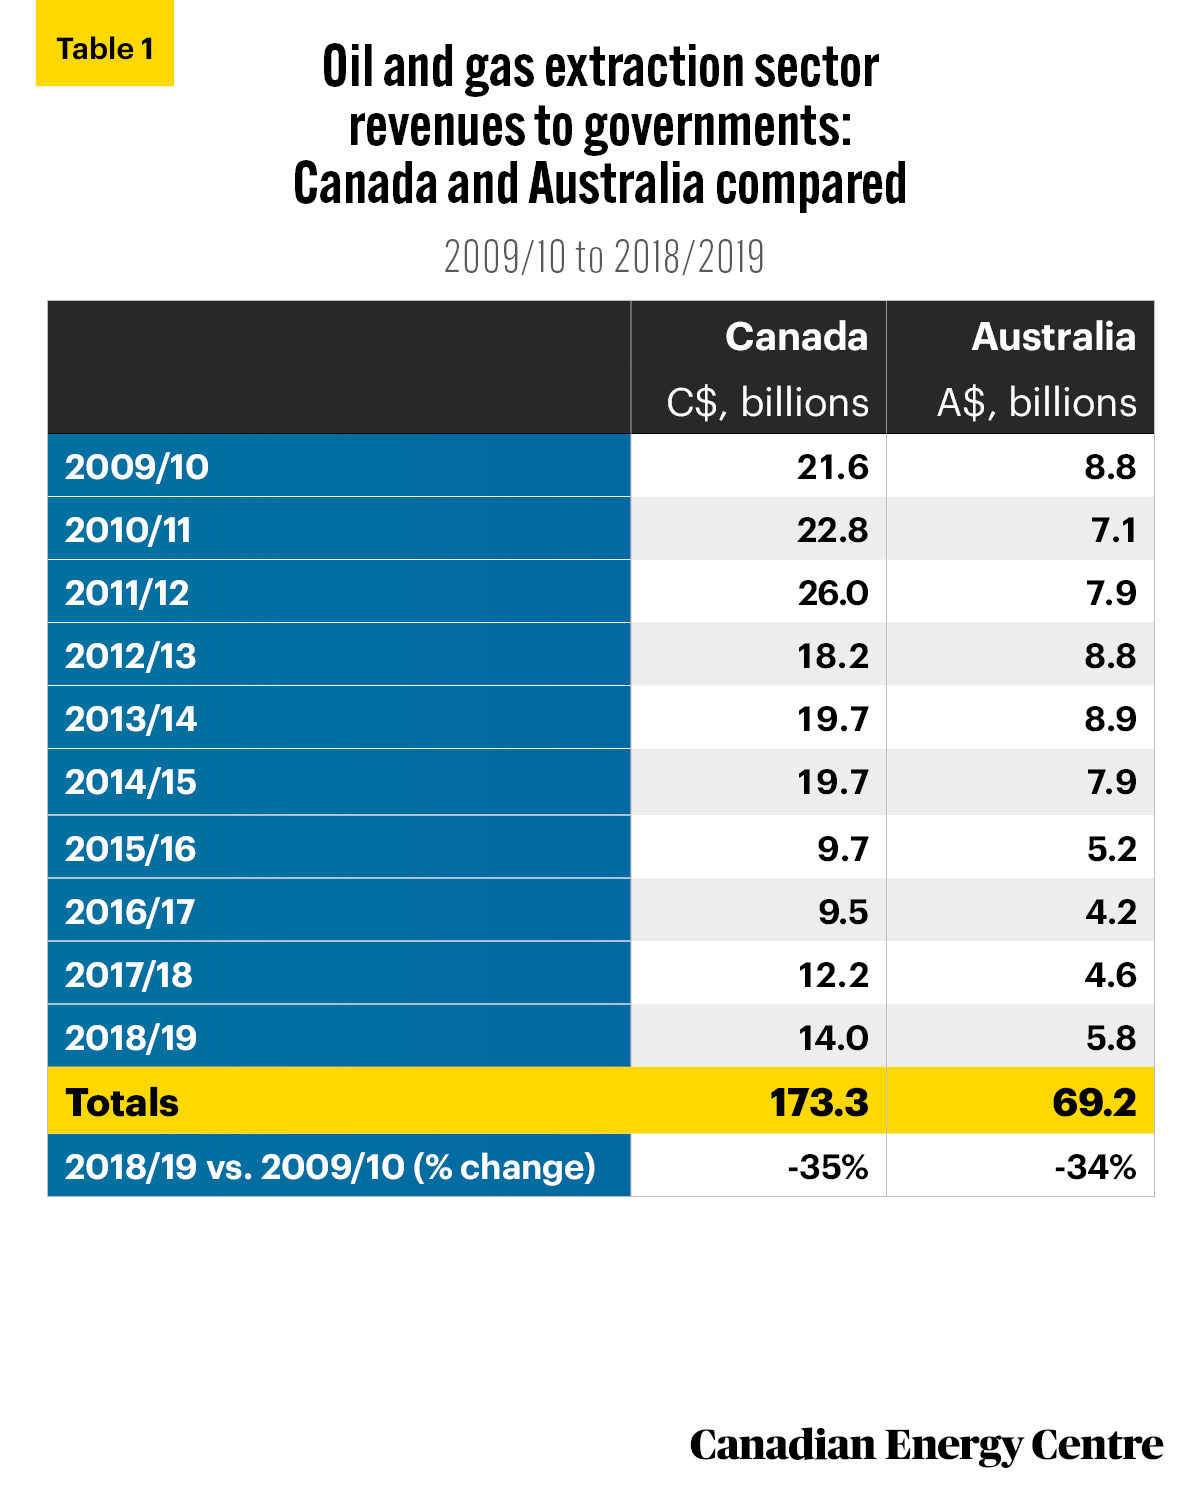
• Revenues to government from the oil and gas extraction sector faced similar declines in both countries, with revenues decreasing by 35 per cent in Canada and 34 per cent in Australia between 2009/10 and 2018/19.
• Unlike Australia, medium- to long-term prospects for investment in the Canadian oil and gas extraction sector are tempered not only by low energy prices and COVID-19, but also by concerns around lack of market access and a less than favourable regulatory regime.
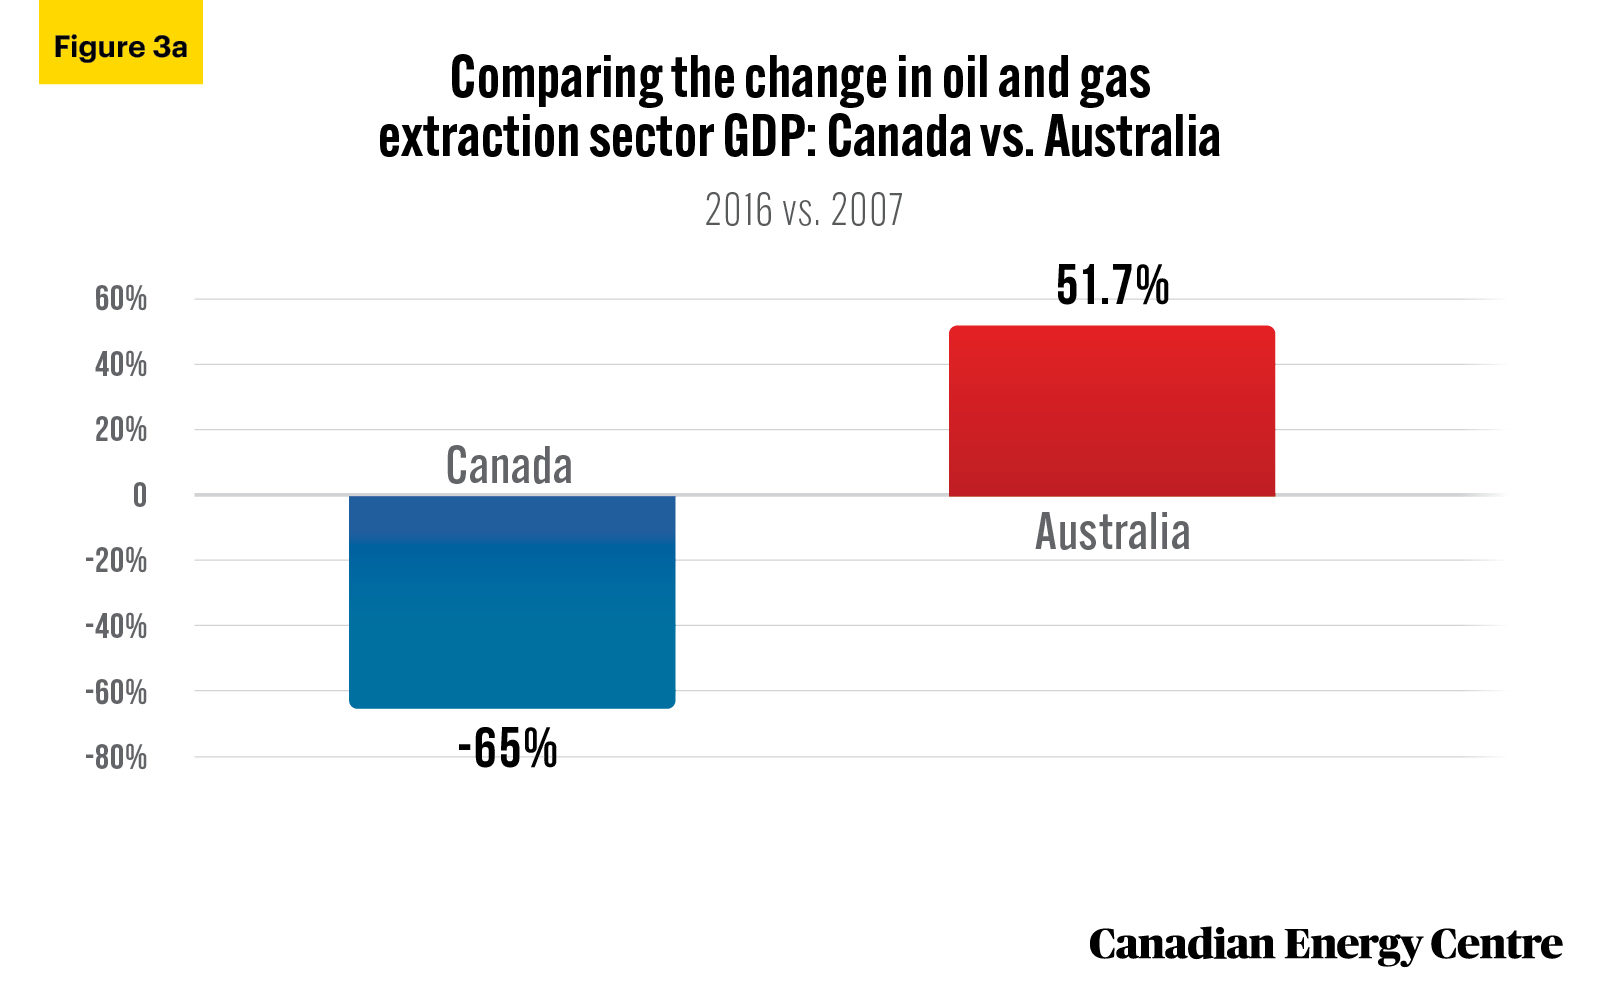
• The two countries diverge dramatically on GDP for oil and gas extraction. When the 2007 to 2016 period is examined (the decade for which the latest data is available) Australia’s oil and gas extraction sector GDP rose by 51.7 per cent while Canada’s oil and gas extraction sector GDP fell by 65.0 per cent.
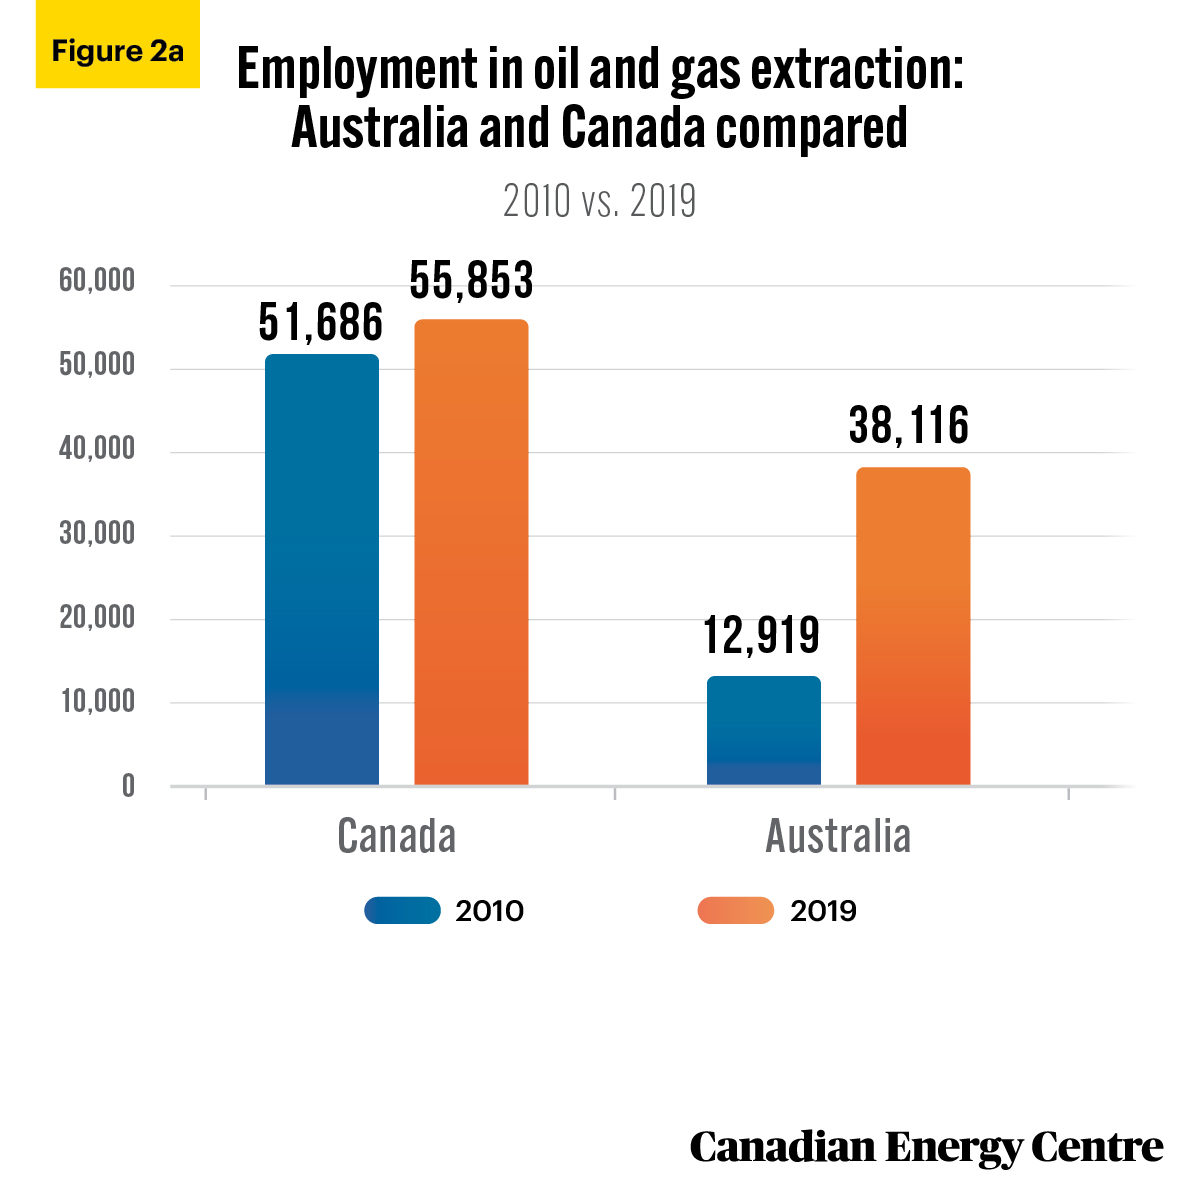
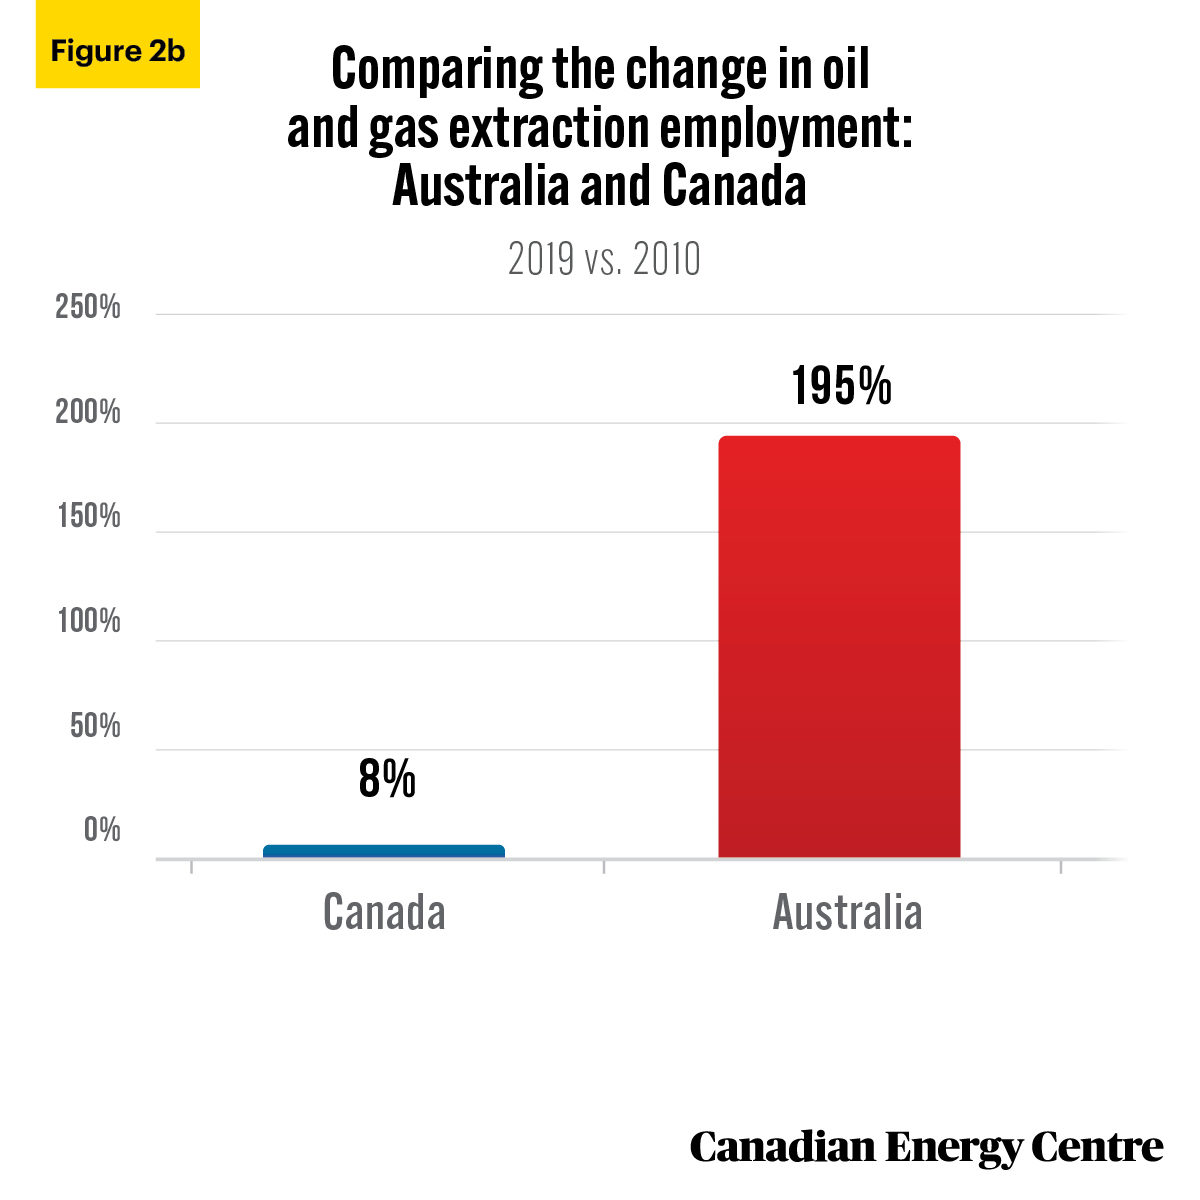
• Employment in the oil and gas extraction sector also diverged. Australia’s oil and gas sector extraction employment was 12,919 in 2010 and 38,116 in 2019, a 195 per cent increase; Canada’s oil and gas sector extraction employment was 51,686 in 2010 and 55,853 in 2019, an increase of just 8 per cent.
1. The oil and gas extraction sector in Australia consists of units mainly engaged in producing crude oil, natural gas or condensate through the extraction of oil and gas deposits including liquefied natural gas production, natural gas extraction, oil shale mining and petroleum gas extraction (Australian Bureau of Statistics, 2020a). The oil and gas extraction sector in Canada comprises establishments primarily engaged in operating oil and gas field properties. Such activities may include exploration for crude petroleum and natural gas drilling, completing and equipping wells; operating separators, emulsion breakers, desilting equipment and field gathering lines for crude petroleum; and all other activities in the preparation of oil and gas up to the point of shipment from the producing property (Industry Canada, 2020).
Oil and gas sector overview
Australia
According to the analytical firm Wood Mackenzie, Australia’s upstream oil and gas industry “experienced an unprecedented wave of investment and activity through the early 2010s.” Investment included multiple greenfield LNG projects with most starting production in recent years. Wood Mackenzie notes that the sheer scale of investment yielded substantial economic benefits including “increased local employment, industrial activity to service construction and engineering tenders, and infrastructure build-out, alongside the inevitable trickle-down effect of the investment.
The firm notes that the “economics of large-scale LNG projects that typify Australian oil and gas show that the lion’s share of direct economic benefit in the form of royalty and corporate income tax is expected to be accrued in the latter half of the 2020s.”
Canada
Analytical firm PricewaterhouseCoopers (pwc) Canada notes that 10 years ago, Canada’s oil and gas industry was recovering from the 2008 global financial crisis with immediate concerns being “weakened commodity prices, high supply costs misaligned with current prices and disrupted capital markets … increasing regulatory uncertainty, the need for new export pipelines and growing public scrutiny of environmental performance.”
As pwc points out, those challenges, increased market access issues and a collapse of oil prices in late 2014 together resulted in cancellation or delays of C$160 billion in proposed expansion projects. In 2019, pwc characterized the Canadian oil and gas industry as at an “inflection point” where its “technological advantage could erode as investment falls.”
Supply costs in Canada have since dropped significantly. For example, according to IHS Markit, as of 2019, the cost to construct a new oil sands project dropped by up to one-third compared to 2019. Yet, investment continues to decline due to market access challenges and environmental pressures.
Investment²
Australia
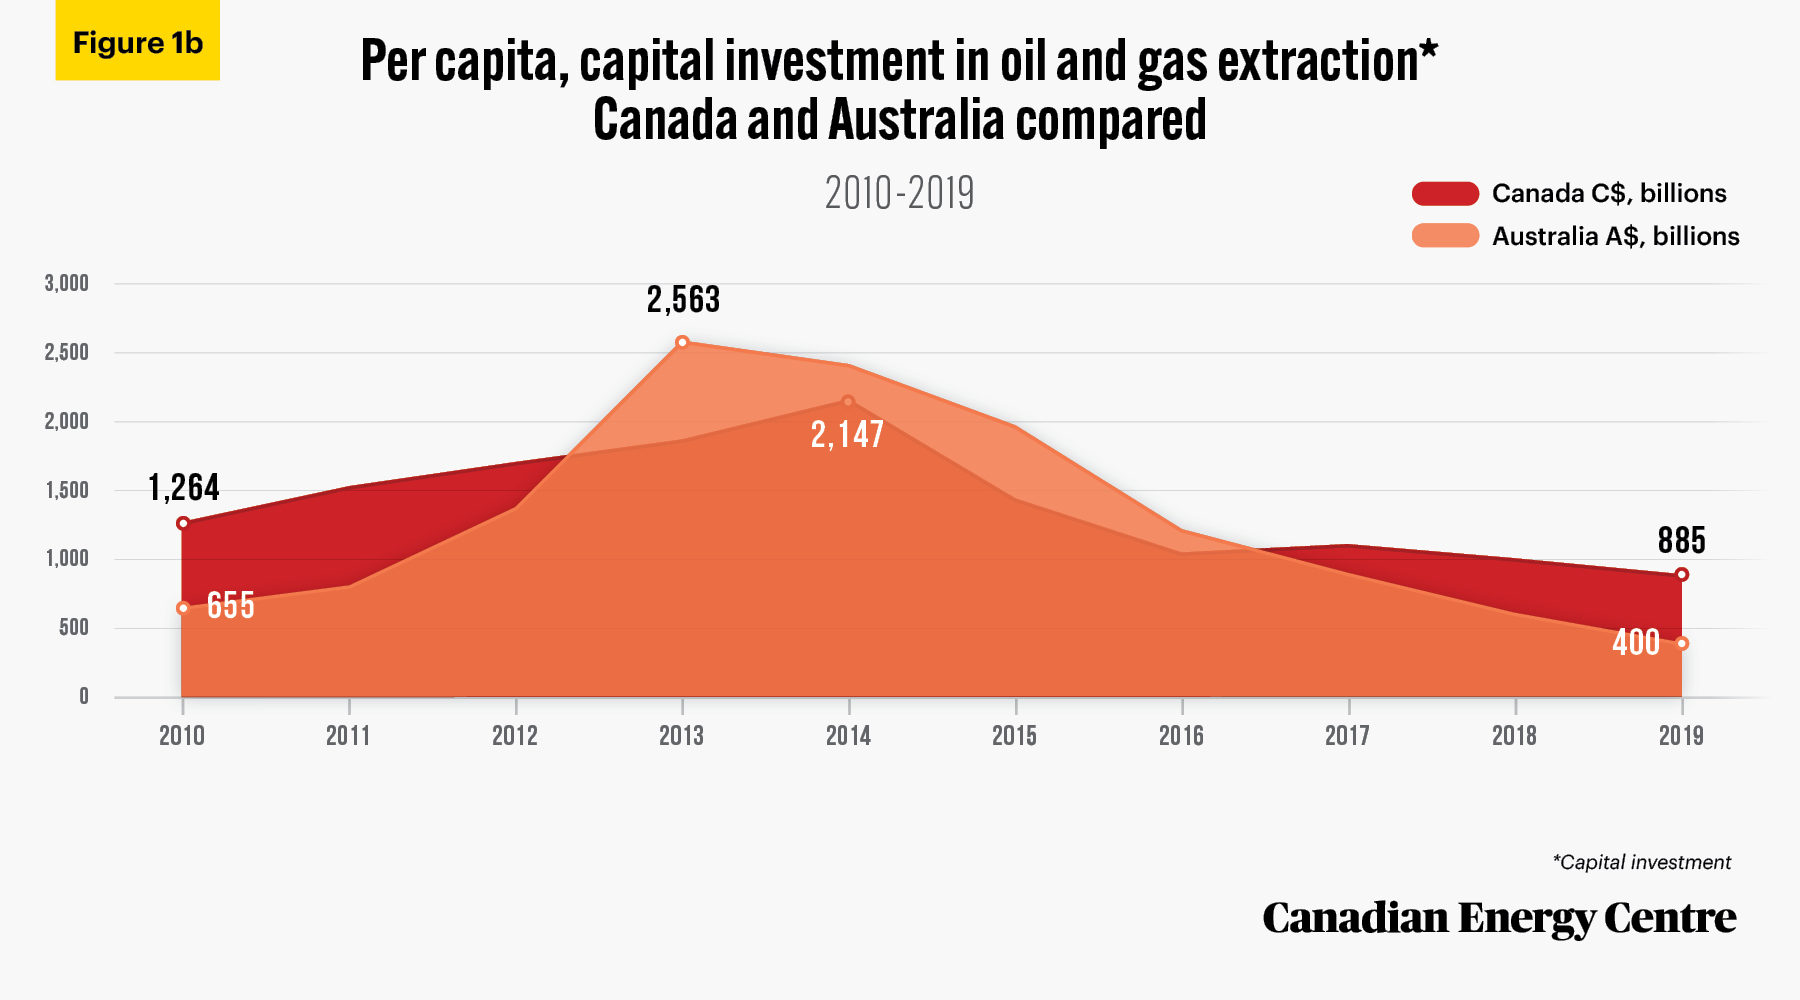
Between 2010 and 2019, actual expenditures in the oil and gas extraction sector in Australia were nearly A$320 billion, or an annual average of A$1,252 per capita. Investment has ranged from (see Figures 1a and 1b):
• as high as $59.7 billion in 2013 and as low as $10.2 billion in 2019; and
• as high as $2,563 per capita in 2013 and as low as $400 per capita in 2019.
According to the Australian Petroleum Production and Exploration Association (APPEA), the oil and gas industry has invested nearly A$350 billion over the last decade. Since the mid-1980s, cumulative investment has been almost four times greater than the industry’s cumulative net profit.
Over the past decade, investment in LNG has driven growth in the Australian oil and gas sector, and at one point there were expectations that the country would soon become the world’s largest LNG exporter, surpassing Qatar. Despite the current low price environment and concerns over COVID-19, which have stalled LNG projects, the medium- to long-term prospects for increased investment in the Australian oil and gas extraction sector are bright due to a favourable regulatory environment and close proximity to Asian LNG demand markets.
Canada
Between 2010 and 2019, cumulative capital investment in the Canadian oil and gas extraction sector was C$494.3 billion, or an annual average of C$1,386 per capita. Investment has ranged from (see Figures 1a and 1b),
• as high as $76.1 billion in 2014 and as low as $33.3 billion in 2019; and
• as high as $2,147 per capita in 2014 and as low as $885 per capita in 2019.
Unlike Australia, medium- to long-term prospects for investment in the Canadian oil and gas extraction sector are tempered not only by low energy prices and COVID-19, but by concerns around lack of market access and a less than favourable regulatory regime. According to the Canadian Energy Research Institute (CERI):
“[Even prior to COVID-19], the Canadian crude oil sector had already been facing challenges due to lack of market access and regulatory uncertainty. Canada’s oil sands had already been impacted by reduced investment due to the low-price environment before 2018… On the regulatory side, the legislation that reformed the Canadian Energy Regulator (CER) (formerly known as the National Energy Board), combined with the legislation banning tankers shipping in the northern parts of British Columbia, increased the regulatory risk perceived by the sector.”
2. In this fact sheet, we do not convert Australian dollars to Canadian dollars or vice-versa. For the past decade, the two currencies have been in a relatively narrow range of each other, often within pennies, the exception being in April 2020 amidst significant gyrations in world markets. Readers should assume that unless otherwise stated, currency values are local, i.e., in Canadian dollars and in Australian dollars when investment et al, is discussed.
Sources: Statistics Canada Table: 34-10-0035-01; Australian Bureau of Statistics, Australian National Accounts
Sources: Statistics Canada Table: 34-10-0035-01; Australian Bureau of Statistics, Australian National Accounts
Employment
Despite similarities in oil and gas capital investment trends in Canada and Australia, the two countries have diverged dramatically on employment in the sector. In Australia, multiple greenfield LNG projects coming on production in recent years has led to increased employment, while in Canada employment in the oil and gas extraction sector has stalled.
Australia
As of November 2019, there were 38,116 people directly employed in the Australian oil and gas extraction sector.
Direct employment grew from 12,919 in 2010, an increase of 195 per cent (see Figure 2a and 2b).
Australian oil and gas extraction sector employment experienced dramatic growth over the past decade. According to Wood Mackenzie:
“During the period from 2006 to 2016 as the industry enjoyed an investment boom, the direct oil and gas workforce more than doubled, with jobs being created not just in exploration and production but also in corporate and project development. This industrial activity also supports an extensive supply chain of businesses and numerous jobs in manufacturing, construction, technology, transportation, accounting, and other services (e.g., transport).”
Although there has been a drop in employment in 2020, the prospects for increased employment in Australia’s oil and gas extraction sector are promising over the medium-term as energy prices gradually recover and new LNG projects move forward.
Canada
In 2019, there were 55,853 people directly employed in the Canadian oil and gas extraction sector. Over the past decade, direct employment in the Canadian oil and gas extraction sector grew from 51,686 in 2010, an increase of just over 8 per cent (see Figure 2a and 2b).
In contrast to Australia, direct employment in Canada’s oil and gas extraction sector has been stagnant over the past decade, and medium term prospects appear to be tempered because of the lack of market access and regulatory concerns.
According to PetroLMI:
The low oil and gas prices that have persisted since late 2014 have played a key role in the industry’s workforce restructuring…Mergers and acquisitions have also impacted the workforce, along with technical improvements and innovation, enabling the industry to produce more oil and gas with less investment and fewer workers.
More recently, however, stalled progress on the development of pipeline and LNG infrastructure projects in Canada is driving lower capital spending and lower employment levels across the industry’s conventional exploration and production (E&P), oil sands, oil and gas services and pipeline sub-sectors…market access issues continue to weigh heavily on investors and capital investment, which in turn impacts employment growth… Until additional export capacity becomes available, the employment outlook for Canada’s oil and gas sector will be impacted.
Sources: Statistics Canada Table 14-10-0202-01; Australian Bureau of Statistics, Labour Force
Sources: Statistics Canada Table 14-10-0202-01; Australian Bureau of Statistics, Labour Force
GDP
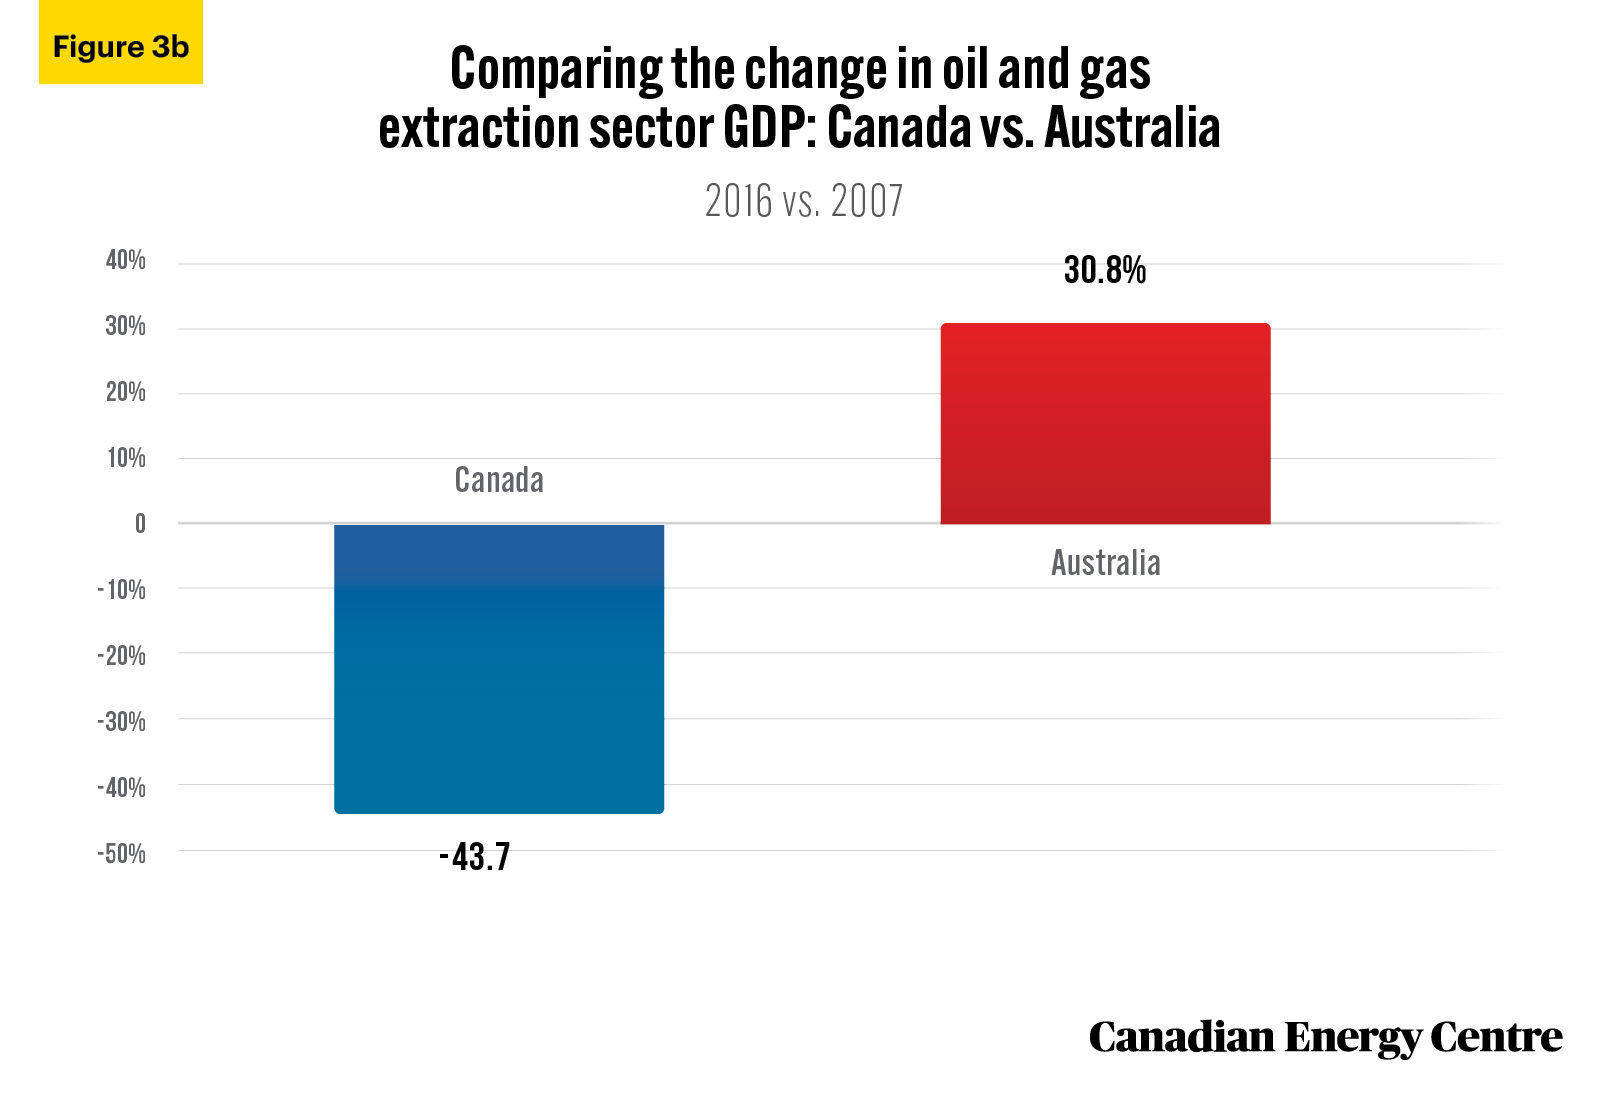
Here we compare the economic size of the oil and gas extraction sector in Australia and Canada by measuring their respective GDP contributions. The most recent comparative data is for 2016. To be consistent with other timelines in this Fact Sheet, we track back to 2007 to give a decade-long look at the trends in both countries (see Figure 3a and 3b).
Australia
• In 2016, oil and gas extraction sector GDP in Australia was valued at nearly A$32.7 billion, or A$1,339 per capita. This represented an increase of nearly 52 per cent in one decade from A$21.5 billion in 2007;
• Per capita, the GDP of Australia’s oil and gas extraction sector averaged an annual A$1,149 per person between 2007 and 2016; and
• The change per capita was from $1,024 in 2007 to $1,339 in 2016, an increase of nearly 31 per cent.
The Australian oil and gas extraction sector experienced dramatic GDP growth over the past decade and has become a significant factor in the country’s economy. According to the Commonwealth Scientific and Industrial Research (CSIRO):
Australia is the OECD’s third largest energy producer behind Canada and the United States, Domestically, oil and gas extraction contributes around 2 per cent of GDP (more than A$31 billion 2015–16). Although it currently employs an estimated 29,000 people, the sector’s GDP impact is on par with Australia’s agricultural sector, which employs 10 times that number.
Canada
• In 2016, oil and gas extraction sector GDP in Canada was C$76.1 billion, a 65 per cent decrease from $119.0 billion in 2007;
• Canadian oil and gas extraction GDP averaged an annual C$3,496 per person between 2007 and 2016; and
• Per capita figures were C$2,108 per person in 2016 and $3,743 in 2007, a decrease of nearly 44 per cent (see Figure 3a and 3b).
Even through Canada’s oil and gas extraction sector remains an important part of the Canadian economy, in contrast to Australia, GDP has declined over the past decade. There are also concerns that Canadian oil and gas extraction GDP growth may be hampered moving forward by regulatory uncertainty. According to the Fraser Institute:
The oil and gas sector is very important to the Canadian economy, and particularly to Alberta and Saskatchewan. The oil and gas sector by itself accounted for 5.2 per cent of Canada’s GDP (in 2016).
A sharp drop in the world price of crude oil in 2015 and 2016 hurt the profitability of upstream oil and gas companies in both Canada and the US. Investment analysts and portfolio managers have recently warned that investment in the oil and gas sector is moving increasingly to the U.S. and away from Canada, and that they are reluctant to invest their clients’ savings in Canadian oil and gas companies. An unfavourable business environment for oil and gas exploration and production in Canada is cited as the reason.
Sources: Statistics Canada Table 36-10-0401-01; Australian Department of Industry, Science, Energy and Resources
Sources: Statistics Canada Table 36-10-0401-01; Australian Department of Industry, Science, Energy and Resources
Government Revenues
Australia
Government revenues collected from the oil and gas extraction sector in Australia include the petroleum resource rent tax; production excise, royalties and fees, corporate taxes, and other taxes and fees. From 2008/09 to 2017/18 inclusive, cumulative revenues collected from the Australian oil and gas industry totaled nearly A$69.2 billion (see Table 1), or an annual average of A$295 per person.
Wood Mackenzie expects that the bulk of the government revenue from oil and gas taxation is likely to occur only in the coming years because of:
[1] A large stock of deductible expenditures from the recent wave of new projects: The total project costs of Gorgon LNG and Wheatstone LNG, for example, were estimated at US$54 billion (A$82 billion) and US$34 billion (A$52 billion) respectively.
[2] Low oil and gas prices which reduce project profitability: Using Gorgon LNG as an example, at our base case long-term Brent price assumption of US$65/bbl real, the payback period is 19.5 years. At US$50/bbl real, however, the payback period is pushed to 21.4 years; and at US$30/bbl real, it is pushed further to 32.5 years.
Canada
Government revenues collected from the oil and gas extraction sector in Canada include royalties and fees, crown lease payments, and corporate income taxes. Between 2009 and 2018 inclusive, revenues collected from the Canadian oil and gas extraction sector totaled over C$173.3 billion, or an annual average of C$492 per person (see Table 1).
The oil and gas extraction sector has contributed significant revenues to federal and provincial government coffers over the past decade, even with the drop in crude oil prices over the period. However, unlike Australia, the prospects for return to the level of government revenues experienced in the early 2010s are tempered because of concerns by investors about regulatory uncertainty and a lack of market access, which has hampered the development of a number of pipeline and LNG projects.
Sources: Statistics Canada, various tables and custom tabulations; CAPP; APEA. Note that the fiscal years reflect Australia’s practice while the Canadian revenues are from the calendar year, i.e., the 2009/10 revenues from Canada would actually be from January 1, 2009 to December 31, 2009, while the Australian figures represent April 1, 2009 to March 31, 2010
Australia-Canada differences: Delays, access issues, and export market diversification failure in Canada
There are a number of reasons why Australia has moved ahead in the past decade on measures of employment and GDP while Canada’s growth on both metrics stalled. In broad terms, they involve regulatory uncertainty, anti-oil and gas activism and court actions, and the resulting delays for export market diversification.
The Canadian Energy Research Institute (CERI) found that “Canada has a competitive disadvantage of oil and gas investments compared to the U.S. when it comes to LNG projects and interprovincial oil and natural gas pipelines.” CERI cited multiple issues including:
• an increased approvals period that adds an extra 13 to 19 months to projects;
• increased uncertainty of the decision-making process;
• resulting extra costs;
• resulting extra risk;
• LNG projects that take approximately 19 additional months for approval in Canada than the US, providing a competitive advantage to US investments; and
• delays to pipeline projects that are legally challenged and can take considerably more time in Canada, which can add as much as 15 per cent to the overall capital cost in the first year.
In contrast, the Australian oil and gas extraction sector, particularly with the advent of LNG, has been far more resilient in terms of GDP and employment. This has occurred despite the depressed energy price environment due to favourable market fundamentals including access to emerging demand centers in the Asia-Pacific region and a regulatory regime that appears more responsive to resource development.
According to the Canadian Global Affairs Institute (CGAI):
The establishment of the Standing Council on Energy which became the Council of Australian Governments (COAG) Energy Council in 2014, combining federal, state, territorial and municipal policymakers was a step in the right direction. [This led to] regulatory and governance reform to streamline processes and decision-making and deliver outcomes more efficiently and consistently. Any effort to harmonize energy policy, legislation and market rules and regulatory streamlining should be beneficial.
Further, CGAI advises that:
This is certainly something Canada should explore. Siloed regions and pressure from communities, environmentalists and overarching federal policies are turning the Canadian courts into the regulator. Perhaps a national body such as Australia’s COAG Energy Council could help solve some of Canada’s infrastructure and resource development gridlock.
Another factor in Canada’s mixed performance over the past decade is excessive reliance on one major market (i.e., the United States) while that customer’s own production of oil and natural gas soared.
Over the past ten years, oil and natural gas demand markets have shifted towards the Asia-Pacific region, notably China and India. Australia is currently better positioned than Canada to meet these demands, with the emergence of LNG and longer established energy trade flows. If Canada is to compete with Australia over the next decade, it will need to strike a more appropriate balance between the environment and the economy in order to encourage a stable foundation for investment, employment, GDP, and government revenues.
According to the Canadian Centre for Living Standards (CCLS):
The Australia oil and gas sector has greatly benefited from impressive export growth to the huge and fastgrowing Chinese market, especially through LNG exports. Canada’s main market, on the other hand, is the slowgrowing United States. Given the importance of demand growth for both output and productivity advance, Canada should focus greater attention on emerging markets where there is significant potential for growth in exports.
According to the Oxford Institute for Energy Studies:
Canada is losing out on the order of trillions of dollars in overall macroeconomic impact over the next 40 years, not to mention the opportunity to make a significant reduction in global emissions by displacing the coal burned for electric power in Asia. The forgone macroeconomic benefit is simply redirected to more predictable supply jurisdictions, primarily the U.S. Gulf Coast, Russia, Qatar, and East Africa.
Takeaway
The tale of the Canadian and Australian oil and gas extraction sectors over the past decade is one of diverging paths when examining trends for such key metrics as employment and GDP, with the potential for a quicker recovery in government revenues in Australia.
While the oil and gas extraction sector in Canada continues to contribute to GDP, create high-paying jobs and generate billions of dollars annually for provincial and federal governments, regulatory uncertainty, a lack of market access and environmental pressures have contributed to slowed investment.
Notes
This CEC Fact Sheet was compiled by Lennie Kaplan and Mark Milke at the Canadian Energy Centre (www.canadianenergycentre.ca). The authors and the Canadian Energy Centre would like to thank and acknowledge the assistance of Philip Cross in reviewing the data and research for this Fact Sheet. Image credits: Sydney, Australia by Photoholgic from Unsplash.com
References (All links live as of December 14, 2020)
Australian Bureau of Statistics, 2020a). Australian and New Zealand Standard Industrial Classification (ANZSIC), 2006 (Revision 2.0). <https://bit.ly/3lYQzid>; Australian Bureau of Statistics (2020b). Australian National Accounts: National Income, Expenditure and Product, Quarterly estimates of key economic flows in Australia, including gross domestic product (GDP), consumption, investment, income and saving, <https://bit.ly/38eTCja>; Australian Bureau of Statistics (2020c). Labour Force, Australia, Detailed, Table 06. Employed persons by Industry sub-division of main job (ANZSIC) and Sex. <https://bit.ly/36a0WKo>; Australian Bureau of Statistics (2020d). Private New Capital Expenditure and Expected Expenditure, Australia. <https://bit.ly/3jVXk3u>; Australian Petroleum Production and Exploration Association (2020). Key Statistics, 2020. <https://bit.ly/2JANl73>; Canadian Association of Petroleum Producers (2020). CAPP Statistical Handbook for Canada’s Upstream Petroleum Industry. <https://bit.ly/36LFHR3>; Canadian Centre for Living Standards (2016). Comparison of Australian and Canadian Productivity Performance: Lessons for Canada. <https://bit.ly/2I2OYK5>; Canadian Energy Research Institute (2020a). Competitiveness of Canada’s Regulatory Framework for the Oil and Gas Sector. <https://bit.ly/3mX13zH>; Canadian Energy Research Institute (2020b). Economic Recovery Pathways for Canada’s Energy Industry: Part 1 – COVID-19 Impacts. <https://bit.ly/3jZvzXH>: Canadian Global Affairs Institute (2019). A Study of Liquefied Natural Gas Development in Australia and Requisite Learnings for Canada, <https://bit.ly/3p2W6ae>: Commonwealth Scientific and Industrial Research (2017). Oil and Gas: A Roadmap for unlocking future growth opportunities for Australia. <https://bit.ly/3etkvRF>.Fraser Institute (2019). Investment in the Canadian and US Oil and Gas Sectors: A Tale of Diverging Fortunes. <https://bit.ly/2TUXltS>; Industry Canada (2020). Summary – Canadian Industry Statistics. <https://bit.ly/3n5tOdQ>; Oxford Institute for Energy Studies (2020). Canadian LNG Competitiveness: Beyond LNG Canada, will the country overcome self-inflicted regulatory uncertainty and high projected capital costs to become a global player? <https://bit.ly/2IasQxo>; PetroLMI, (2019). Oil and Gas Labour Market Update. <https://bit.ly/353NlFc>; pwc Canada (2019). Crisis to catalyze change or history repeating? Energy Visions 2019, How understanding the past decade of turbulence can help Canada reimagine its energy future. <https://pwc.to/3mTFXCc>; Statistics Canada (2020a). Table 10-10-0016-01: Canadian Government Finance Statistics for the Federal Government. <https://bit.ly/2GPmmDt>; Statistics Canada (2020b). Table 10-10-0017-01: Canadian Government Finance Statistics for the Provincial and Territorial Governments. <https://bit.ly/3lwJhCI>; Statistics Canada (2020c). Table 34-10-0035-01 Capital and repair expenditures, non-residential tangible assets, by industry and geography (x 1,000,000), 2020 <https://bit.ly/3jZwnfb>; Statistics Canada (2020d). Table 14-10-0202-01 Employment by industry, annual, 2020. <https://bit.ly/3ltepTy>; Statistics Canada (2020e). Financial and Taxation Statistics for Enterprises, by Industry Type (x 1,000,000). Custom tabulation); Statistics Canada (2020f). Table 33-10-0006-01: Financial and Taxation Statistics for Enterprises, by Industry Type. <https://bit.ly/33Mkzba>; Statistics Canada (2020g). Table 36-10-0401-01 Gross domestic product (GDP) at basic prices, by industry (x1,000,000), 2020. <https://bit.ly/38e5f9Z>; Wood Mackenzie, (2020). Australia Oil & Gas Industry Outlook Report. <https://bit.ly/356vugV>; XE.com. XE currency charts AUD to CAD chart, 13 December 2010 to 9 December 2020, <https://bit.ly/3qBm7OK>.
Creative Commons Copyright
Research and data from the Canadian Energy Centre (CEC) is available for public usage under creative commons copyright terms with attribution to the CEC. Attribution and specific restrictions on usage including non-commercial use only and no changes to material should follow guidelines enunciated by Creative Commons here: Attribution-NonCommercial-NoDerivs CC BY-NC-ND.