Social
To sign up to receive the latest Canadian Energy Centre research to your inbox email research@canadianenergycentre.ca
Canada’s port system and the energy trade
Canada’s seaports are key to moving goods and people via logistical supply chains extending to seaports in more than 170 countries and territories throughout the world. They are critical hubs in the nation’s economy, bringing Canada’s goods, including oil, natural gas and fuels, to key markets in the United States, China, Japan, and South Korea, among other countries.
Oil and gas shipments (both exports and imports) are a significant portion of port traffic. In this Fact Sheet (which can be downloaded here as a pdf), we examine the contribution that Canadian ports make to the country’s energy sector trade (and vice-versa) and how Canadian ports stack up internationally on such measurements.
Canada’s share of tanker/marine trading has the potential to grow if the shipping of petroleum products, LNG, and other fuels increases given that energy-rich projects such as TMX and LNG Canada will use Canadian ports to feed the growing demand for Canadian energy products, particularly in Asian markets.
In 2018, the energy sector directly employed 282,000 Canadians and generated $230 billion in value to the Canadian economy. As for marine shipping, one 2017 report found that the national economic impact of the sector is equal to approximately 1.8 per cent of the Canadian economy, or about $30 billion; and that the marine shipping industry in Canada was a direct and indirect source of income for nearly 100,000 jobs in 2017.
Crude oil and petroleum products make up the largest proportion of total tonnage shipped
According to Clear Seas, petroleum, liquified natural gas, and other petroleum products represent the largest volume of commodities handled by Canadian ports, at 326 million tonnes, or about 20 per cent of total tonnage of approximately 1,630 million tonnes.
Between 2003 and 2012 data (the most recent decade-long averages available from Transport Canada), about 283 million tonnes per year, or 87 per cent of the oil transported in Canadian waters, was transported through Atlantic Coast, the Great Lakes, the Gulf of St. Lawrence and the St. Lawrence Seaway ports and facilities, while 43 million tonnes, or 13 per cent, was shipped through Pacific coast ports and facilities, including 37 million tonnes of U.S. traffic through Canadian waters.
Petroleum exports from Canada to the world
• Transport Canada data (see table 1) indicates that, of the $112.7 billion generated in Canadian ports and marine shipping exports in 2018, $21.6 billion or 19 per cent was generated by exports of petroleum products, liquified natural gas and other fuels.
• In dollar terms, this is higher than 2010 when exports of petroleum products, liquified natural gas and other fuels were $18.8 billion. However, in 2010, the proportion of petroleum products as percent of all exports was higher at 23 per cent.
Imports of petroleum from the world to Canada
• Transport Canada data indicates that of the $138.1 billion generated in Canadian ports and marine shipping imports in 2018, $27.8 billion or 20 per cent was generated by imports of petroleum products, liquified natural gas and other fuels.
• This is higher than in 2010 when imports of petroleum products, liquified natural gas and other fuels to Canada were $23.2 billion, though as a proportion of all imports, petroleum products et al. were higher, at 27 per cent.
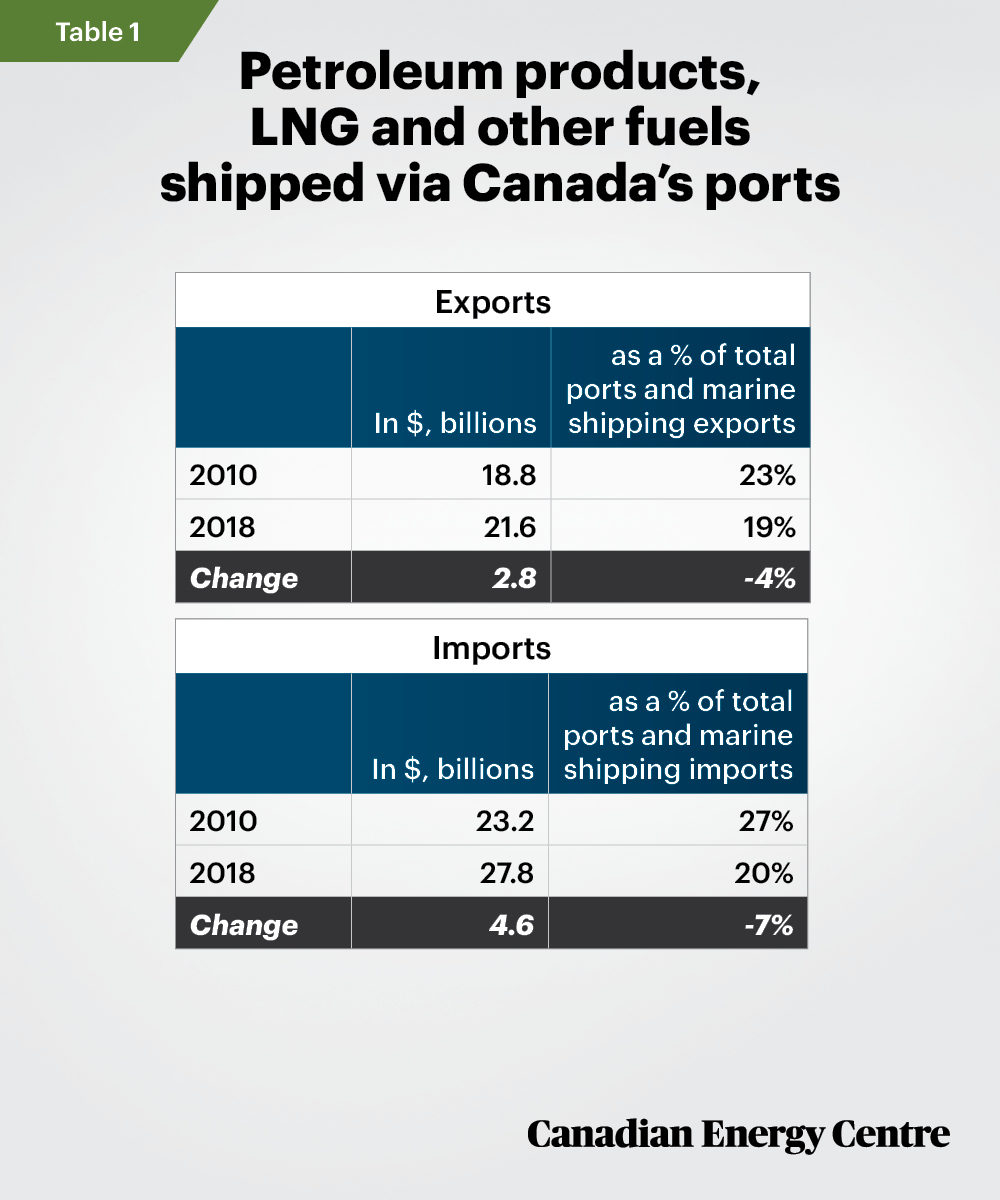
Source: Transport Canada 2018.
Oil tanker traffic at Canada’s ports
Clear Seas estimates that there are approximately 20,000 oil tanker movements off the coasts of Canada each year. Of these, measured in millions of tonnes, approximately 17,000 (85 per cent) of tanker movements are on the Atlantic Coast. Most of the oil tanker movements in Canada take place at seven ports and facilities: The Port of Vancouver, the Port of Montreal, Port de Quebec, Newfoundland Offshore, Come by Chance, Port Saint John, and Port Hawkesbury, Nova Scotia.
Limitations on tankers from West Coast ports
The largest tankers moving on Canadian waters are UltraLarge Crude Carriers (ULCC) (350,000 – 550,000 dead weight tonnage or DWT), which travel the East Coast of Canada. ULCCs can carry up to four million barrels of oil.
In contrast, Canada currently has limitations on the size of tankers that can access west (but not east) coast ports. On the West Coast, the largest tankers that are used to ship oil out of the Port of Vancouver are Aframax tankers (80,000 – 120,000 DWT). They can carry approximately 550,000 barrels of oil. The 120,000 DWT tankers can only be loaded to 80 per cent capacity due to depth and other restrictions in the Burrard Inlet as well as the presence of the Second Narrows Bridge.
The completion of the Trans Mountain Expansion Project could increase the number of oil tankers visiting the Port of Vancouver from around 30 to 50 vessels per year (out of 3,150 in total annually) to 400 annually and could represent about 11 per cent of total tanker traffic that call at the Port of Vancouver.
There are other restrictions off the coast of British Columbia. The federal government enacted a ban on oil tankers off the north coast of British Columbia as part of Bill C-48, the Oil Tanker Moratorium Act, effective in 2019. That made the Northern Gateway pipeline project with a proposed terminus at Kitimat (or any resurrected future project akin to the same) impossible due to the bill’s low tonnage restrictions.
Safety records
As for safety, for Canada’s ports as a whole, Clear Seas reports that the frequency of oil spills has been decreasing since the 1970s and that “large oil spills, especially those from oil tankers, have been rare in Canadian waters.” On oil spills, as the Port of Vancouver notes, “For about 60 years, [oil] tankers have travelled through the Burrard Inlet without incident. In that time, safety standards have continued to become more stringent.”
Oil exports and oil imports: Canada-U.S. patterns
Between 2010 and 2018, the pattern of ports and marine shipping trade between Canada and the United States shows a range-bound pattern. While Canadian exports of petroleum and other exports stayed in the same range, U.S. imports into Canada increased nearly five-fold since 2010 (see figures 1 & 2).
• Canada’s exports to the U.S. are range-bound: Canada exported $17.8 billion worth of petroleum and other fuel products to the United States (through U.S. ports and marine trade) in 2010. That rose to $20.3 billion in 2013, hit a low of $11.7 billion in 2016, and rose to $15.9 billion in 2018. In other words, Canadian exports have not recovered to 2010 levels.
As a percentage of all port and marine trade exports, petroleum and other fuel products constituted 85 per cent of all such exports in 2010 and 79 per cent in 2018.
• U.S. imports to Canada up by a factor of five: Conversely, imports of U.S. petroleum and other fuel products to Canada (through Canadian ports and marine trade) have risen substantially; from just $2.9 billion in 2010 to $13.9 billion as of 2018, or nearly five times higher.
As a percentage of all port and marine trade imports into Canada from the U.S., petroleum and other fuel products made up 50 per cent of all such imports in 2010 and 77 per cent in 2018.
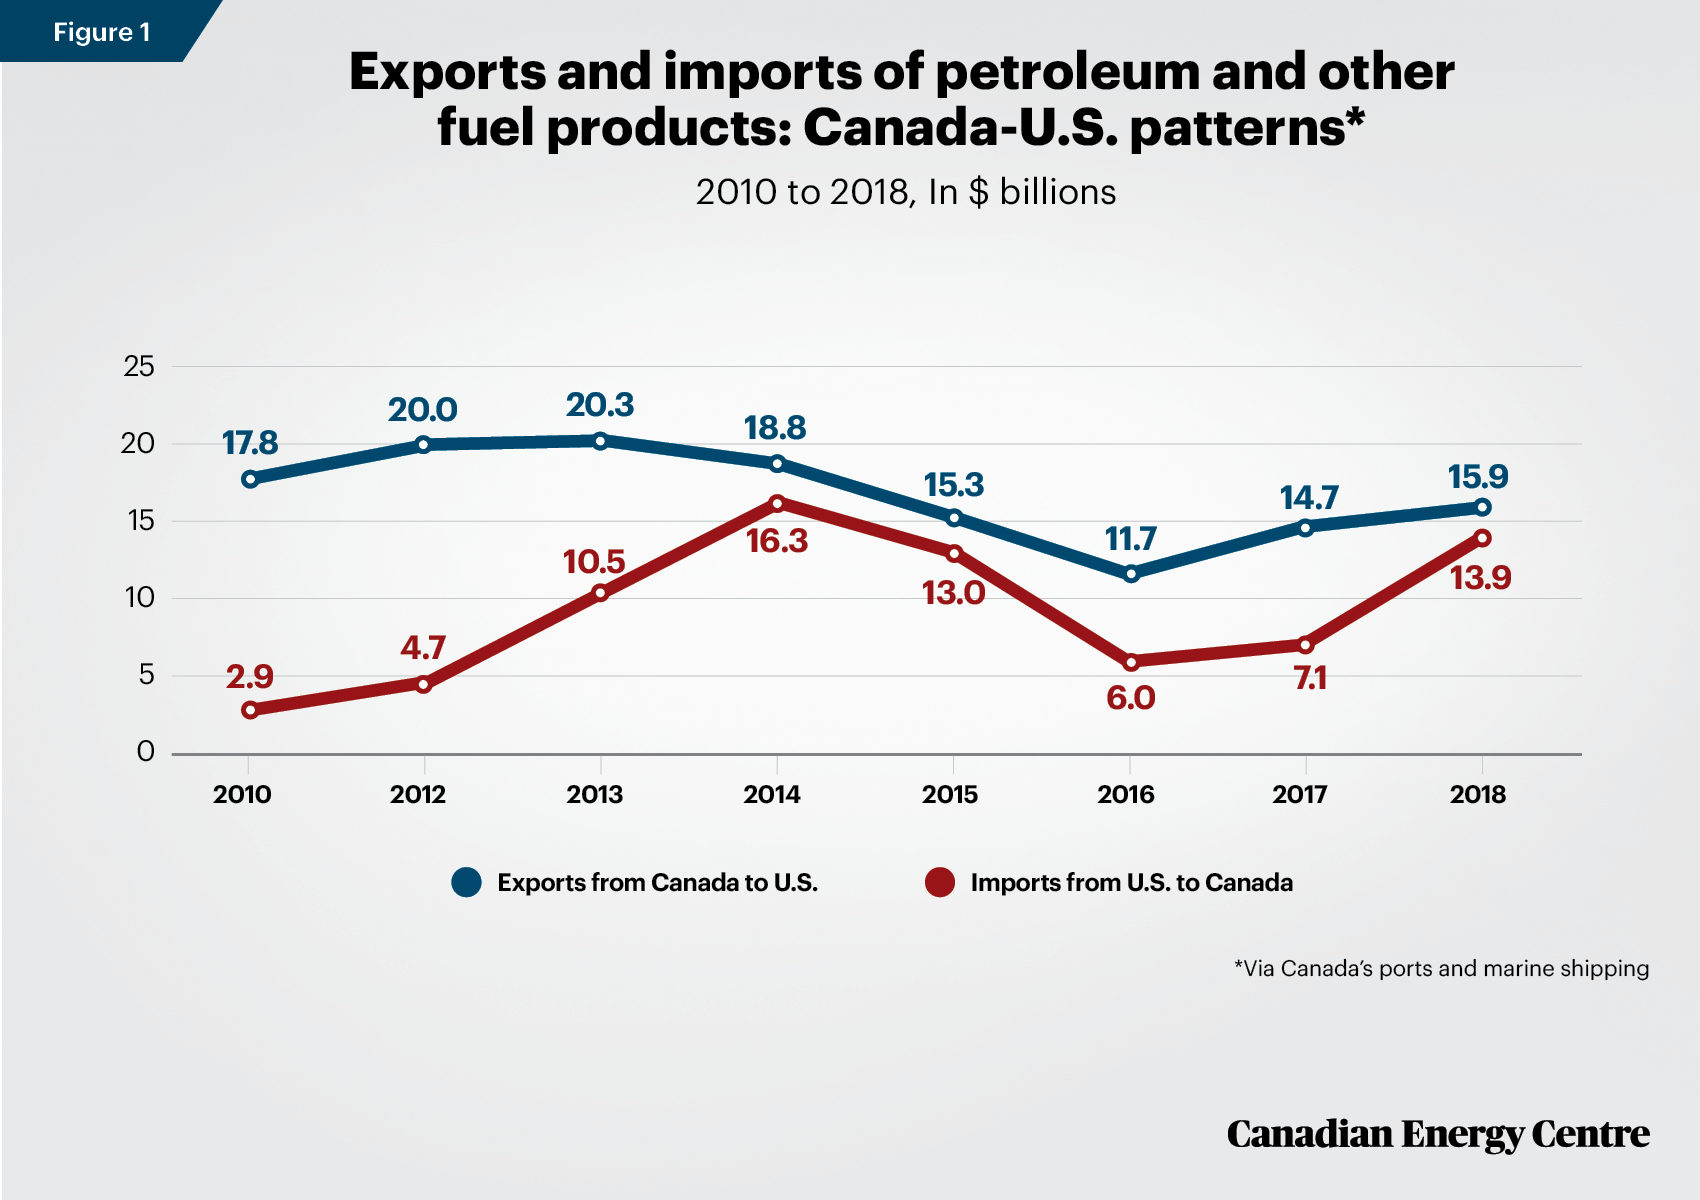
Source: Transport Canada, Overview Reports 2010-2018. 2011 data unavailable.
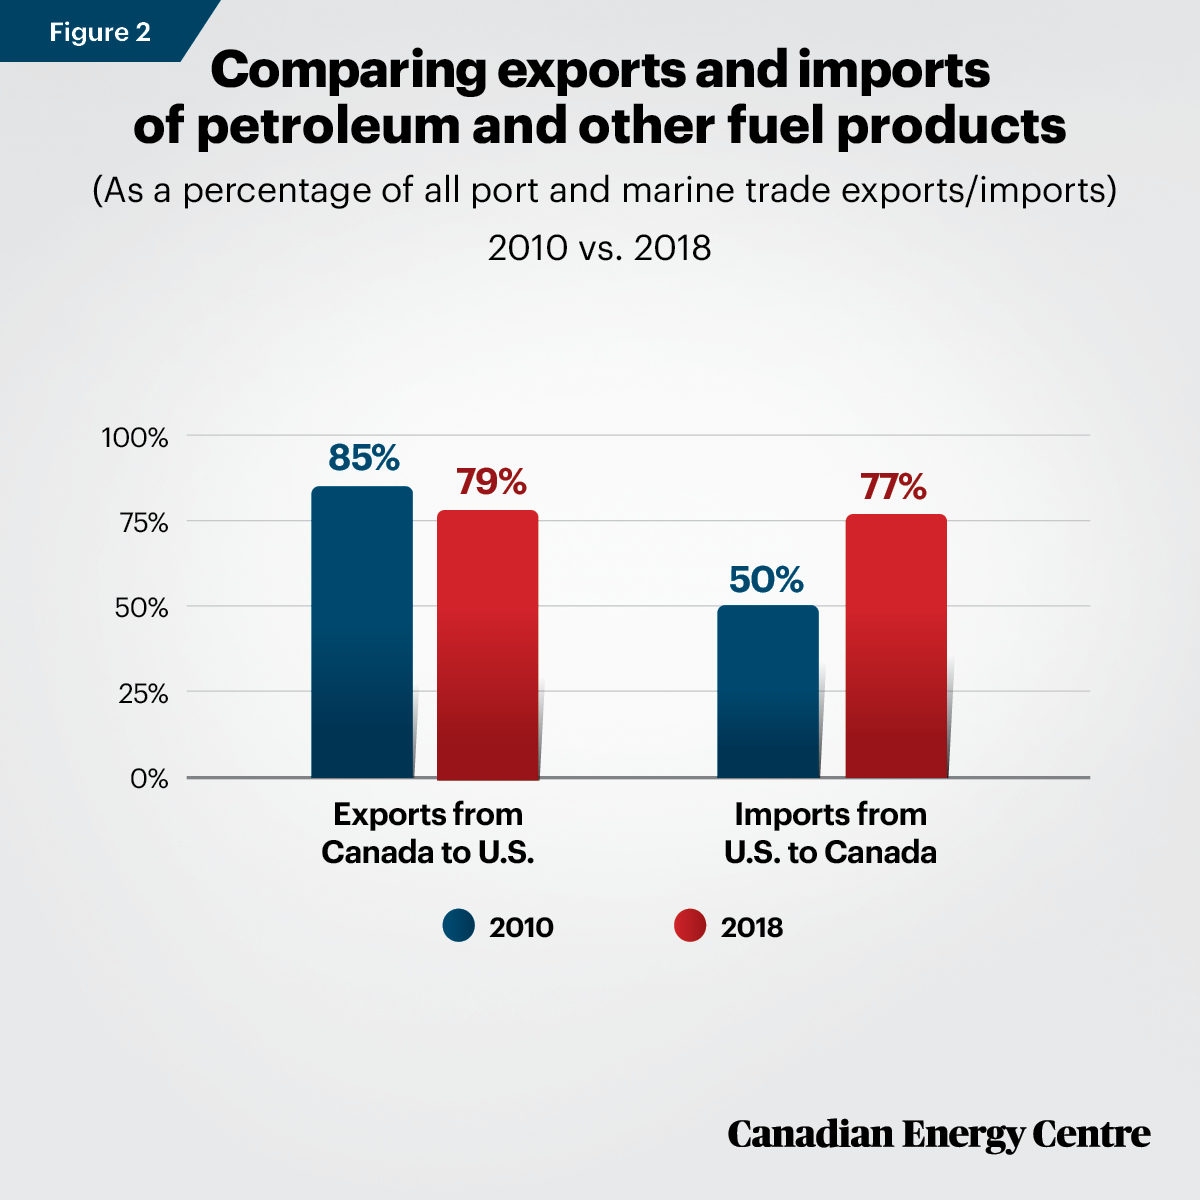
Source: Transport Canada, Overview Reports 2010-2018.
Canada-U.S. port comparisons on crude oil and petroleum products
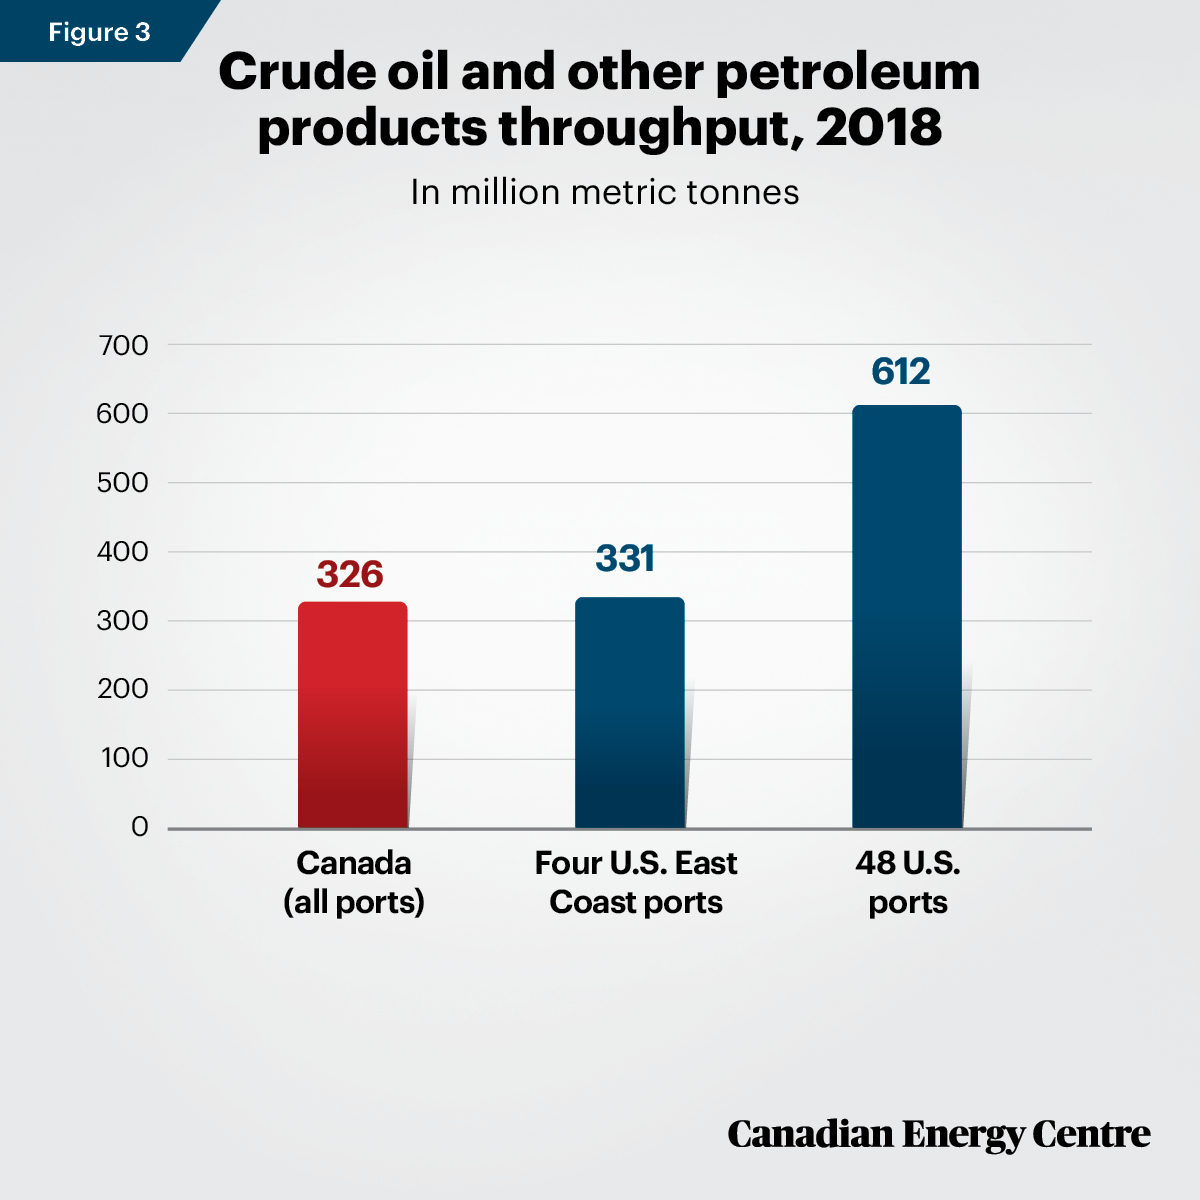
While Canadian ports handled an average of 326 million metric tonnes of crude oil and petroleum products, they handled far less than 48 United States ports which handled about 612.4 million metric tonnes in 2018.
In fact, four U.S. East Coast ports—the Port of Corpus Christi (59.5 million metric tonnes), the Port of Houston (136.6 million metric tonnes), the Port of Beaumont (75.8 million metric tonnes), and the Port of New York and New Jersey (59.2 million metric tonnes) handled about 331.1 million metric tonnes in 2018. Those four ports alone shipped the equivalent of nearly 102 per cent of Canada’s total ports shipments of crude oil and petroleum products.
Canada’s population is significantly smaller than that of the United States, (which is 8.7 times larger) so some imbalance in such oil and other petroleum throughputs might be expected. However, population counts are not definitive for port traffic. Using a different metric, container throughput traffic, as an example, Malaysia’s total traffic in containers was nearly 25 million TEUs (Twenty-Foot Equivalent Units) whereas Canada’s ports handled about 6.7 million TEUs of container traffic in 2018, or just 27 per cent of the traffic in Malaysia’s ports. Malaysia’s population in 2020 is 32.4 million whereas Canada’s is nearly 38 million. In other words, more lightly-populated countries can have port volumes significantly higher than countries with larger populations, if exports markets are vigorously pursued, among other reasons for higher port traffic.
Source: Clear Seas and United States Department of Transportation.
Canada-international port comparisons on crude oil, refined petroleum products, natural gas and chemical shipments
Crude oil, refined petroleum products, natural gas and chemical shipments¹ are the largest type of port cargo worldwide. While the growth of worldwide shipments of crude oil has slowed, worldwide LNG shipments have surged.
• The United Nations Conference on Trade and Development (UNCTAD) estimates that world maritime trade in crude oil, refined petroleum products, natural gas and chemicals was over 6.56 billion tonnes in 2018, about 30 per cent of total goods traded. This represents an increase from 2010, when 5.66 billion tonnes of crude oil, refined petroleum products, natural gas and chemicals were traded, about 34 per cent of total goods traded.
• Crude oil: According to UNCTAD, crude oil growth was limited by declining imports into Europe and the United States and a slowdown in import demand in China, owing to refinery capacity constraints suffered earlier in 2018. Trade in refined petroleum products was held up by falling imports from Brazil and southeast Asia and the drawing on stocks in some regions. However, stable import demand in Mexico and expanding shipments from Western Asia and the United States helped offset the negative trend somewhat.
• LNG: Liquified petroleum gas shipments picked up speed and increased by nearly 8 per cent in 2018, up from a 2 per cent increase in 2017. Strong import demand in India and Europe and expanding supply from the United States and Western Asia underpinned this performance. On the export side, shipments of LNG from the United States to Asia expanded, benefiting from growing production and pricing dynamics. Additional support was provided by growing supply in Western Asia as a result of petrochemical capacity expansion in the region.
Takeaway
Canada’s share of tanker/marine trading has the potential to grow if Canada competes with world ports, including on the shipping of petroleum products, LNG, and other fuels. Energy-rich projects such as TMX and LNG Canada will use Canadian ports to feed the growing demand for Canadian energy products in Asian markets. While on the West Coast tanker sizes are restricted in a manner they are not restricted on the East Coast—due both to local conditions at the Port of Vancouver but also a 2015 political promise from then Liberal party leader (later Prime Minister, Justin Trudeau)—the underdevelopment of the oil and gas extraction and export sector in Quebec and on the East Coast has also contributed to weaker port growth in those provinces/regions.
1. A breakdown of the data absent chemical shipments is not available.
Notes
This CEC Fact Sheet was compiled by Lennie Kaplan and Mark Milke at the Canadian Energy Centre (www.canadianenergycentre.ca). The authors and the Canadian Energy Centre would like to thank and acknowledge the assistance of Philip Cross and three anonymous reviewers in reviewing the data and research for this Fact Sheet. Image credits: “Cranes in Seaport” by Chris Jongkind from Getty Images.
Sources (Links live as of Sept 17, 2020)
American Association of Port Authorities and Martin Associates (2019). 2018 National Economic Impact of the U.S. Coastal Port System: Executive Summary 2019, <https://bit.ly/3lpsa6E>; Association of Canadian Port Authorities (undated), Industry Information: Canadian Port Industry, 2016, <https://bit.ly/3gy0x7B>; Clear Seas (undated). Oil Tankers in Canadian Waters, <https://bit.ly/3aZs3tC>; Council of Canadian Academies (2017). The Value of Commercial Marine Shipping to Canada: The Expert Panel on the Social and Economic Value of Marine Shipping to Canada, 2017, <https://bit.ly/3b46IiQ>; Issawi, Hamdi and Wanyee Li (2019), “What you need to know about the controversial tanker bill,” Toronto Star, <https://bit.ly/32CBsoq>; Natural Resources Canada (undated). Energy and the Economy. <https://bit.ly/35YUKq8>; Parliament of Canada (2019). LEGISinfo. Bill C-48. <https://bit.ly/35PjgtB>; Port of Rotterdam (undated) <https://bit.ly/3muuppC>; Port of Vancouver (undated). Safe movement of petroleum products. <https://bit.ly/32K4nXP>; Statistics Canada (2020). Population estimates, quarterly. <https://bit.ly/33CPgP5>; Trans Mountain (undated). Marine Plans, <https://bit.ly/3c8H2ll>; Transport Canada (2018). Transportation in Canada, <https://bit.ly/31z7IZ9>; Transport Canada (2019). Backgrounder on Canada’s port system, 2019, <https://bit.ly/34IglSX>; United States Department of Transportation (undated). Port Performance Freight Statistics Program, Port Profiles, <https://bit.ly/2YGv7Wr>; UNCTAD STAT (undated). Container port throughput, annual, <https://bit.ly/2YF2LMa>; UNCTAD STAT (undated). World seaborne trade by types of cargo and by group of economies, annual, <https://bit.ly/2G4WXp5>; UNCTAD (2019), Review of Maritime Transport, 2019, <https://bit.ly/3lrRBnO>; U.S. Energy Information Administration, International, Petroleum and Other Liquids, (undated) <https://bit.ly/3mtjqN7>; World Population Review (2020). Malaysia. <https://bit.ly/2RBdcwr>; World Shipping Council (Undated). About the Industry, <https://bit.ly/31yKtOD>.
Creative Commons Copyright
Research and data from the Canadian Energy Centre (CEC) is available for public usage under creative commons copyright terms with attribution to the CEC. Attribution and specific restrictions on usage including non-commercial use only and no changes to material should follow guidelines enunciated by Creative Commons here: Attribution-NonCommercial-NoDerivs CC BY-NC-ND.