Social
This CEC Research Brief (which can be downloaded here as a pdf) highlights natural gas trends worldwide from 2000 to 2017 (the latest year for which comprehensive annual data are available from the US Energy Administration). It does so by:
First, showing worldwide trends in those years by consumption, production, imports and exports;
Second, offering comparisons of trends over the 18-year period among the top ten countries (as of 2017) in each of the following categories: consumption, production, imports and exports;
Third, comparing Canada’s annual exports of natural gas from 2000 to 2017 with the trend in natural gas exports from five other countries: Australia, Norway, Qatar, Russia and the United States.
The data has relevance for Canadians given the growing importance of natural gas to heat and power communities worldwide, and the vast potential of Canada’s natural gas resources. The data also has relevance given domestic debate over natural gas production and export, including the construction of pipelines, as well as global greenhouse gas emissions.¹
1. The discussion regarding natural gas production and exports also has relevance for
particulate emissions, i.e., the degree that liquefied natural gas (LNG), can reduce
particulate emissions in selected countries, such as China, that currently has significant
particulate pollution. It is beyond the scope of this Research Brief to analyze such claims.
Five snapshots of worldwide natural gas trends 2000 to 2017
——————————————————————————————————————————————————————
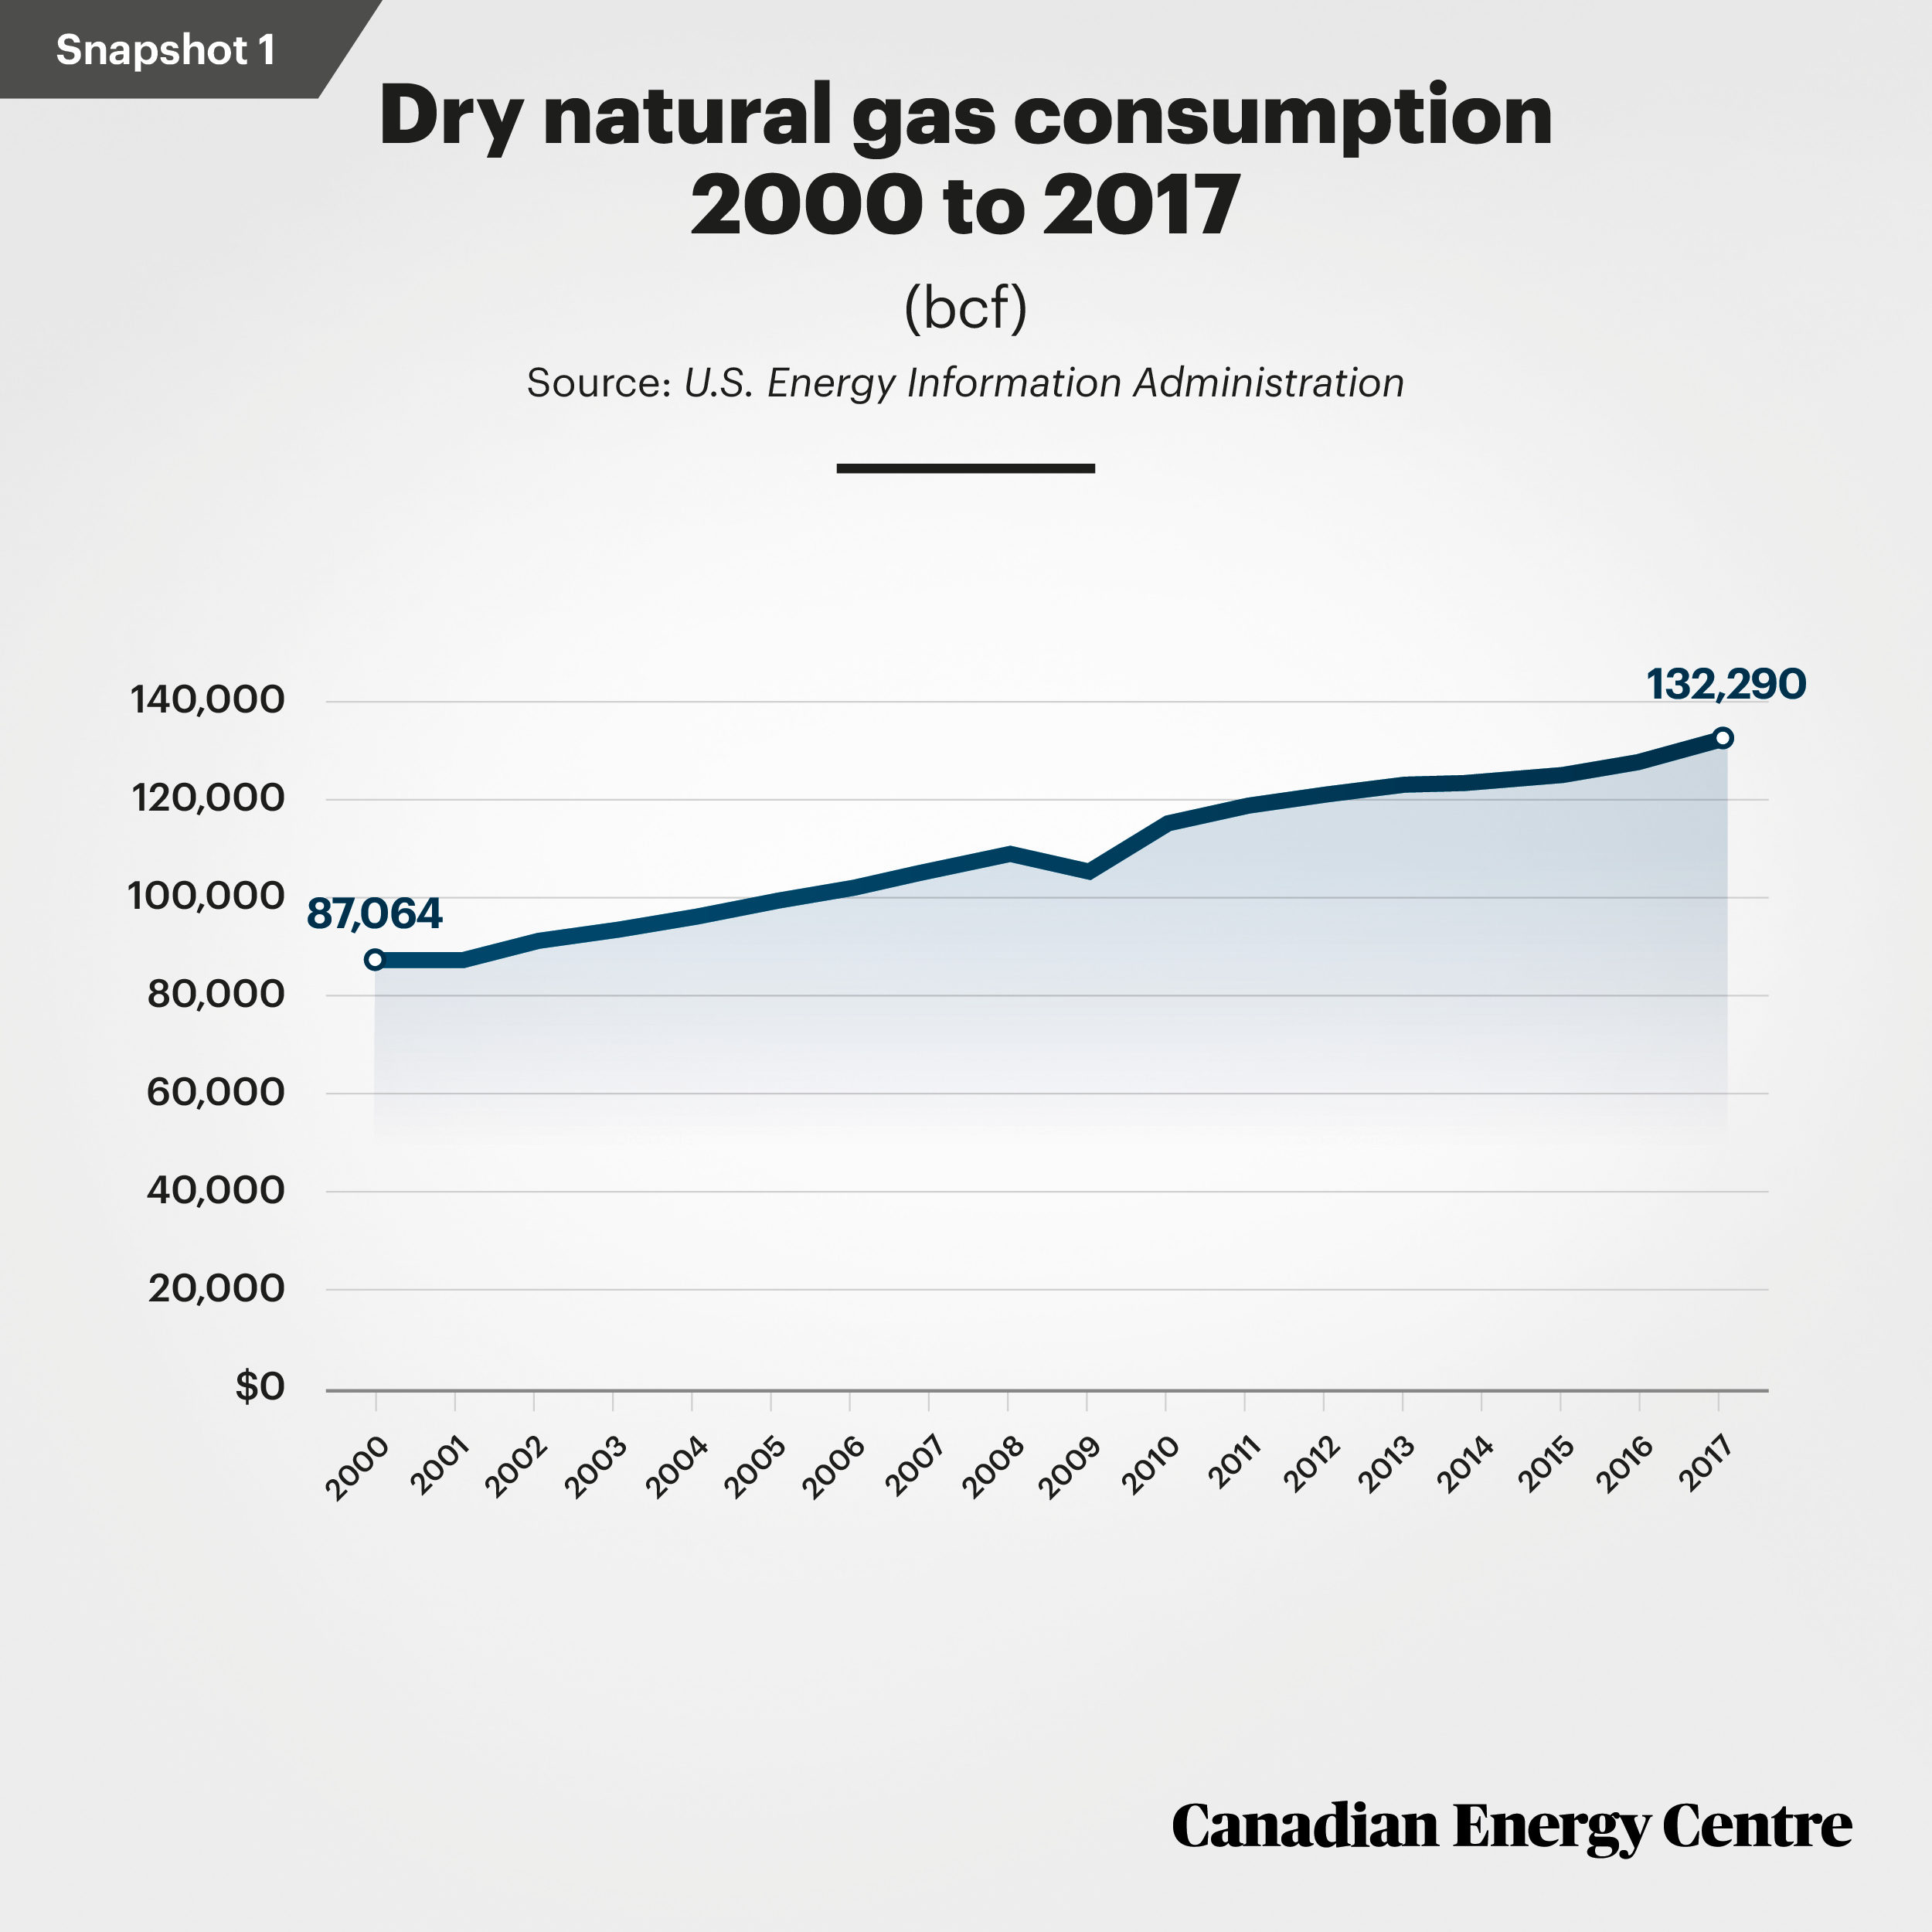
Snapshot One: Dry natural gas consumption
The worldwide consumption of dry natural gas has risen continually and significantly since 2000, with the exception of the 2008/09 recession.
Source: U.S. Energy Information Administration
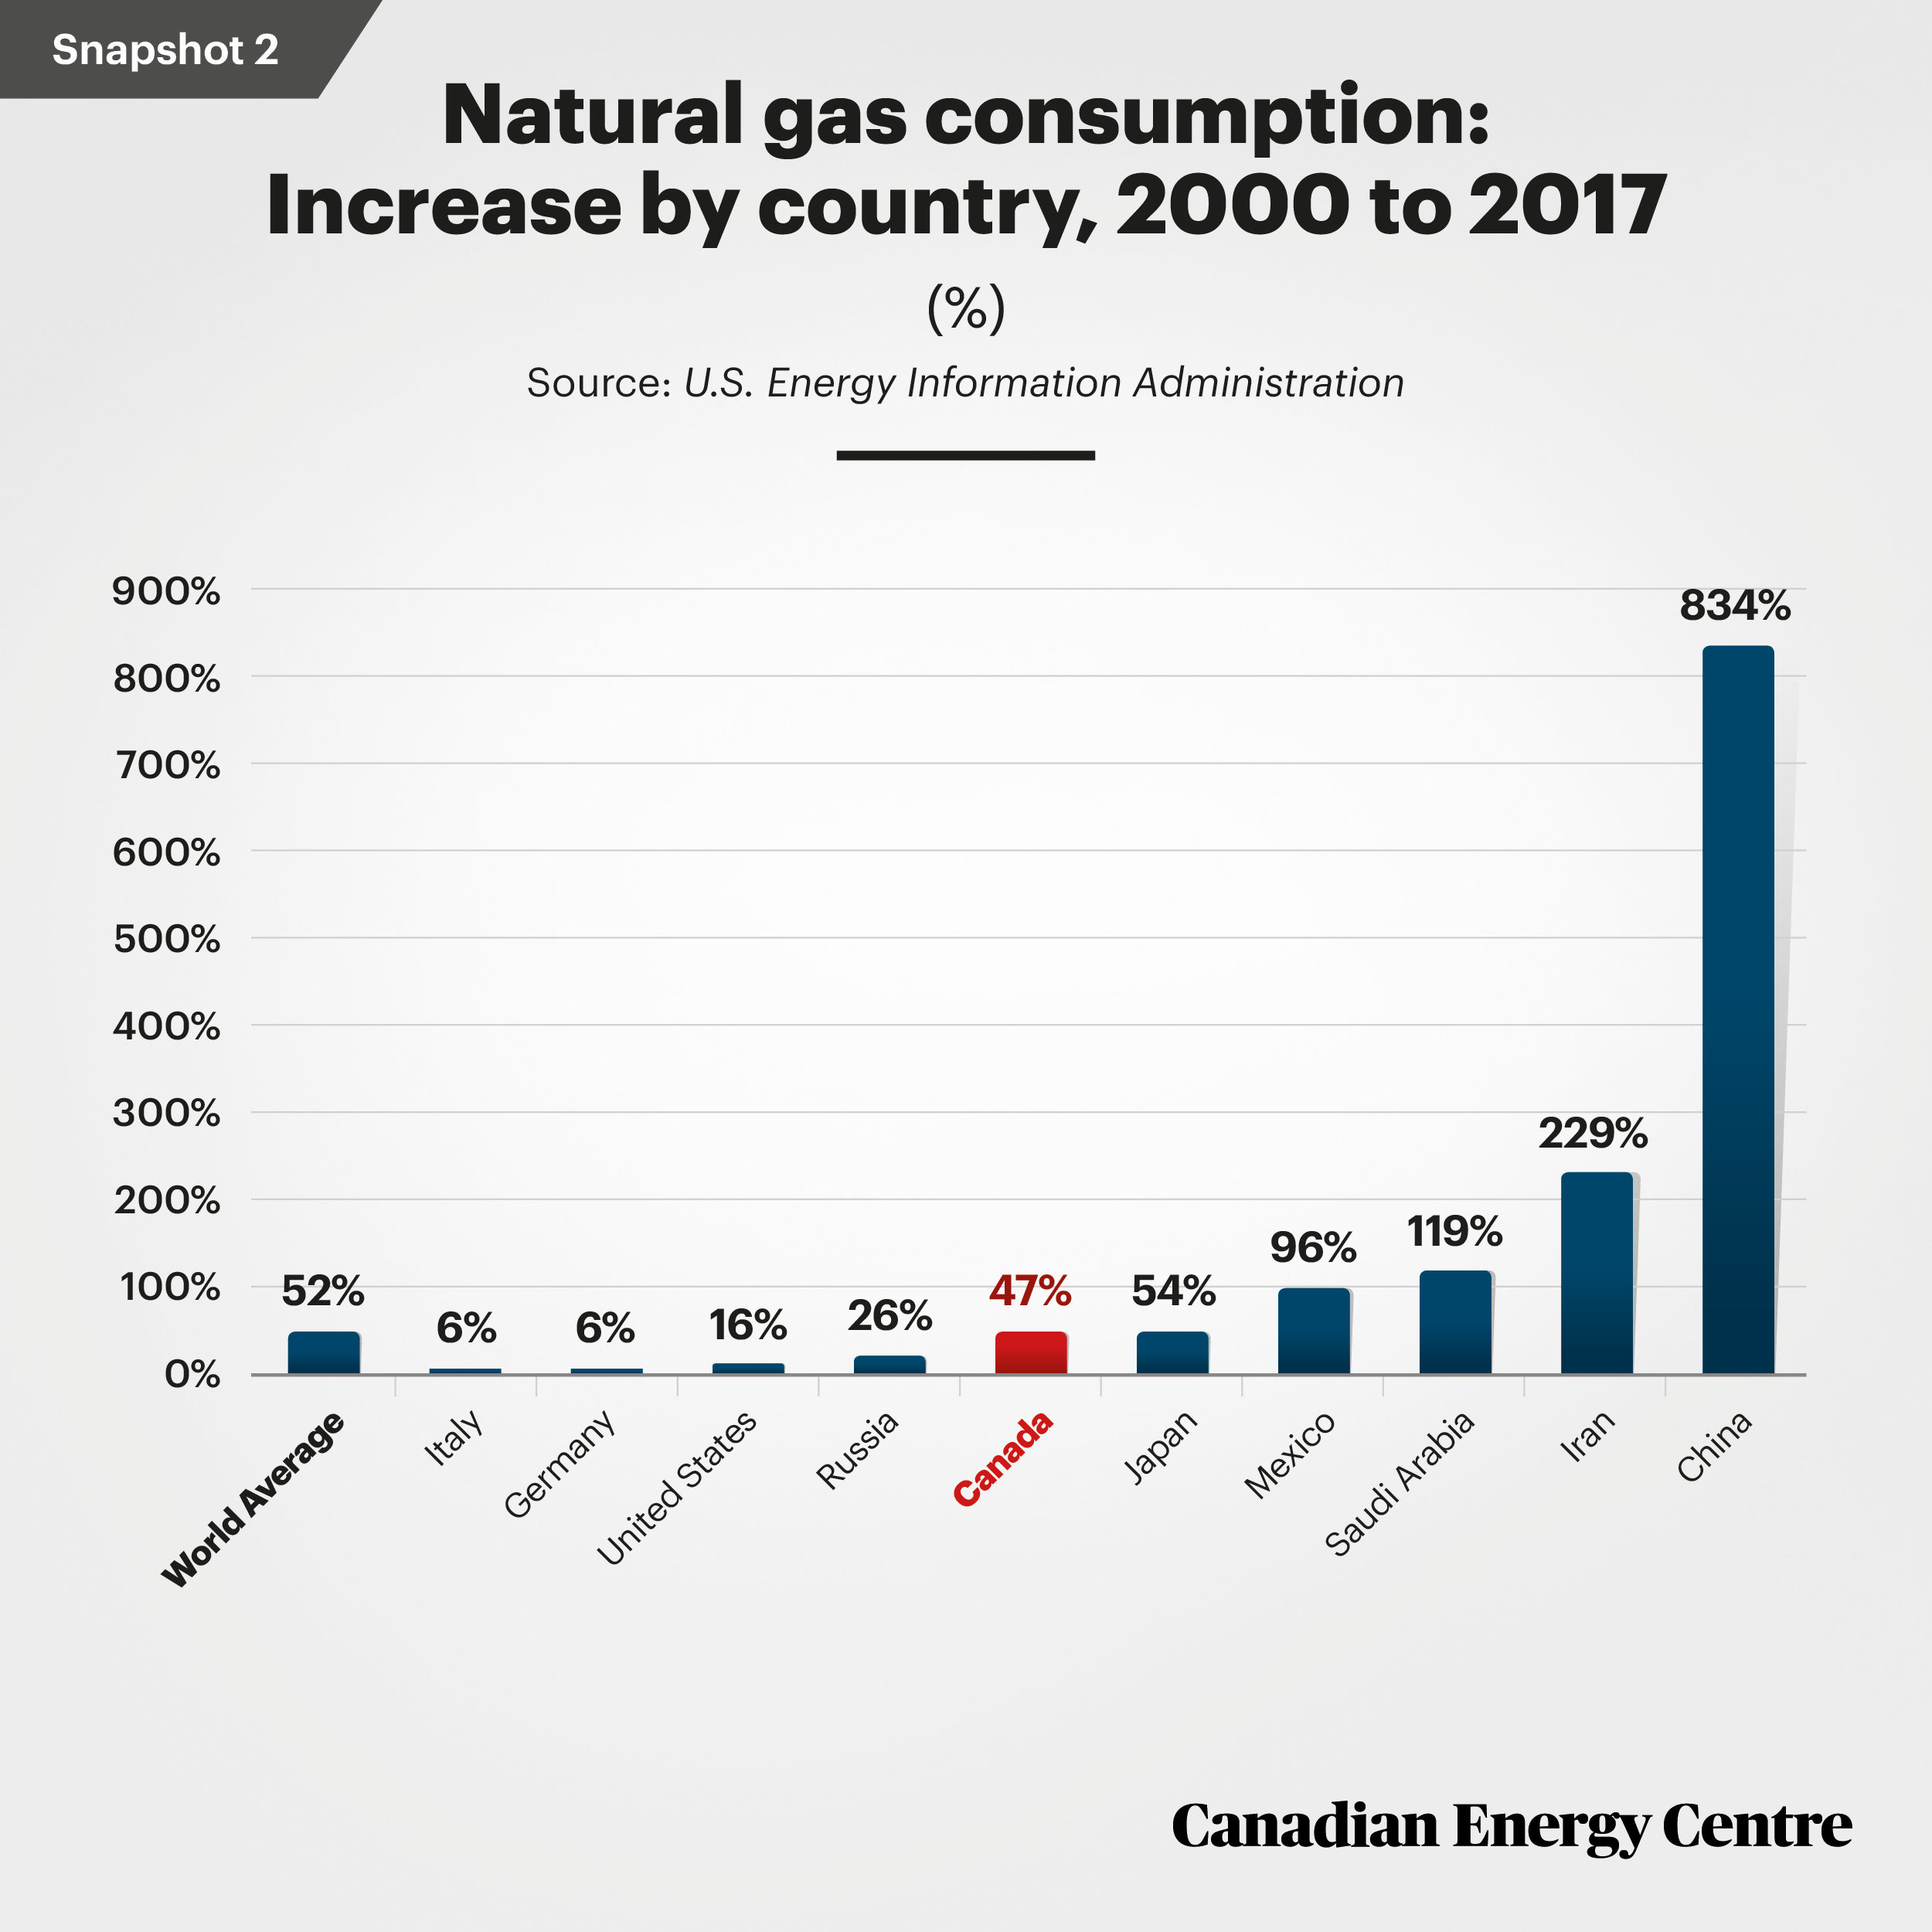
Snapshot Two: Natural gas consumption by country
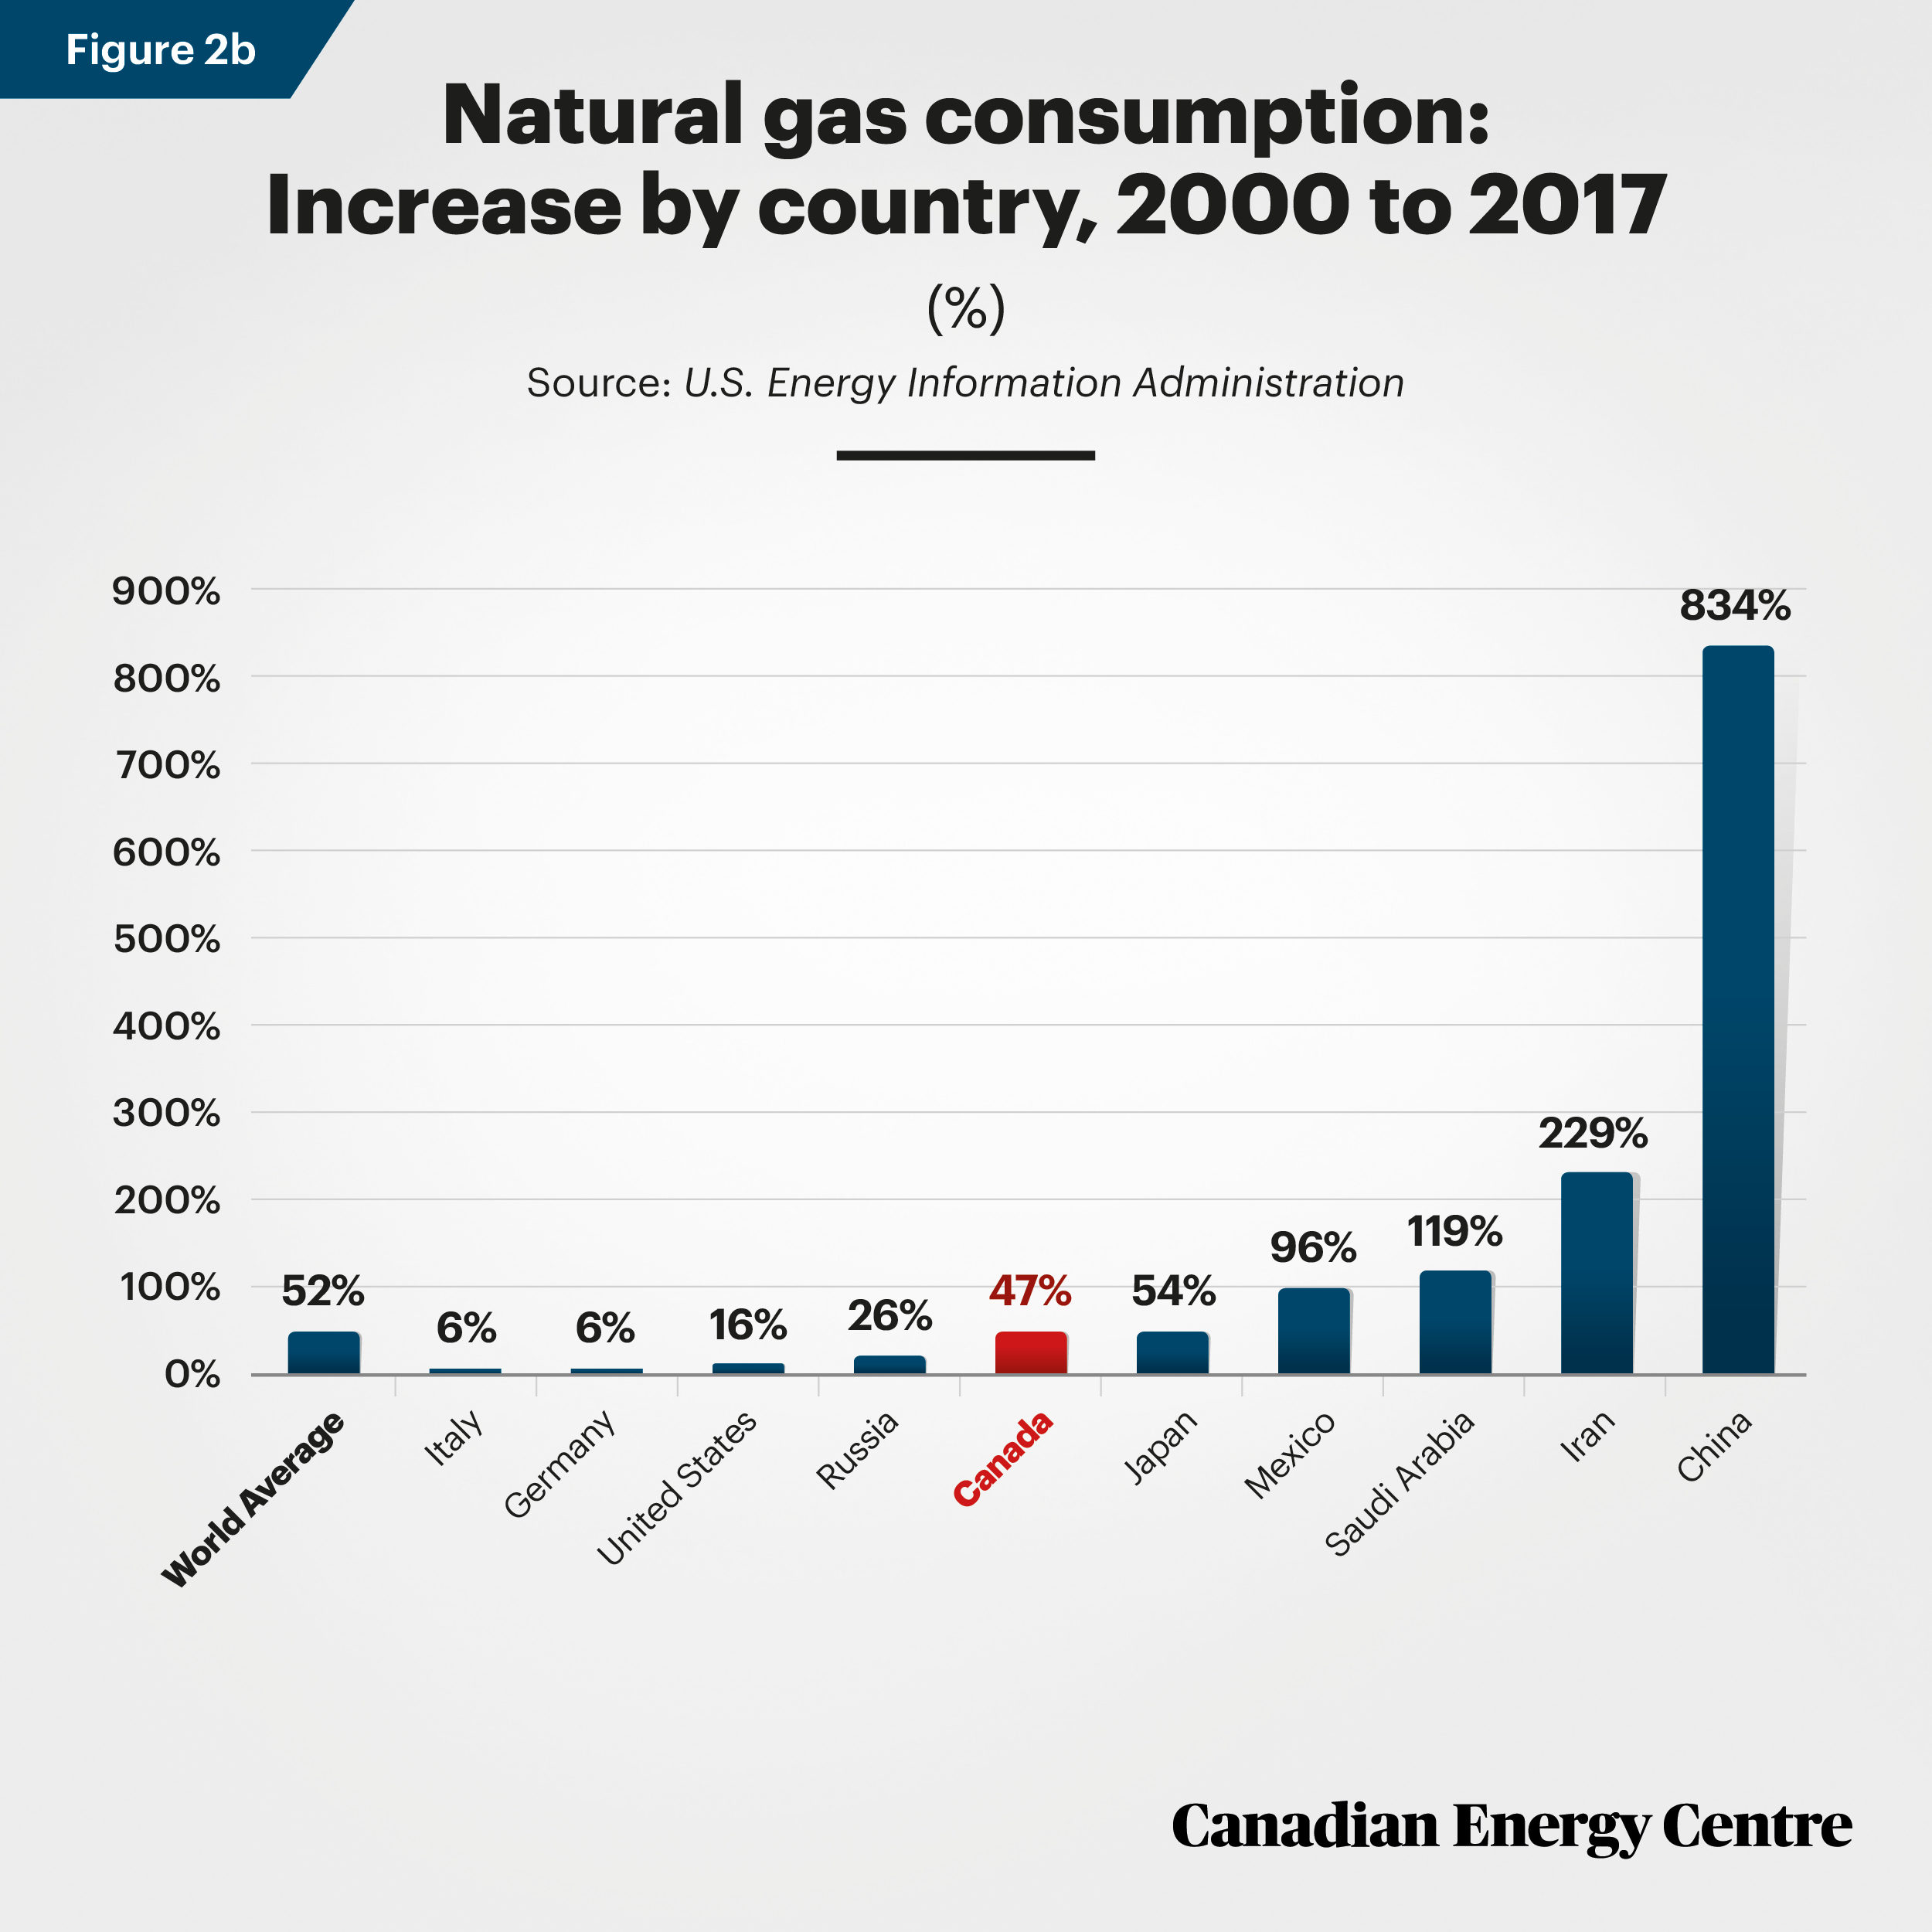
Worldwide, there has been a 52 per cent increase in natural gas consumption between 2000 and 2017. Canada’s consumption is below that average (47 per cent) while Japan (54 per cent) Mexico (96 per cent), Saudi Arabia (119 per cent), Iran (229 per cent) and China (834 per cent) have higher rates of consumption increases than the world average.
Source: U.S. Energy Information Administration
Snapshot Three: Natural gas production
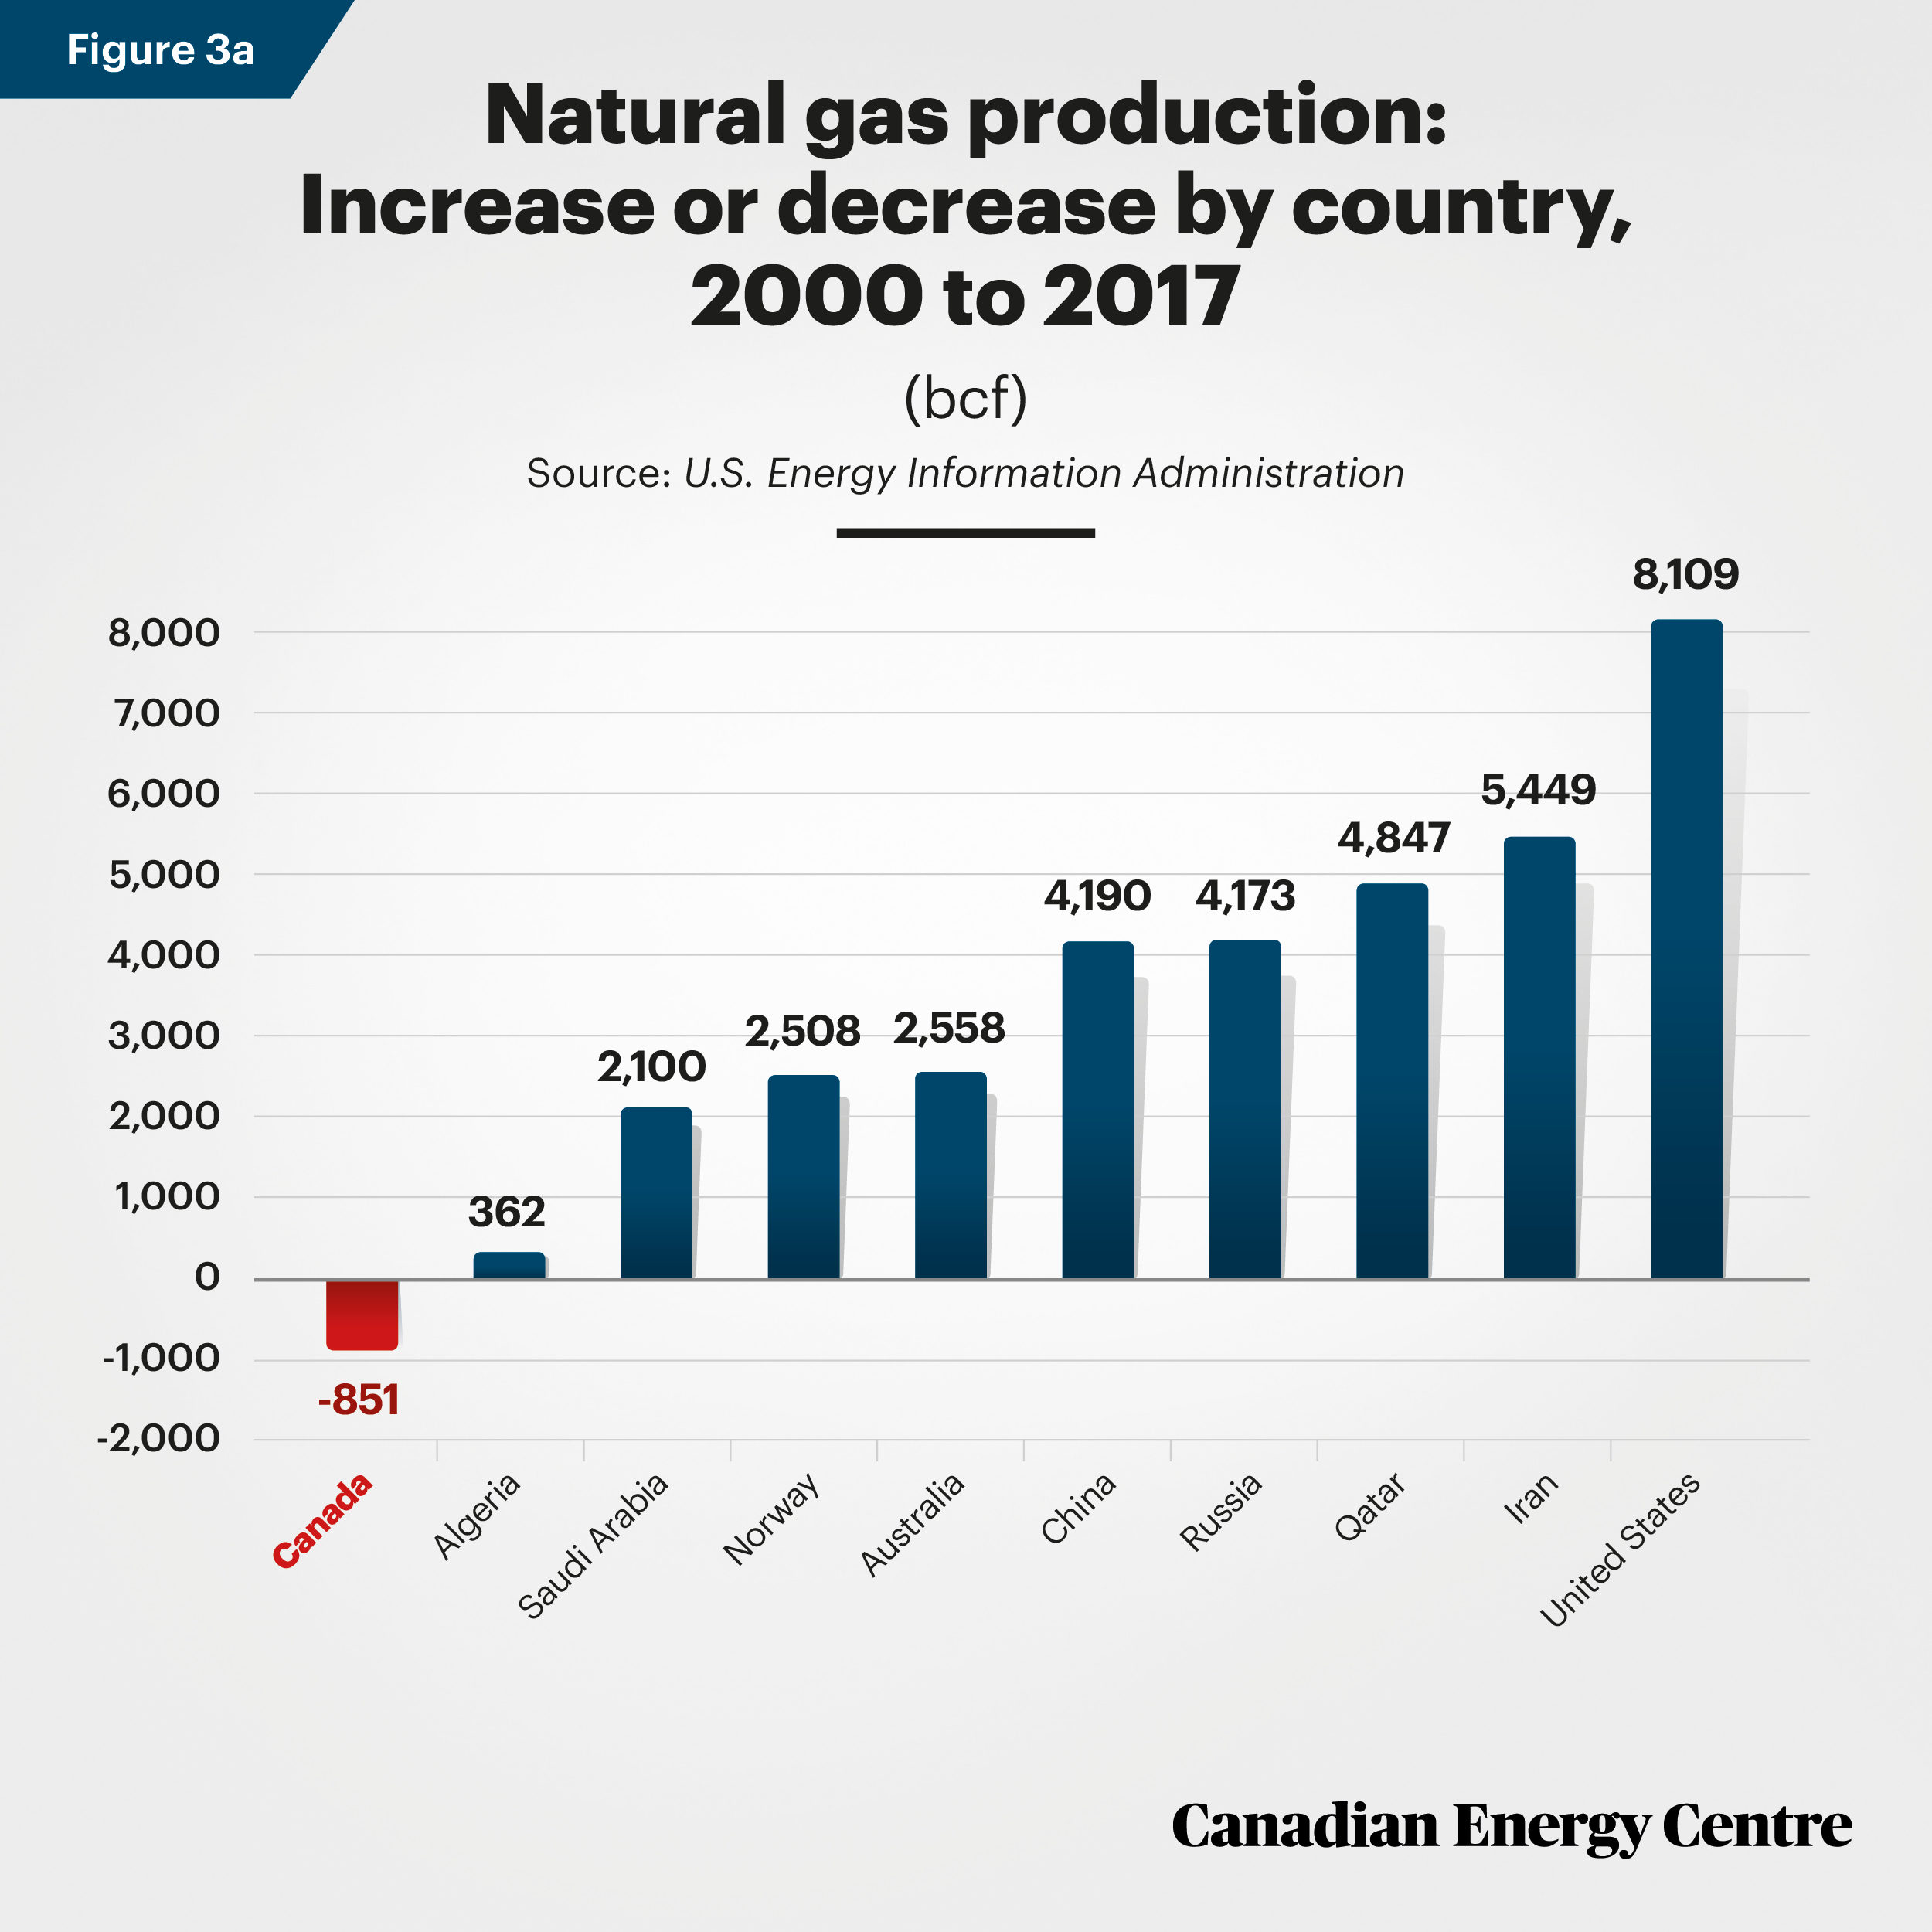
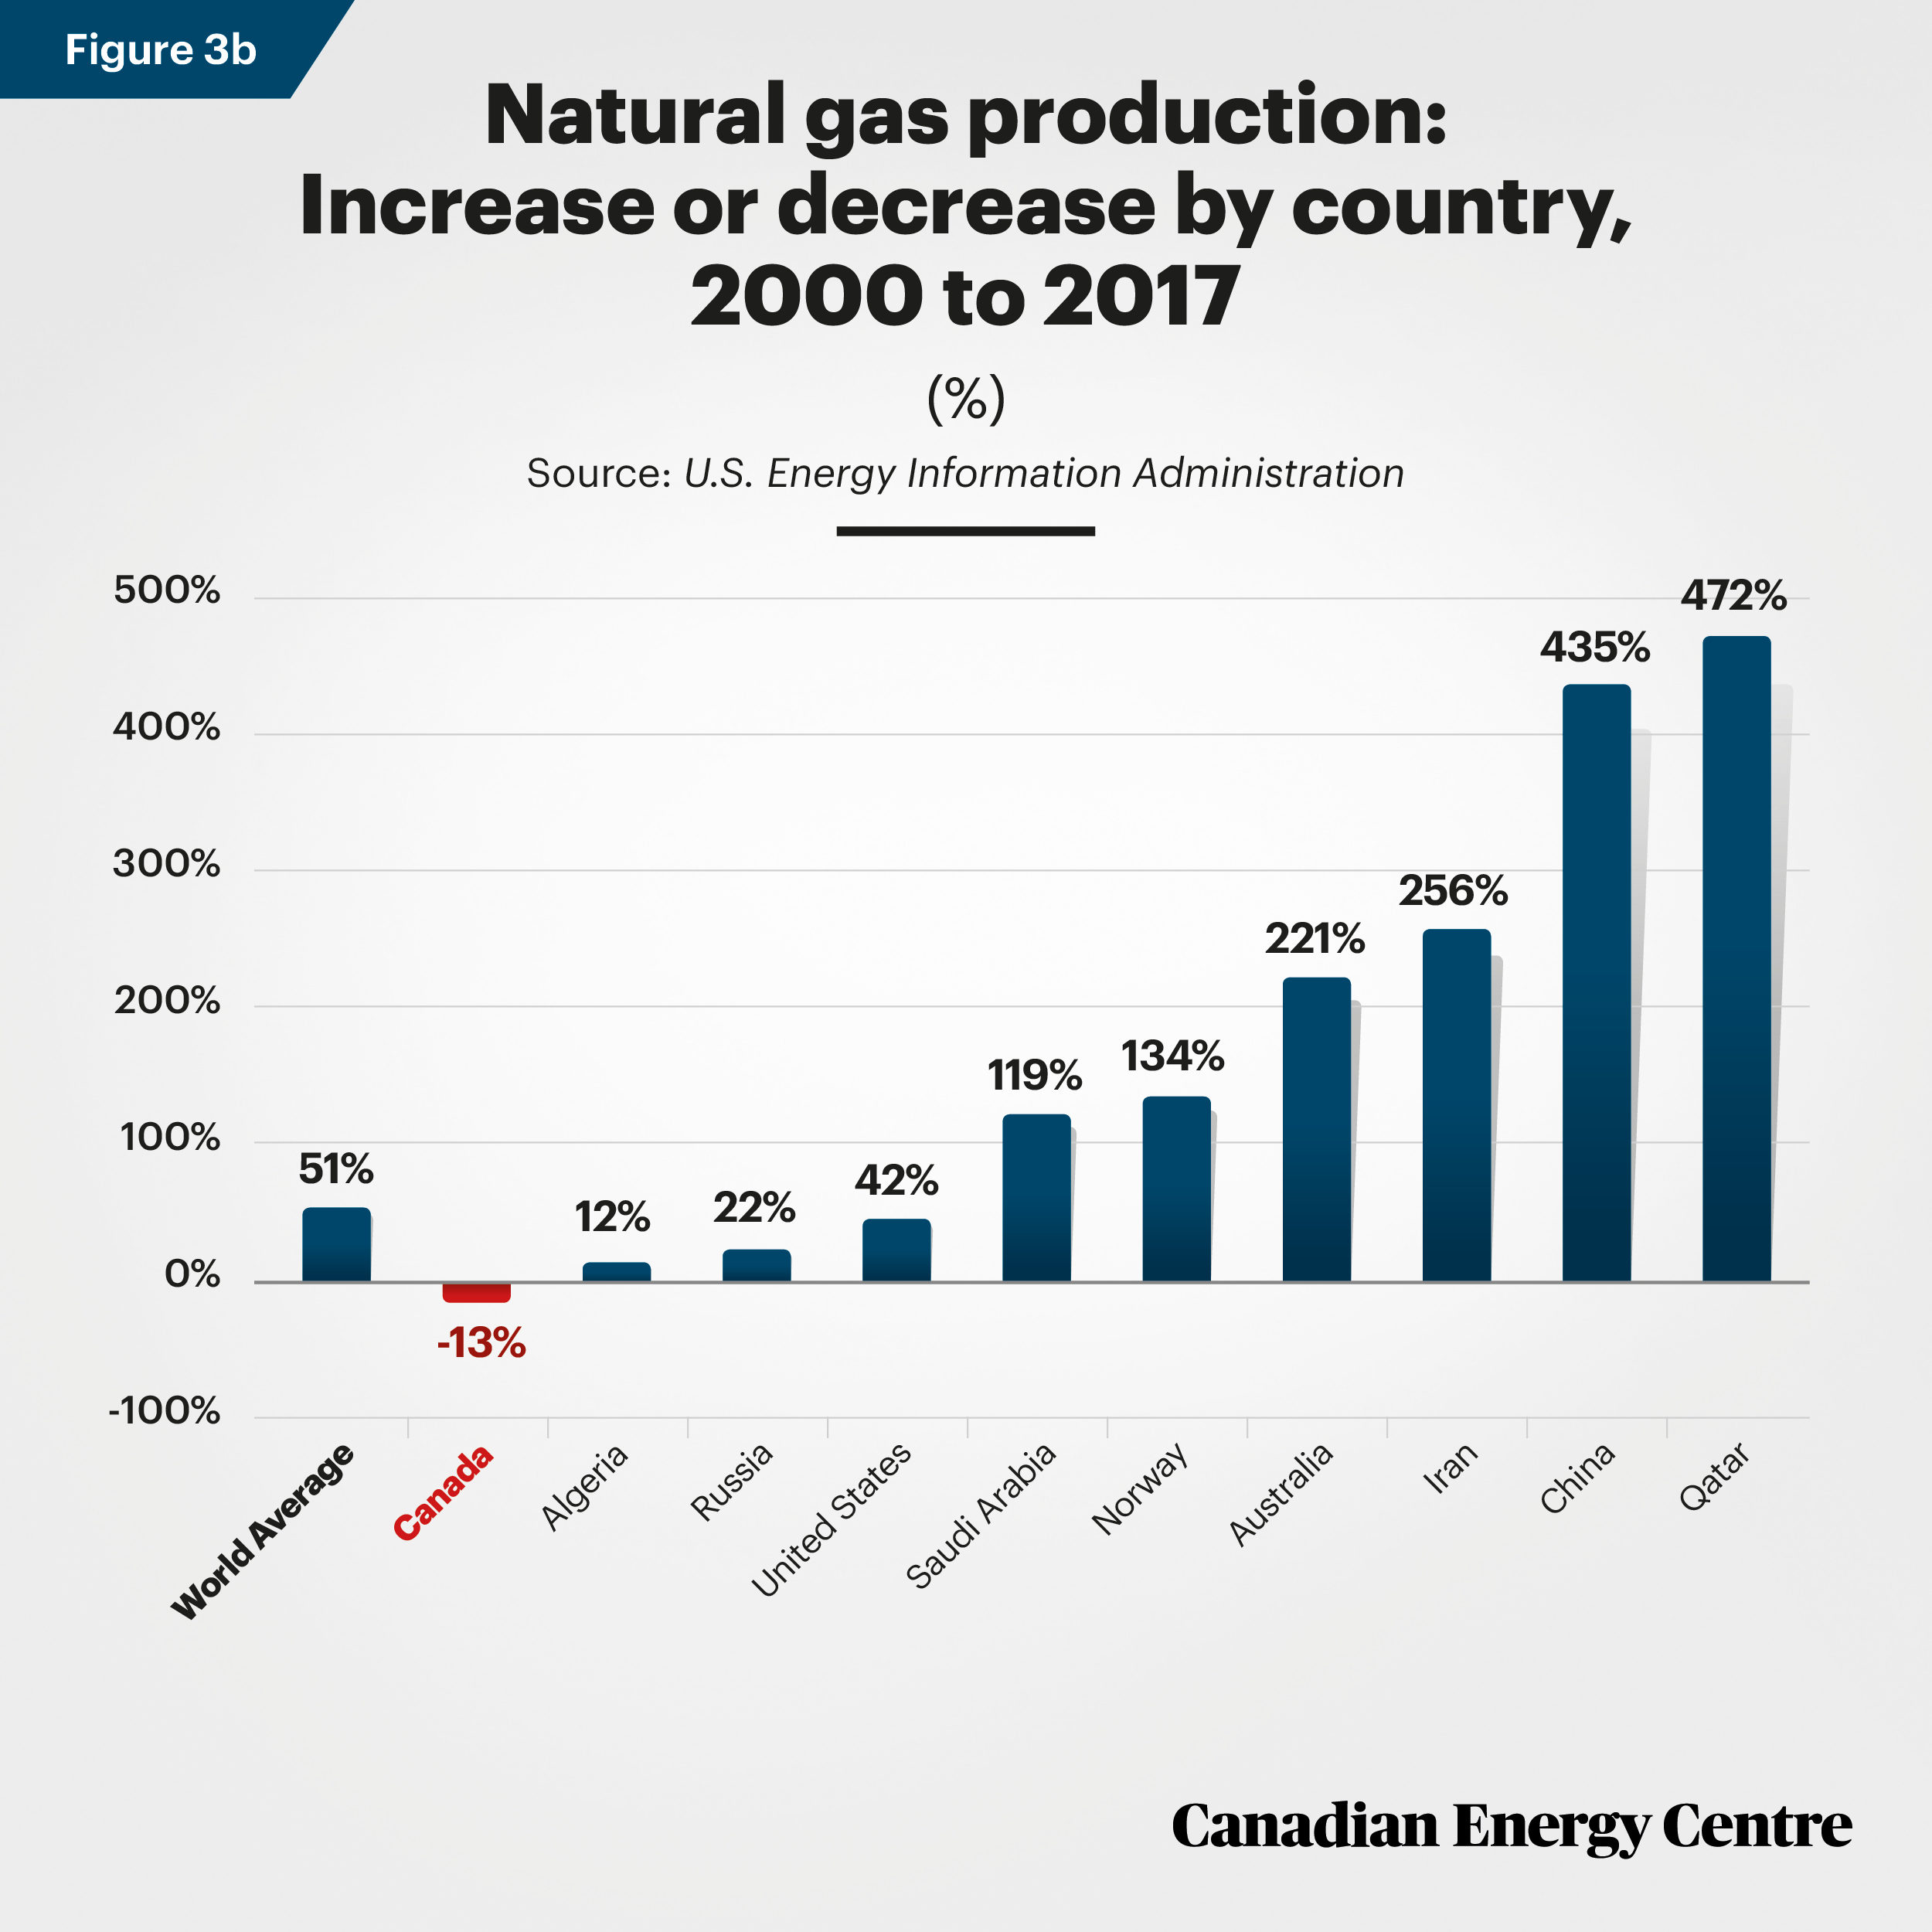
Of the top ten natural gas producing countries in 2017 relative to 2000, only Canada produced less in absolute terms (851 billion cubic feet (bcf) less, or -13 per cent). Natural gas production in the other nine nations was between 12 per cent higher (Algeria) and 472 per cent higher (Qatar).

Source: U.S. Energy Information Administration
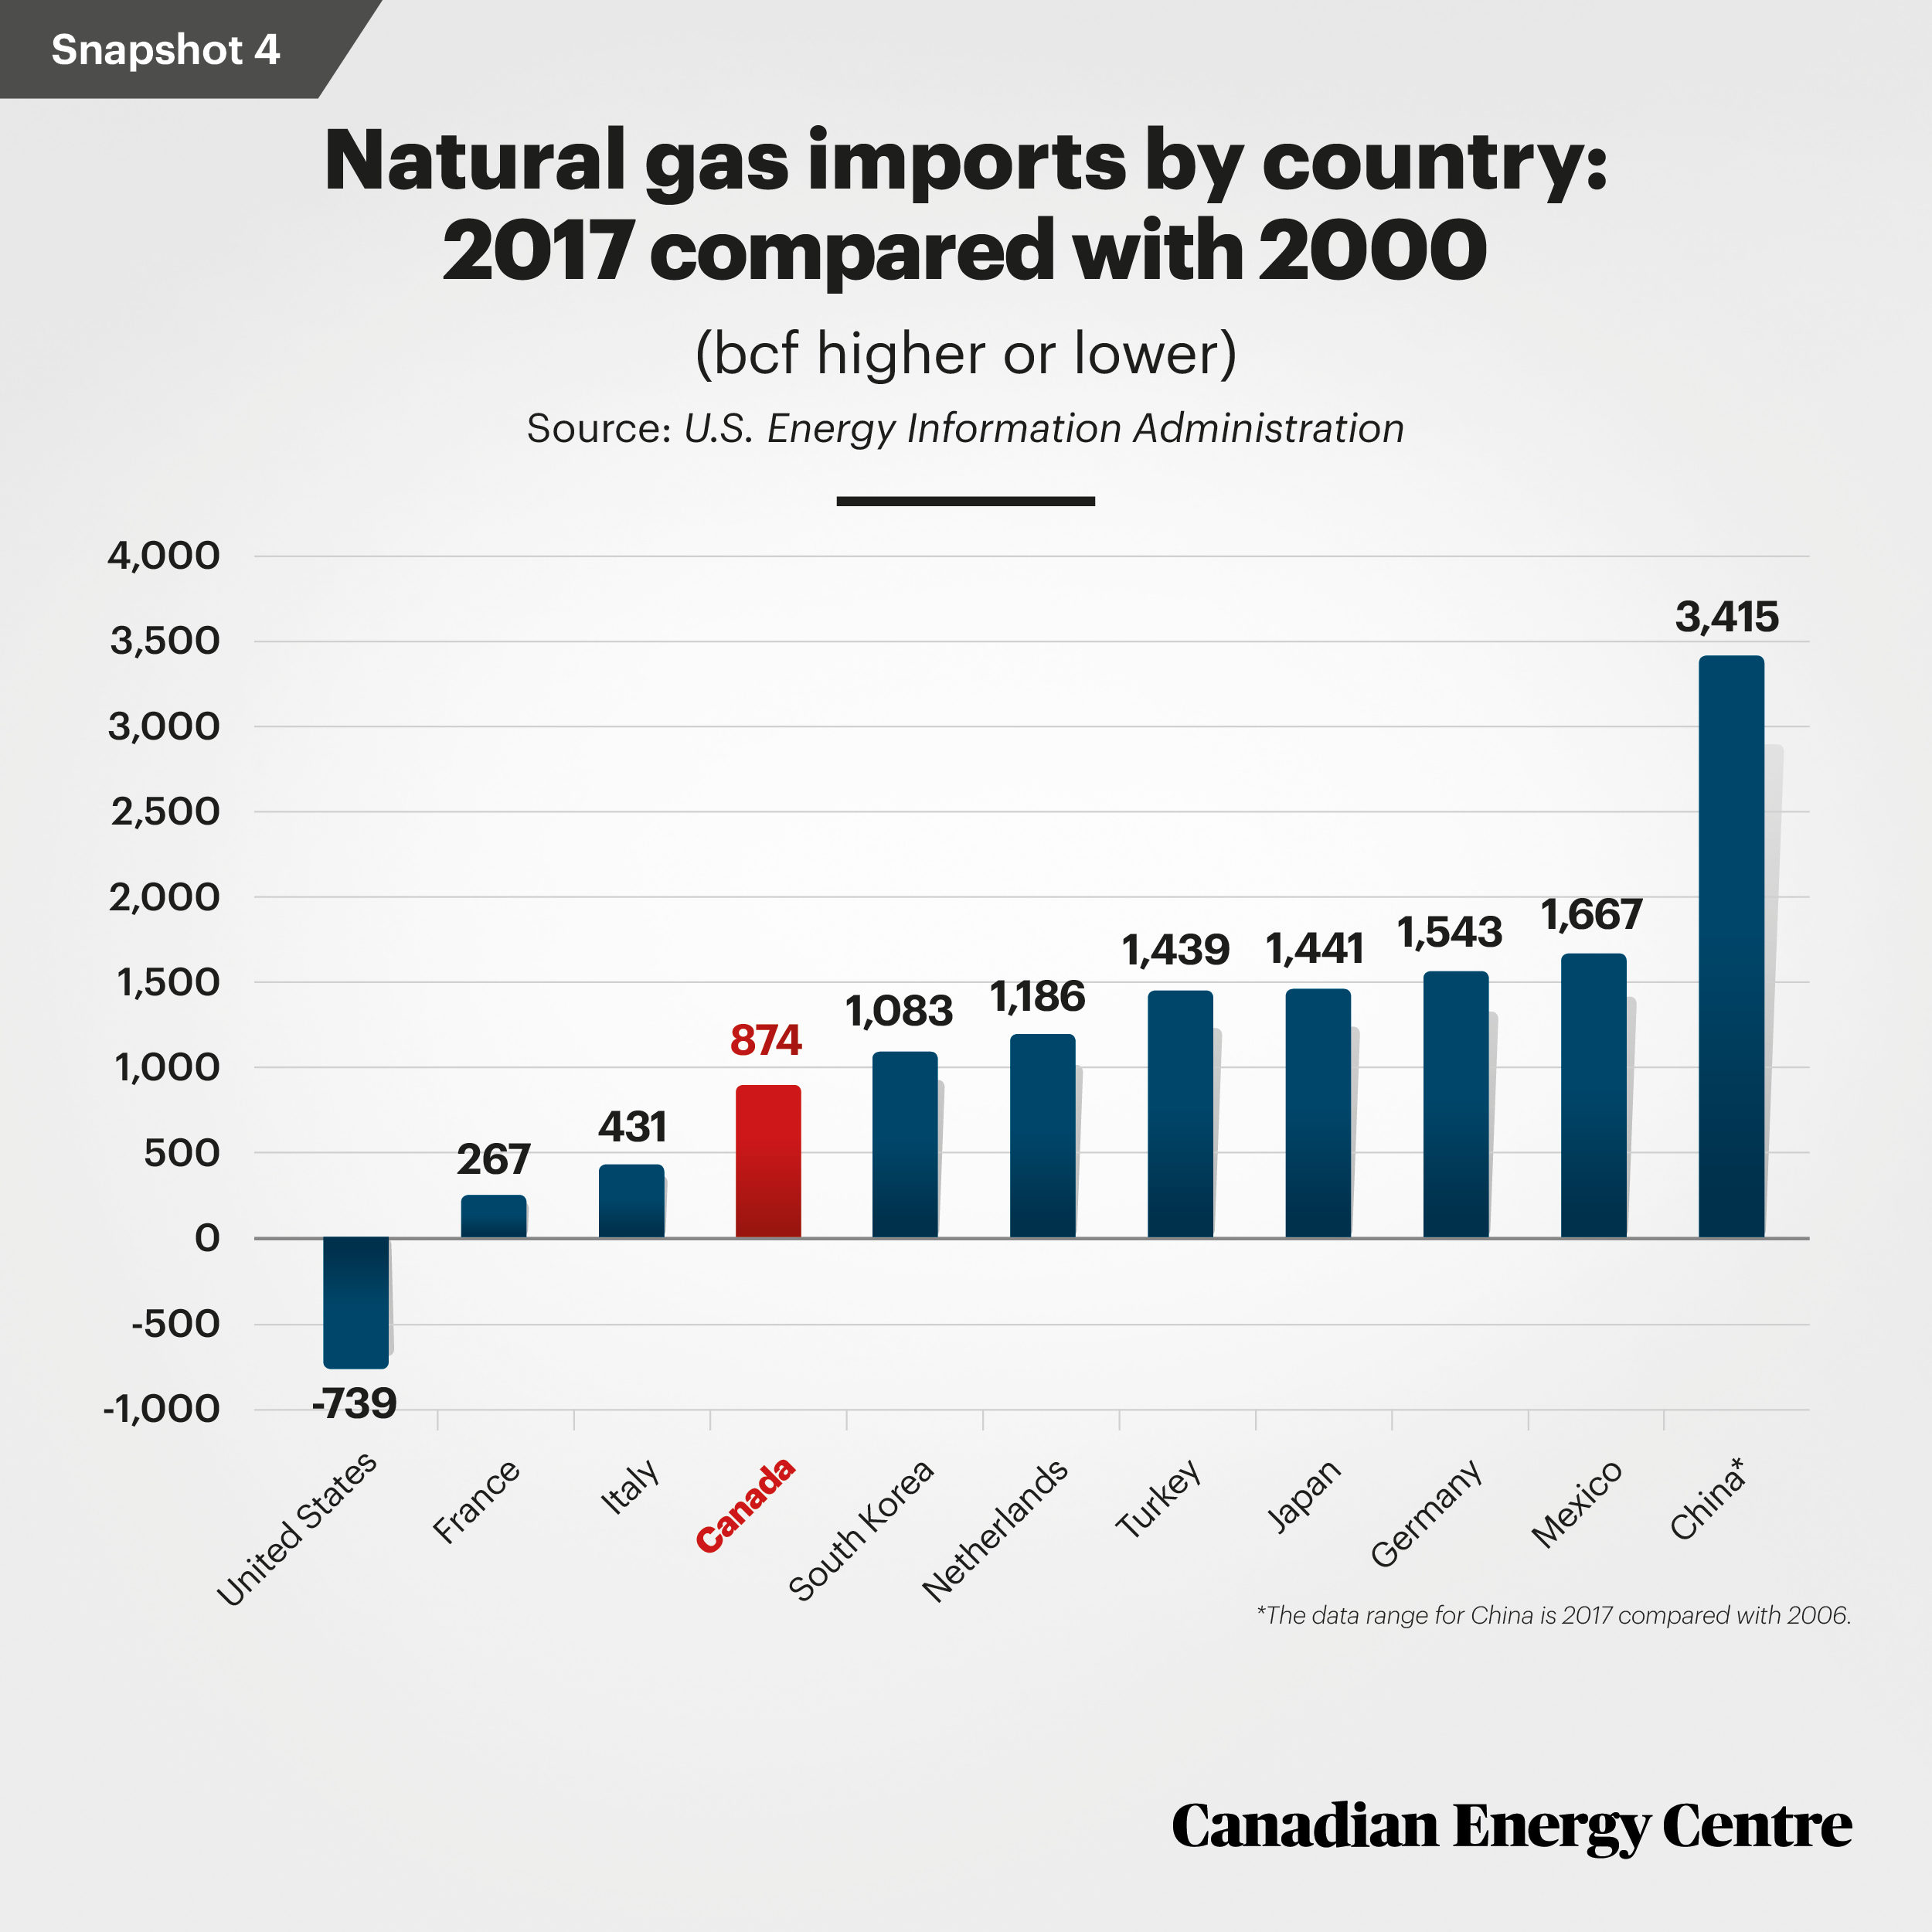
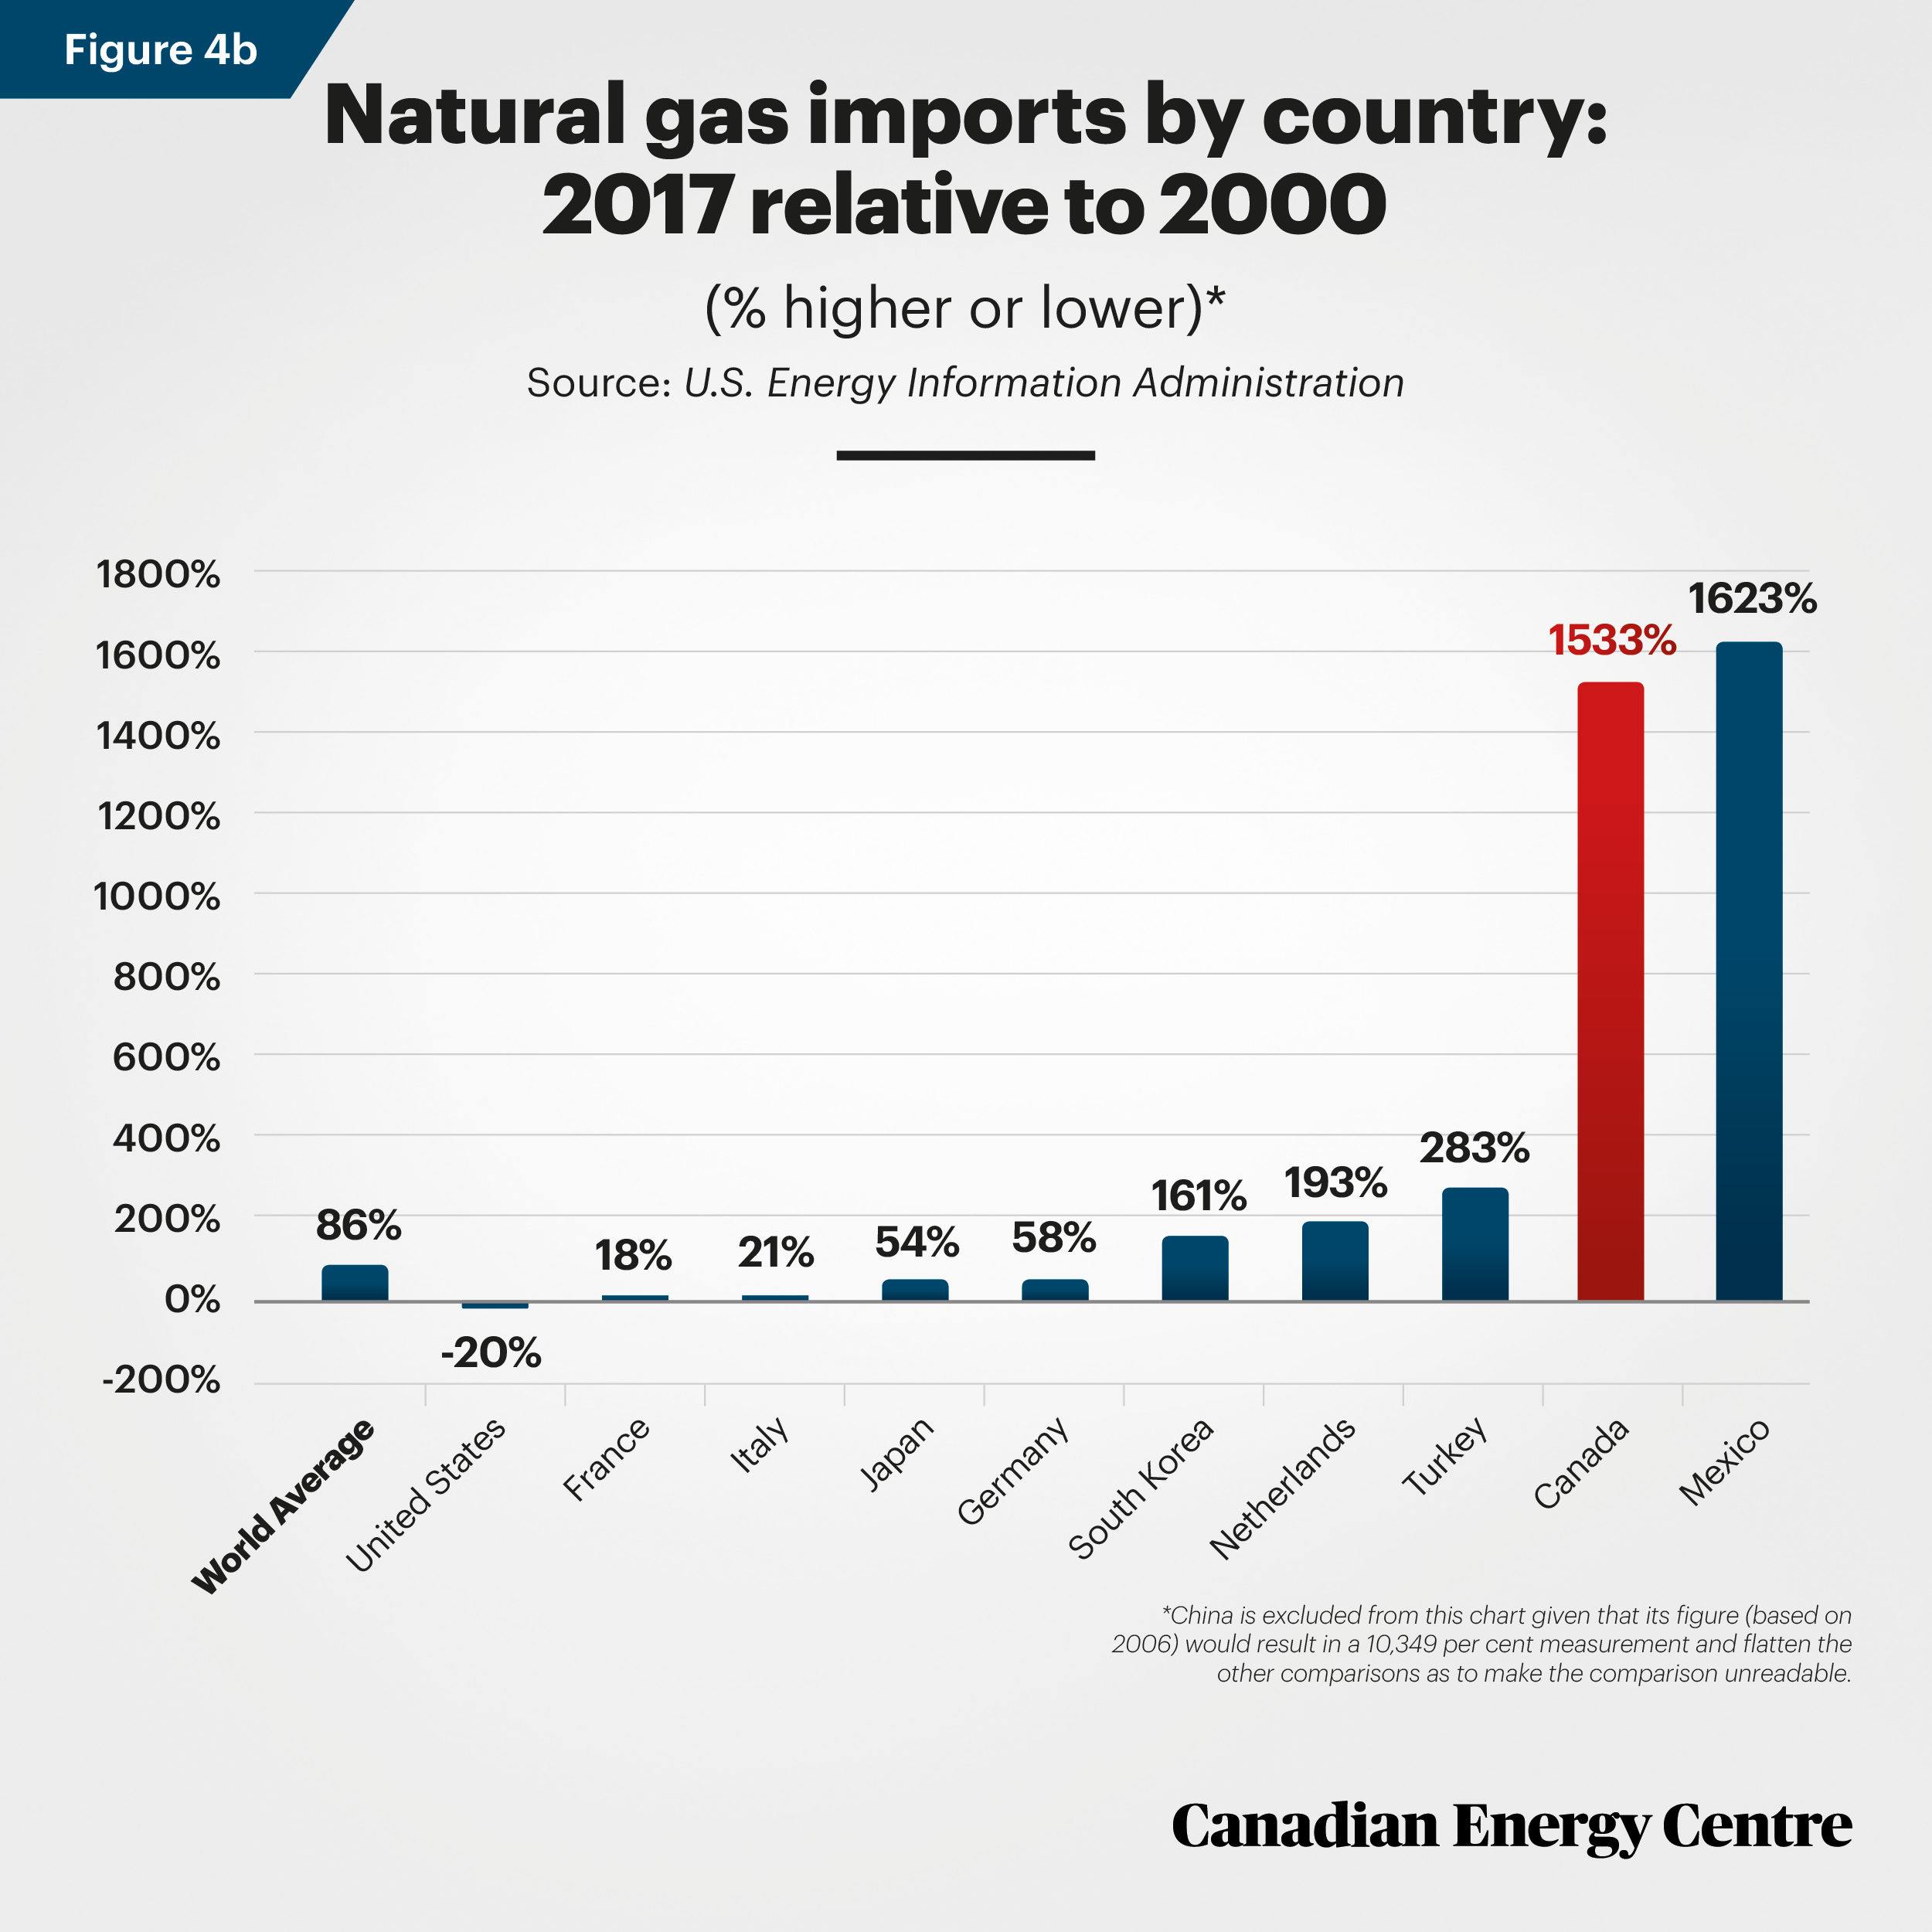
Snapshot Four: Natural gas imports by country
- Natural gas imports rose most in China (3,415 bcf more in 2017 than the 33 bcf imported in 2006, the earliest year available for comparison, or 10,348 per cent).
- With all other countries and a baseline of 2000, Mexico’s imports rose the most – by 1,667 bcf or 1,623 per cent – between 2000 and 2017.
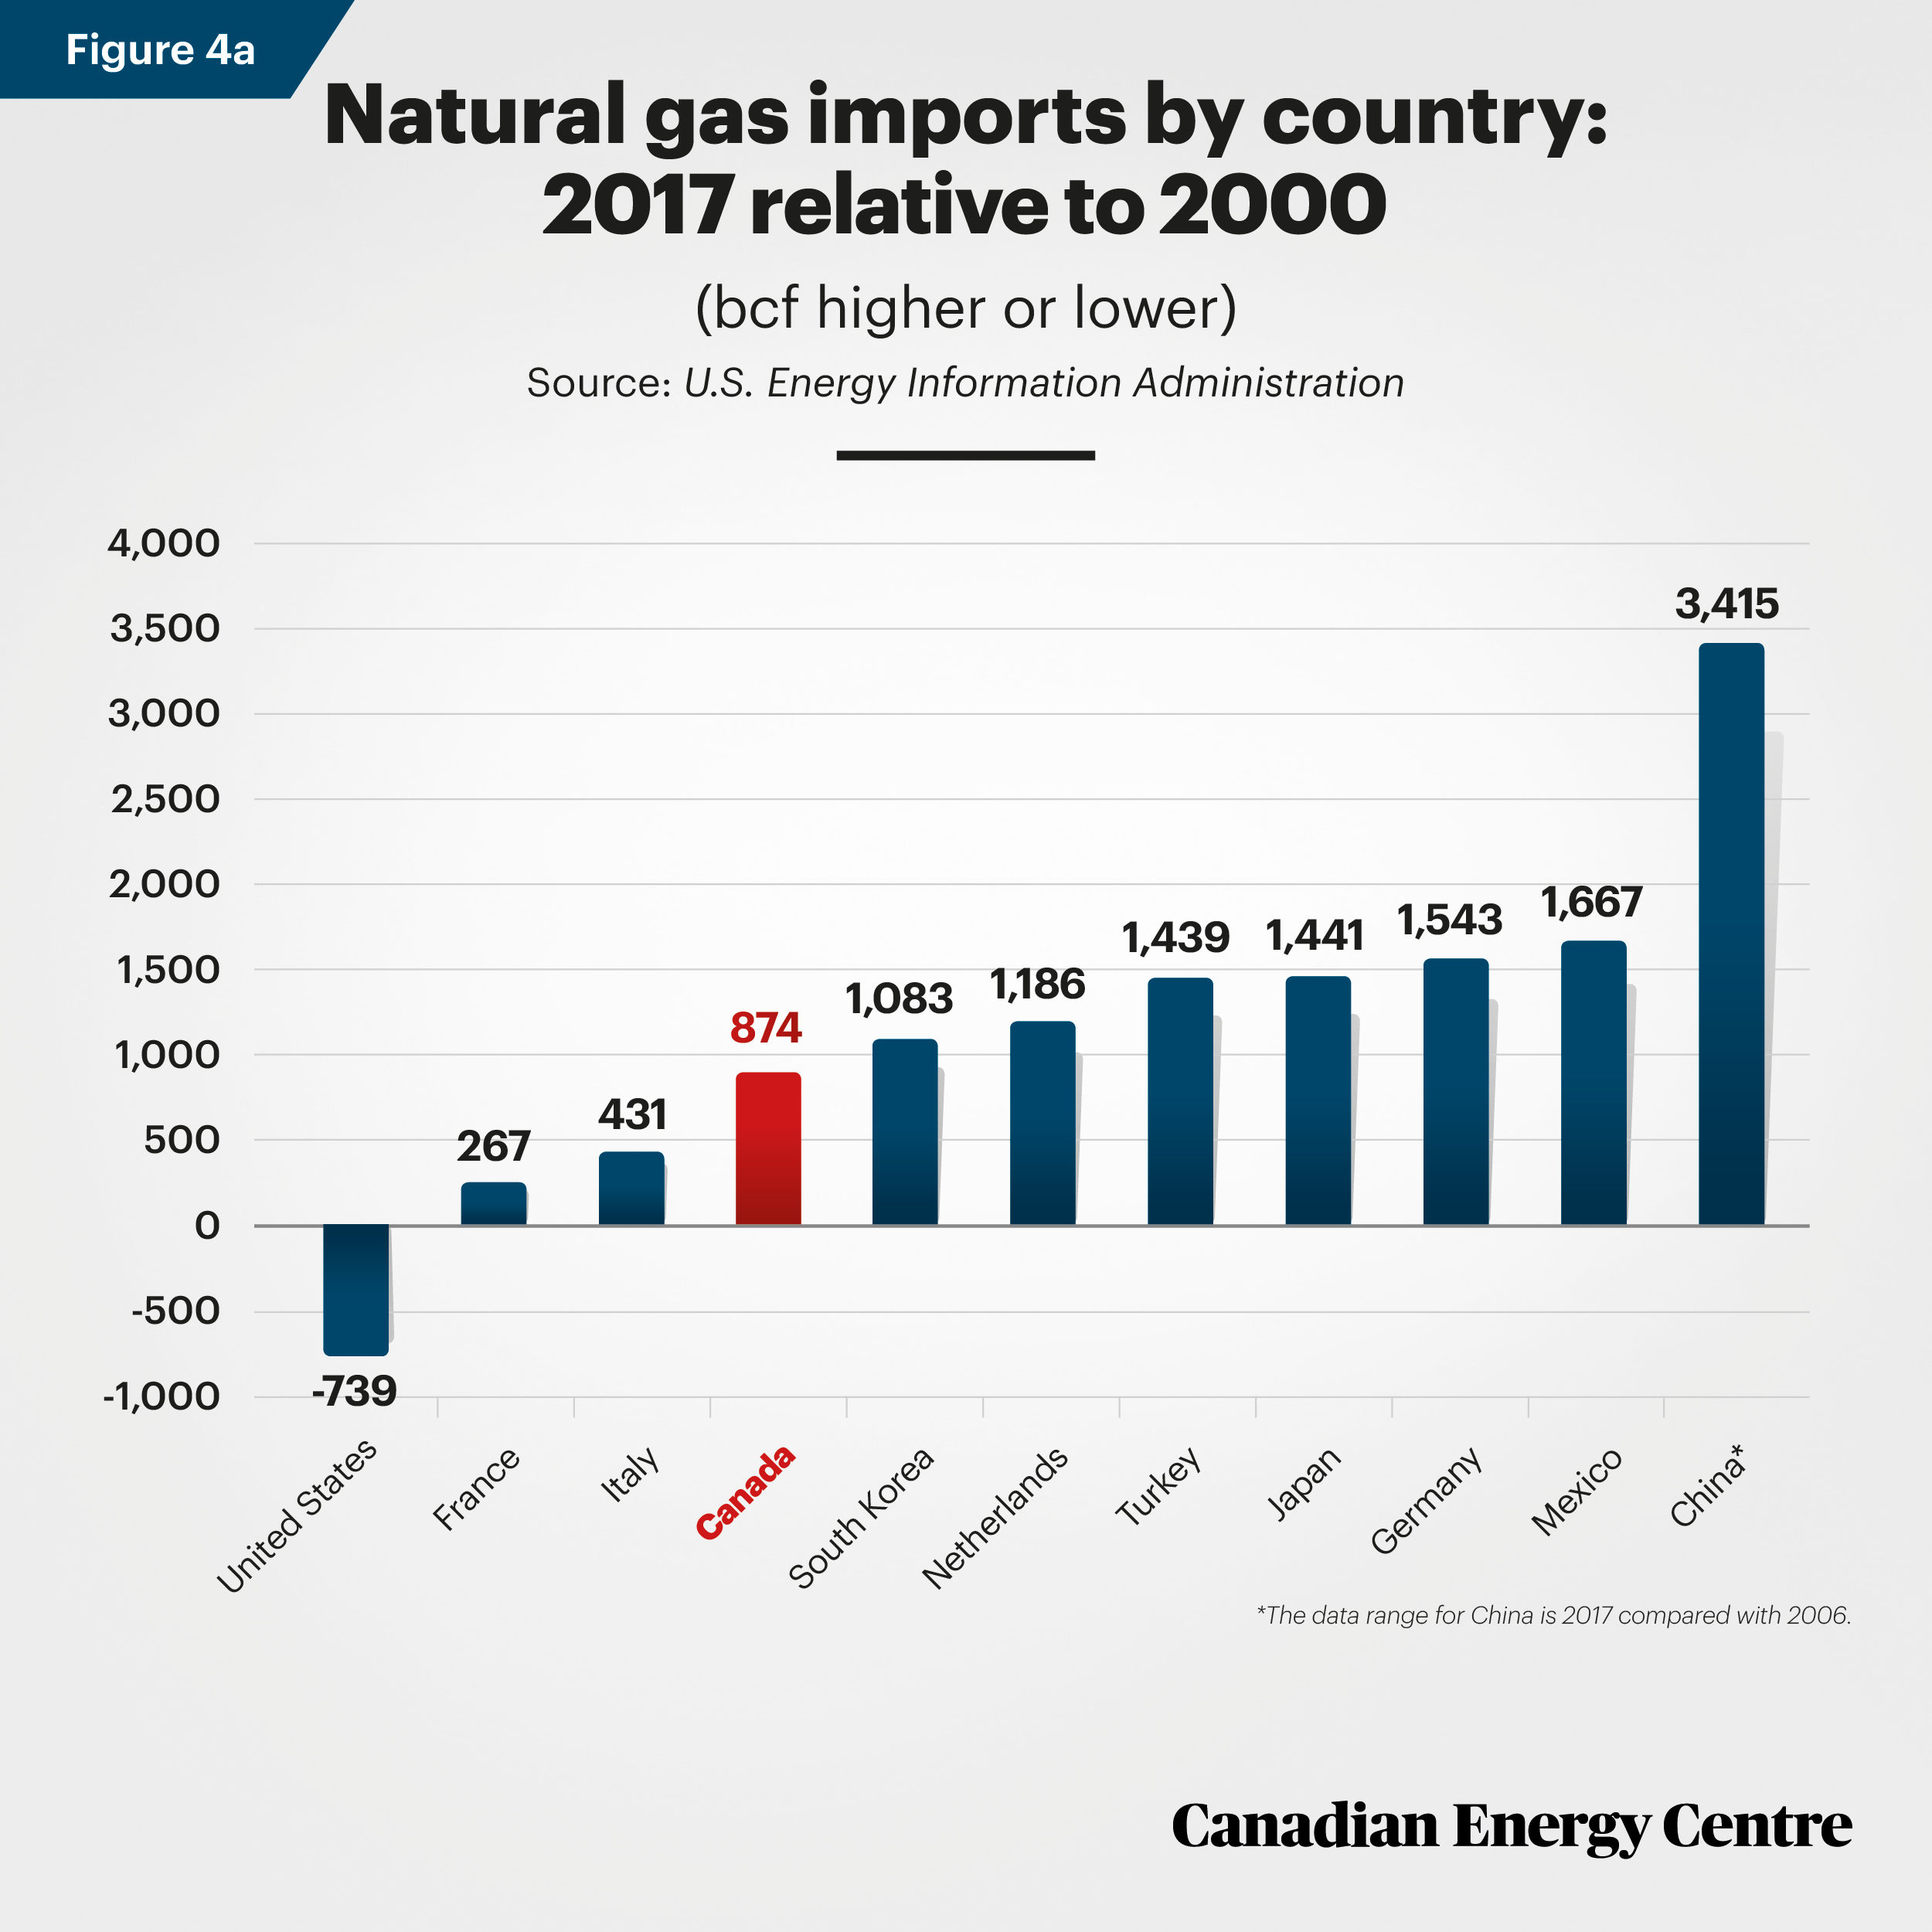
- Canada’s imports of natural gas rose by 874 bcf during this period (and were nominal in 2000 at just 57 bcf).
- Of note, American imports of natural gas were down by 739 bcf annually as of 2017 relative to 2000. (This was due to much higher domestic U.S. production, which soared to 27,291 bcf in 2017, up from 19,182 bcf in 2000, or 42 per cent higher.) The United States thus required significantly less natural gas imports, notably from Canada.
Source: U.S. Energy Information Administration
*The data range for China is 2017 compared with 2006
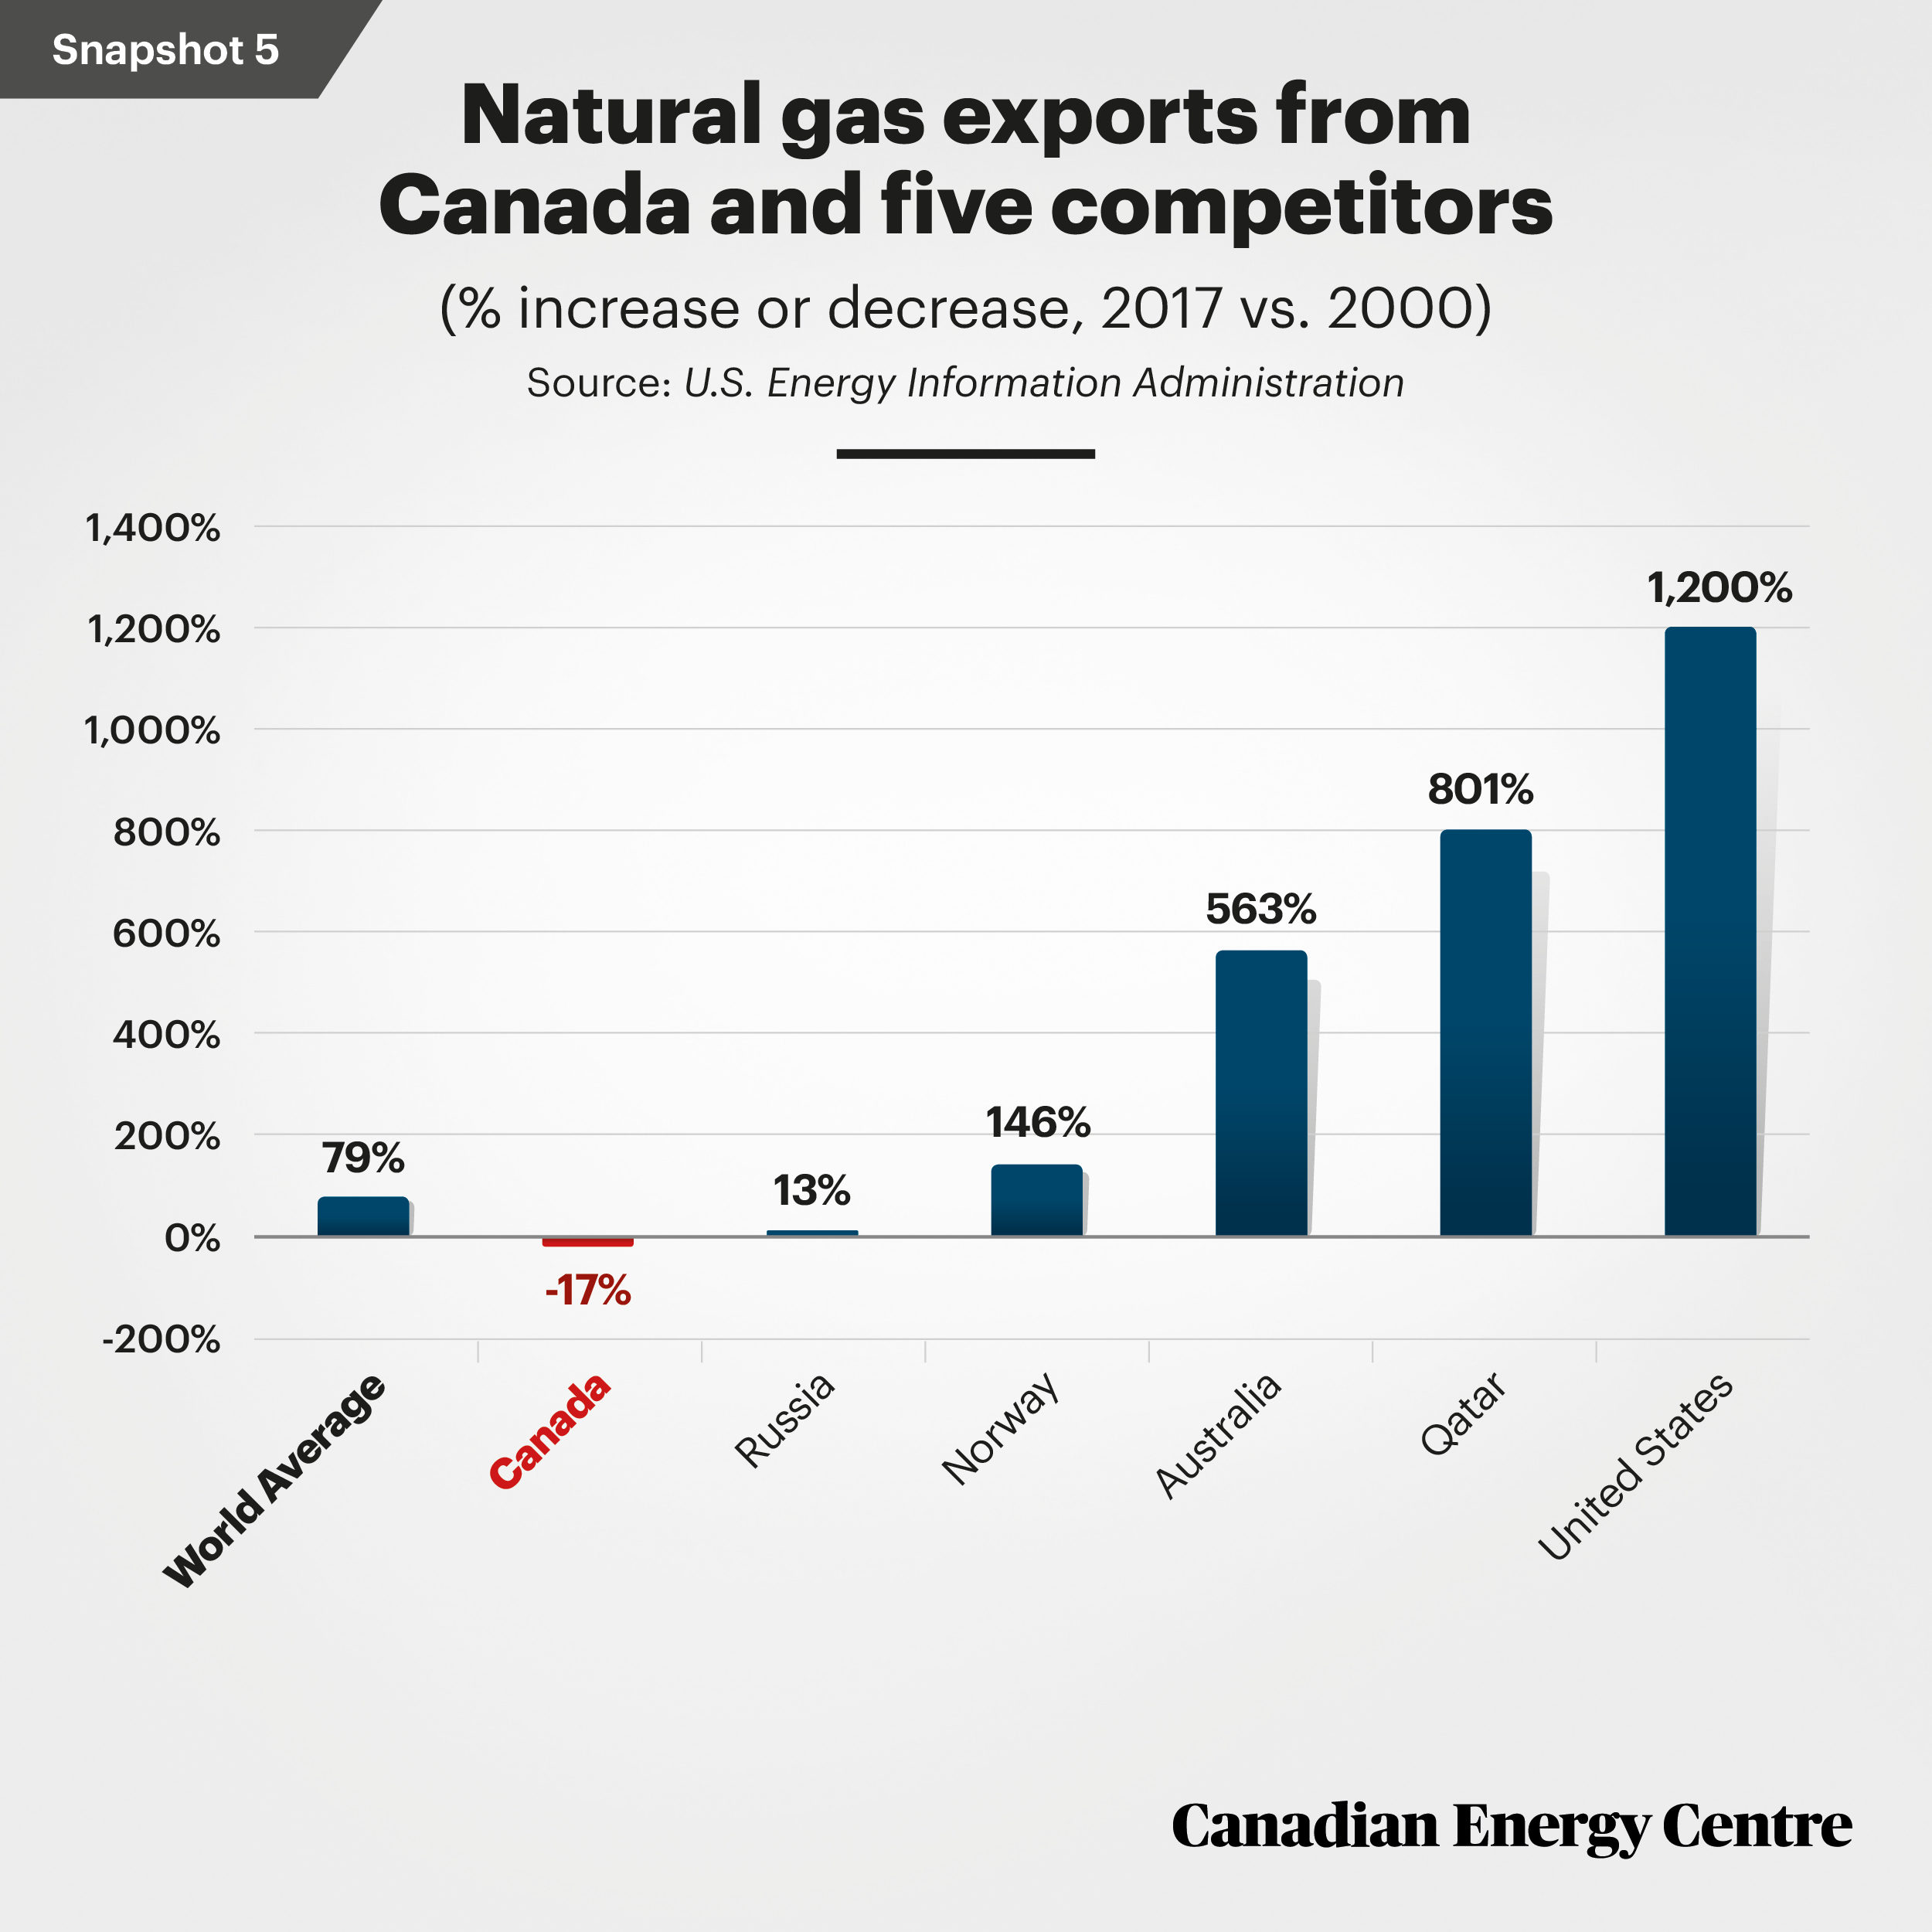
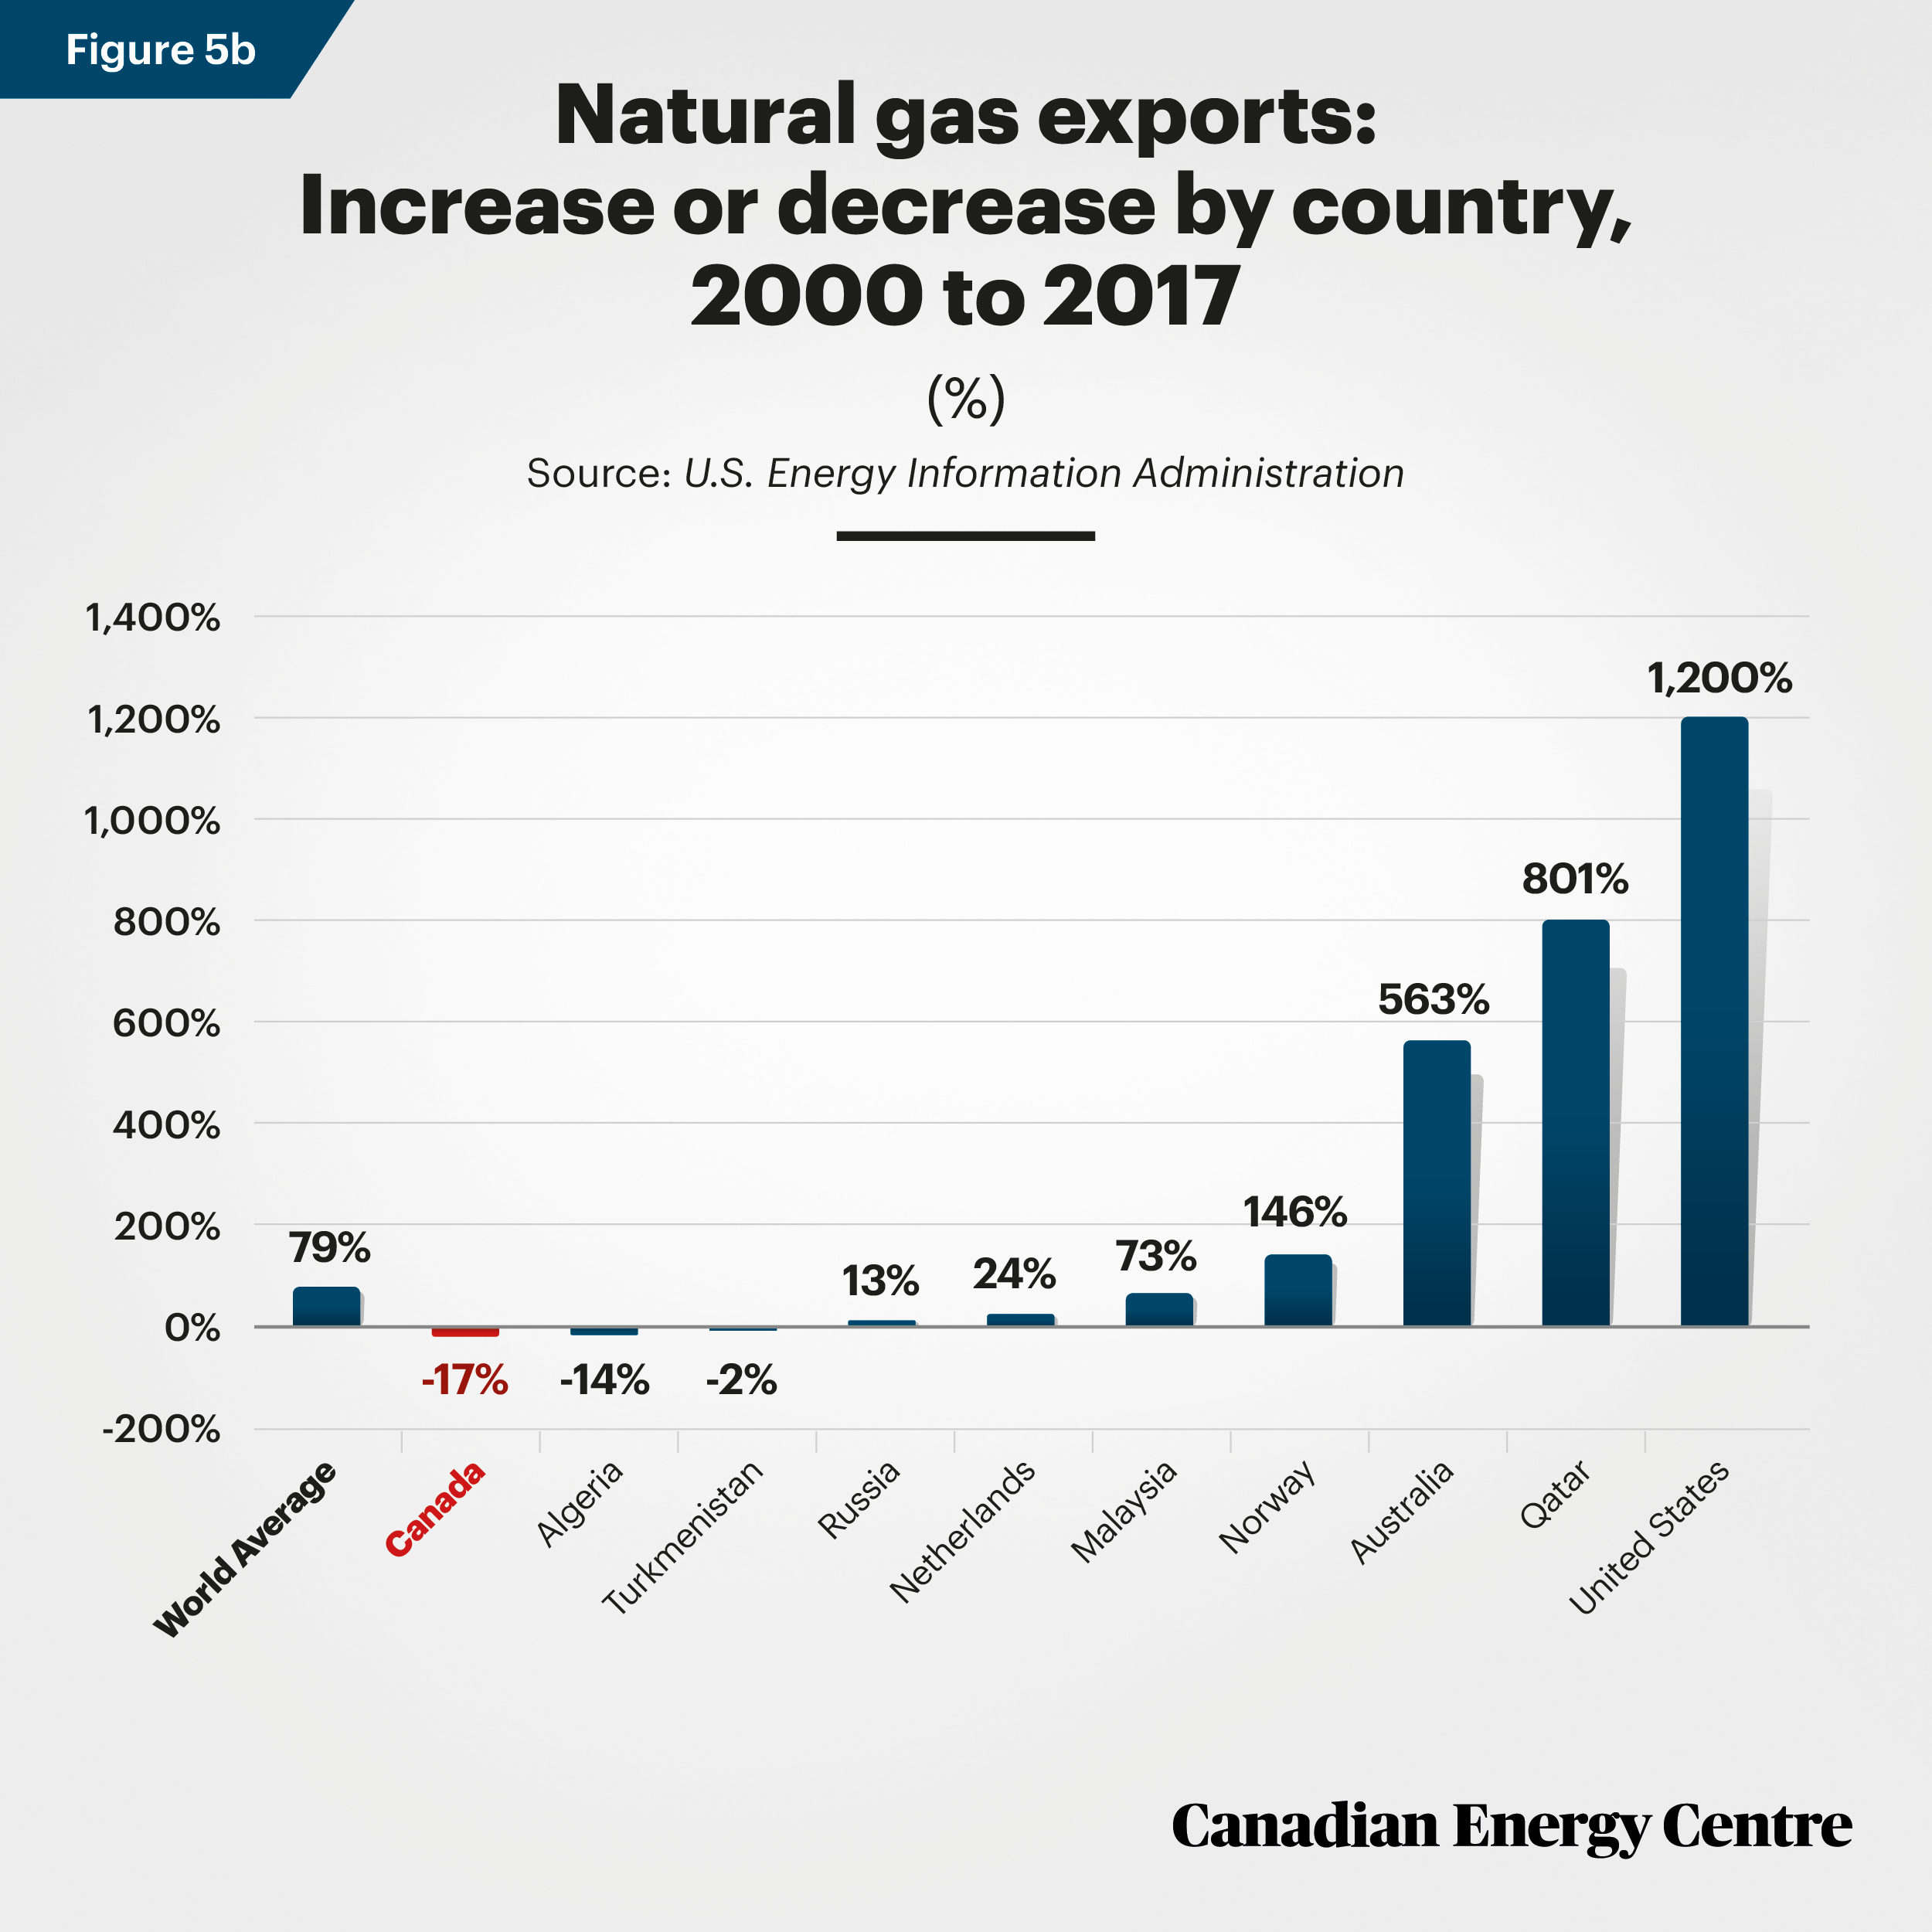
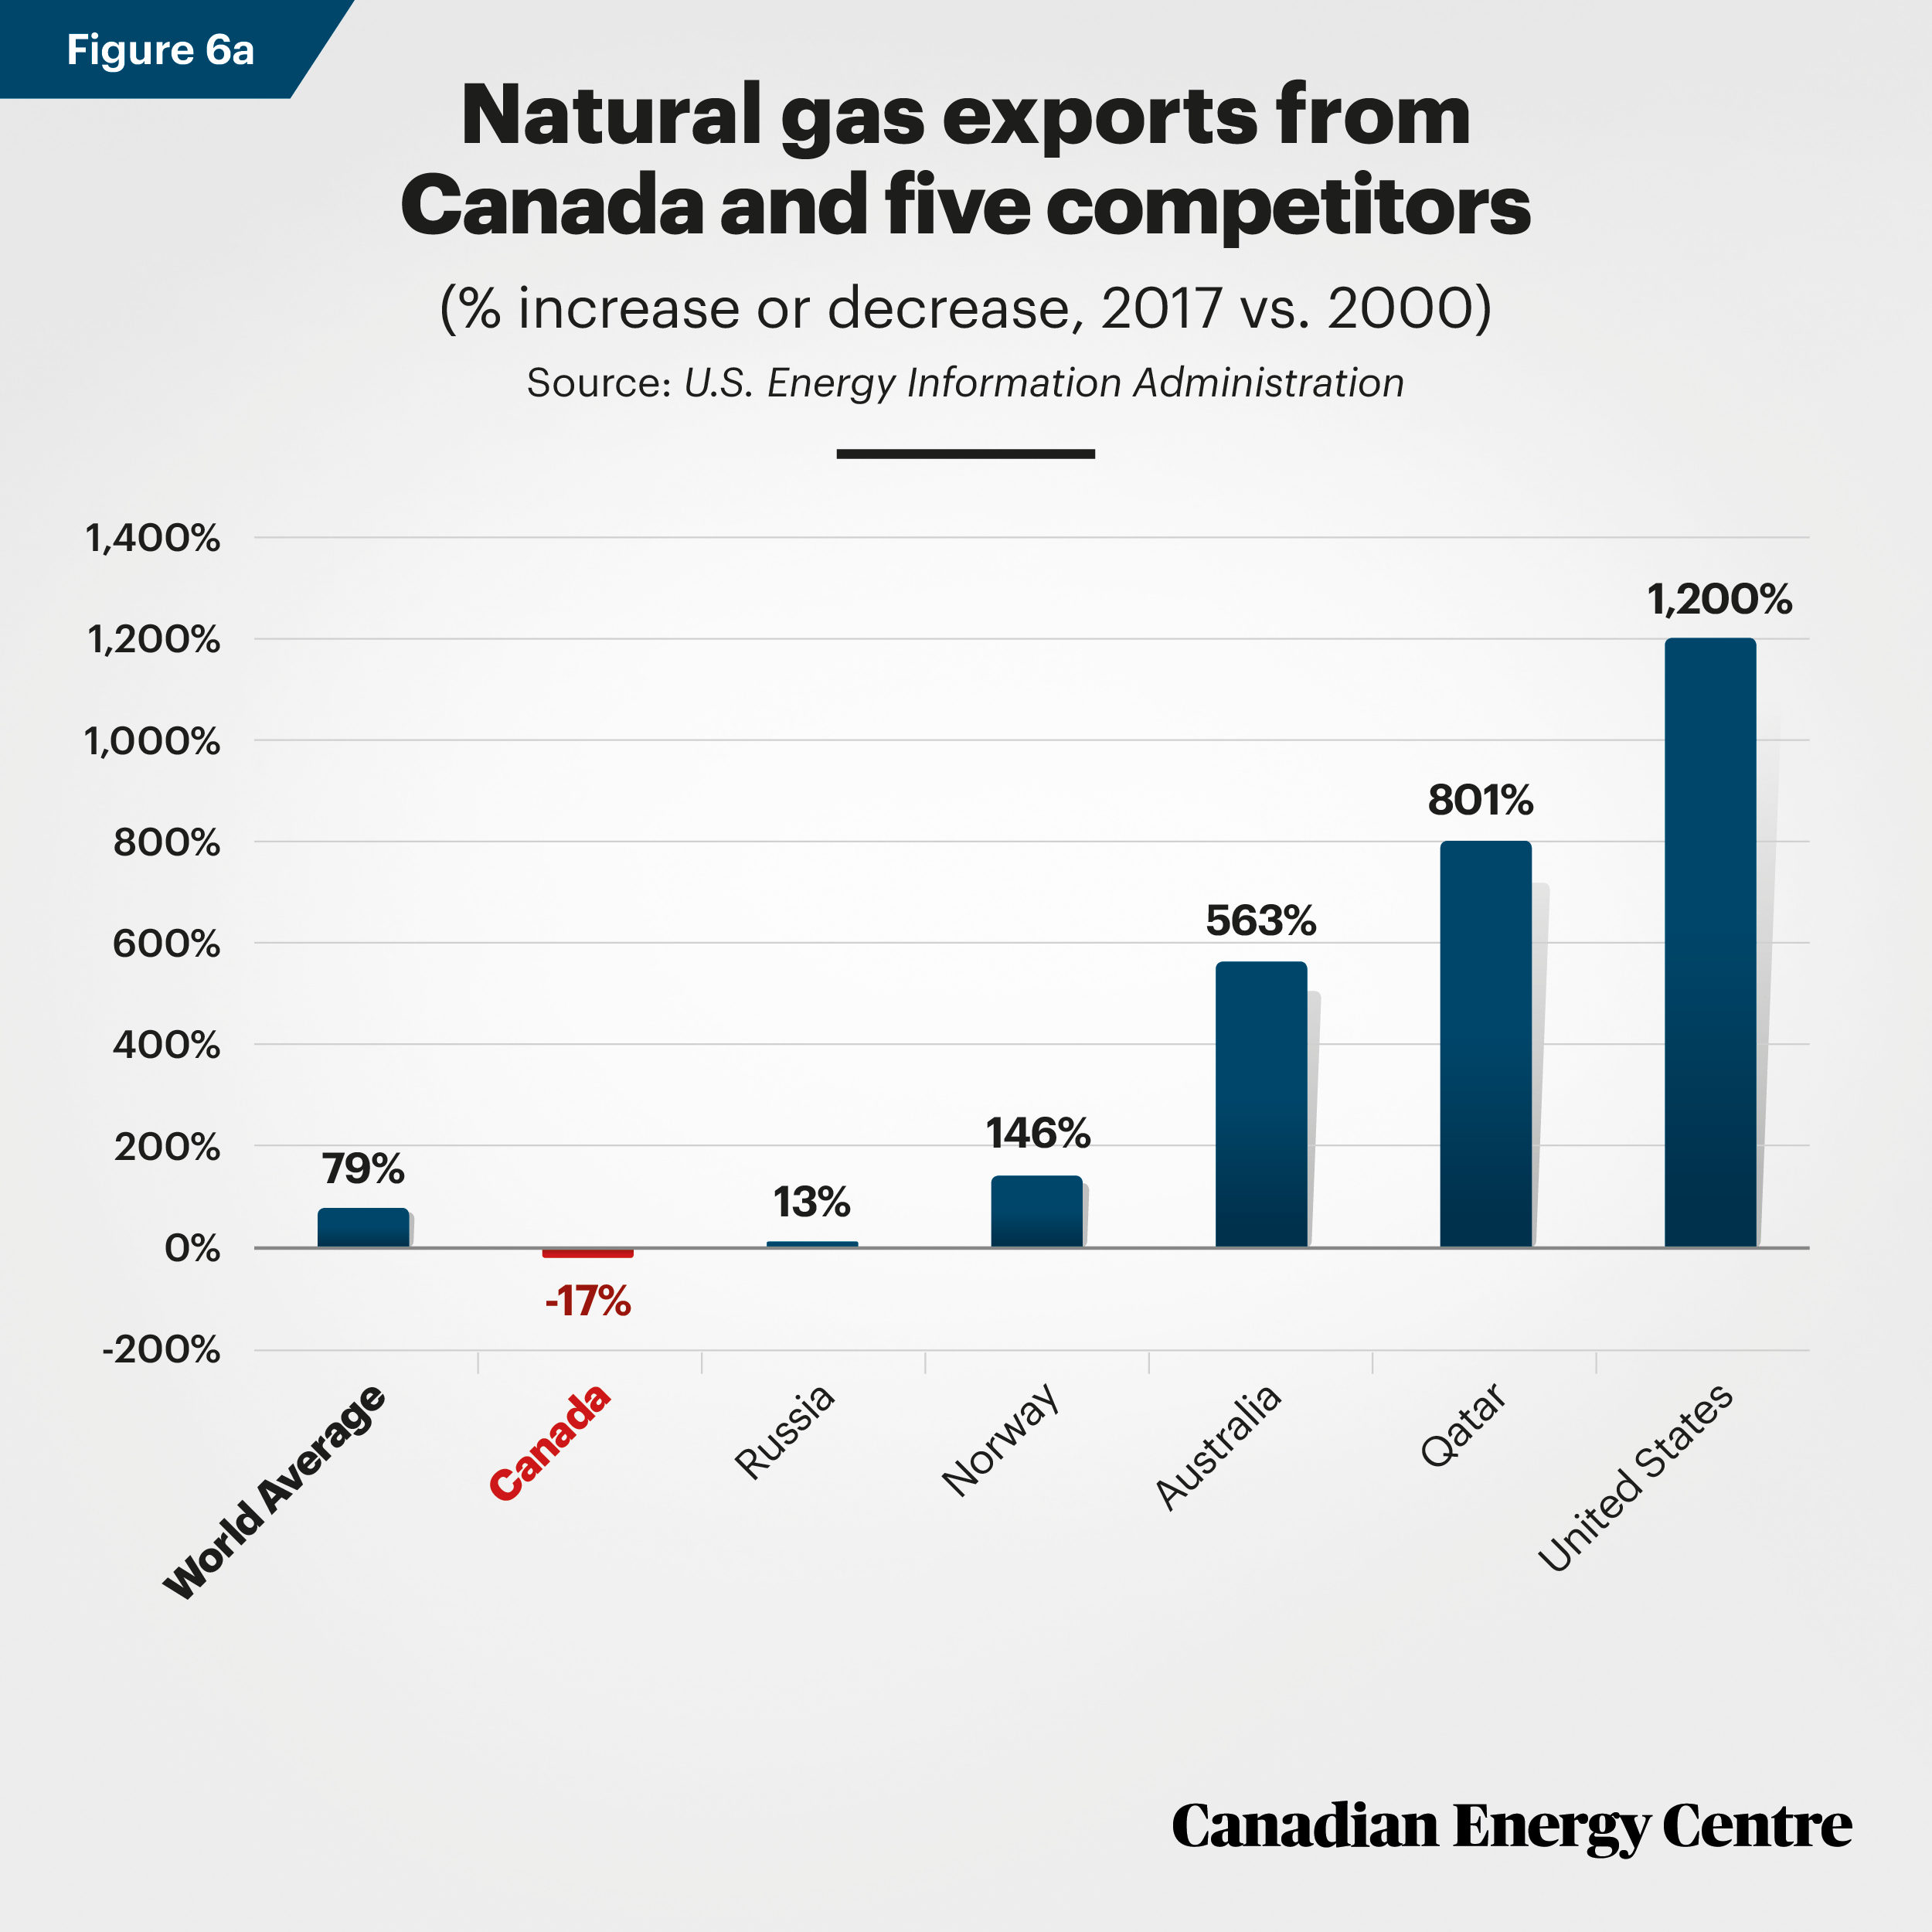
Snapshot Five: Canada and its competitors
Of five major competitors to Canada for natural gas export markets in 2017—the top six including Canada are profiled here—relative to 2000, by 2017 export volumes rose in Russia (13 per cent), Norway (146 per cent), Australia (563 per cent), Qatar (801 per cent) and the United States (1,200 per cent). World exports of natural gas rose by 79 per cent on average in that period, while exports from Canada declined by 17 per cent.
Source: U.S. Energy Information Administration
The details: Worldwide natural gas trends 2000 to 2017
Worldwide natural gas consumption has risen substantially since 2000 (up by 52 per cent) as of the most recent year for which annual data by country is available. The forecast is for a further rise of 40 per cent between 2018 and 2050, according to the U.S. Energy Information Administration (U.S. EIA, 2019).²
Consumption from 2000 to 2017
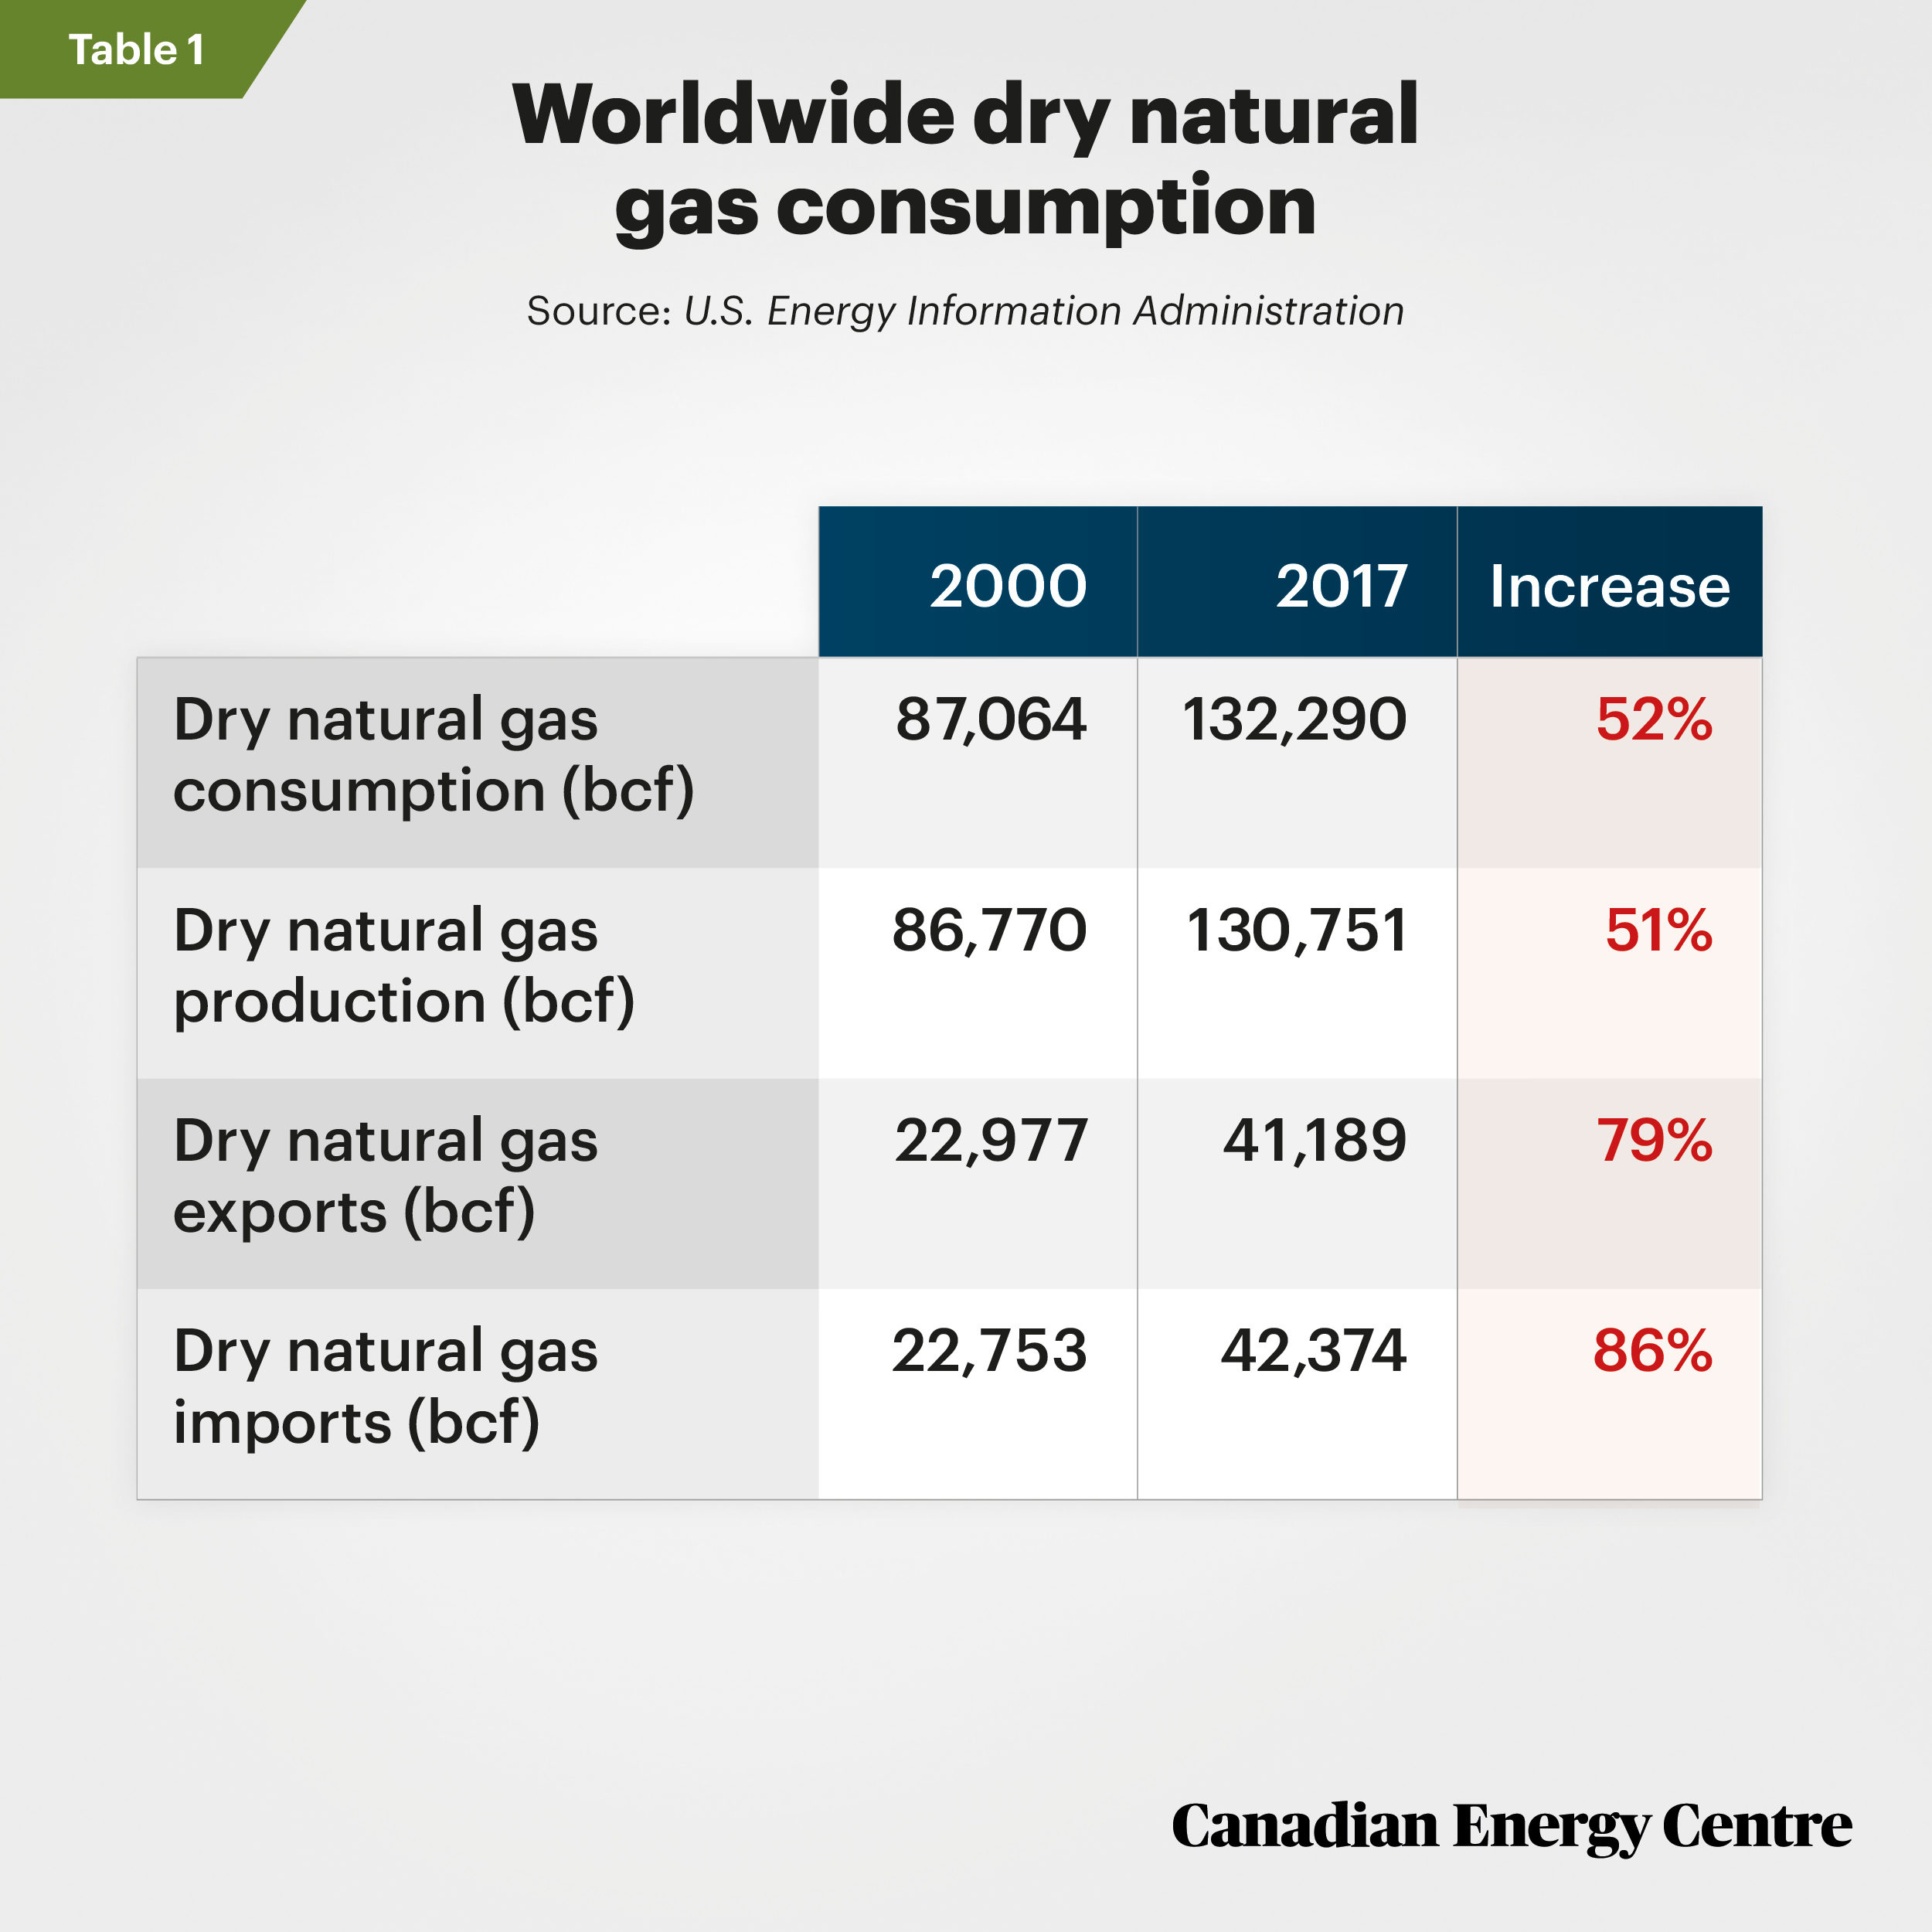
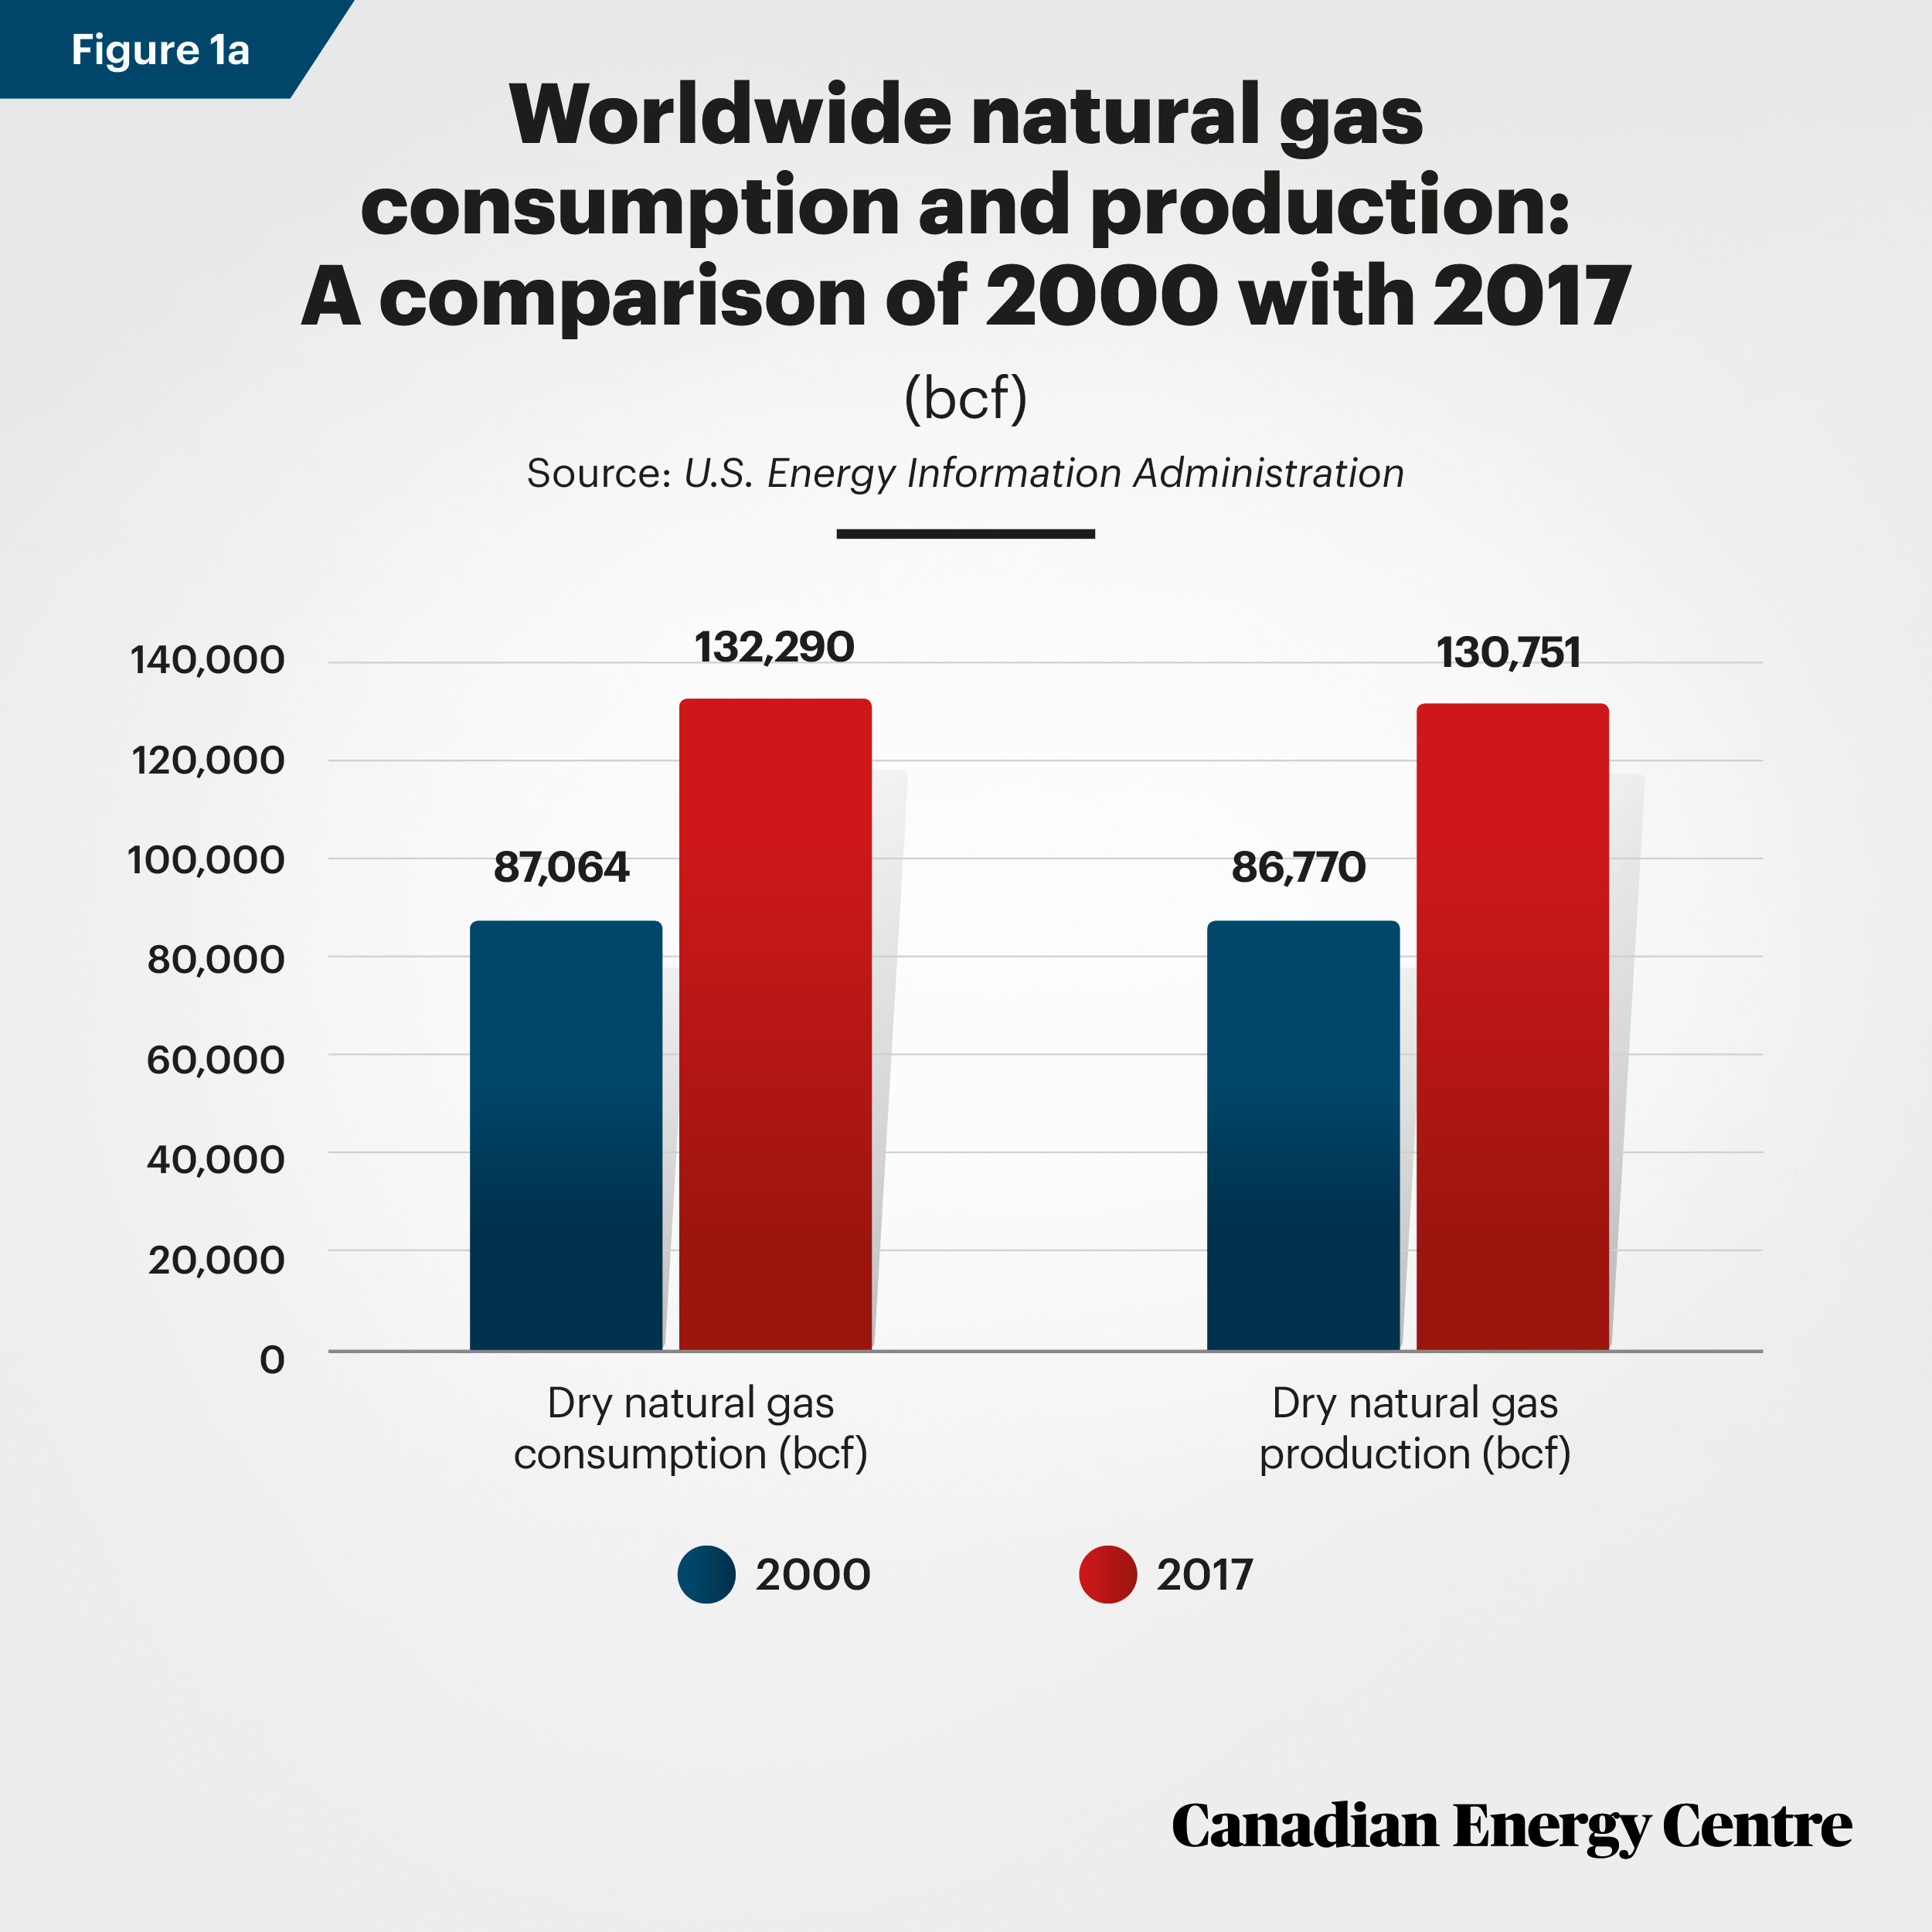
- Worldwide (dry³) natural gas consumption rose to 132,290 billion cubic feet (bcf) annually in 2017 from 87,064 bcf in 2000, a 52 per cent increase (Figure 1a).
Production from 2000 to 2017
- Worldwide (dry) natural gas production increased to 130,751 bcf annually in 2017 from 86,770 bcf in 2000, a 51 per cent
increase (Figure 1a).
2. As we write, the Coronavirus pandemic is underway with an expected decrease in natural
gas consumption due to a weakening economy. However, when an economic recovery occurs,
it isreasonable to infer that natural gas consumption will resume its upward trajectory.
3. The following definition is from the U.S. Energy Information Administration (undated):
Dry natural gas: Natural gas which remains after: 1) the liquefiable hydrocarbon portion
has been removed from the gas stream (i.e., gas after lease, field, and/or plant
separation); and 2) any volumes of nonhydrocarbon gases have been removed where they
occur in sufficient quantity to render the gas unmarketable. Note: Dry natural gas is
also known as consumer-grade natural gas. The parameters for measurement are cubic feet
at 60 degrees Fahrenheit and 14.73 pounds per square inch absolute.
Source: U.S. Energy Information Administration
Source: U.S. Energy Information Administration
Exports from 2000 to 2017
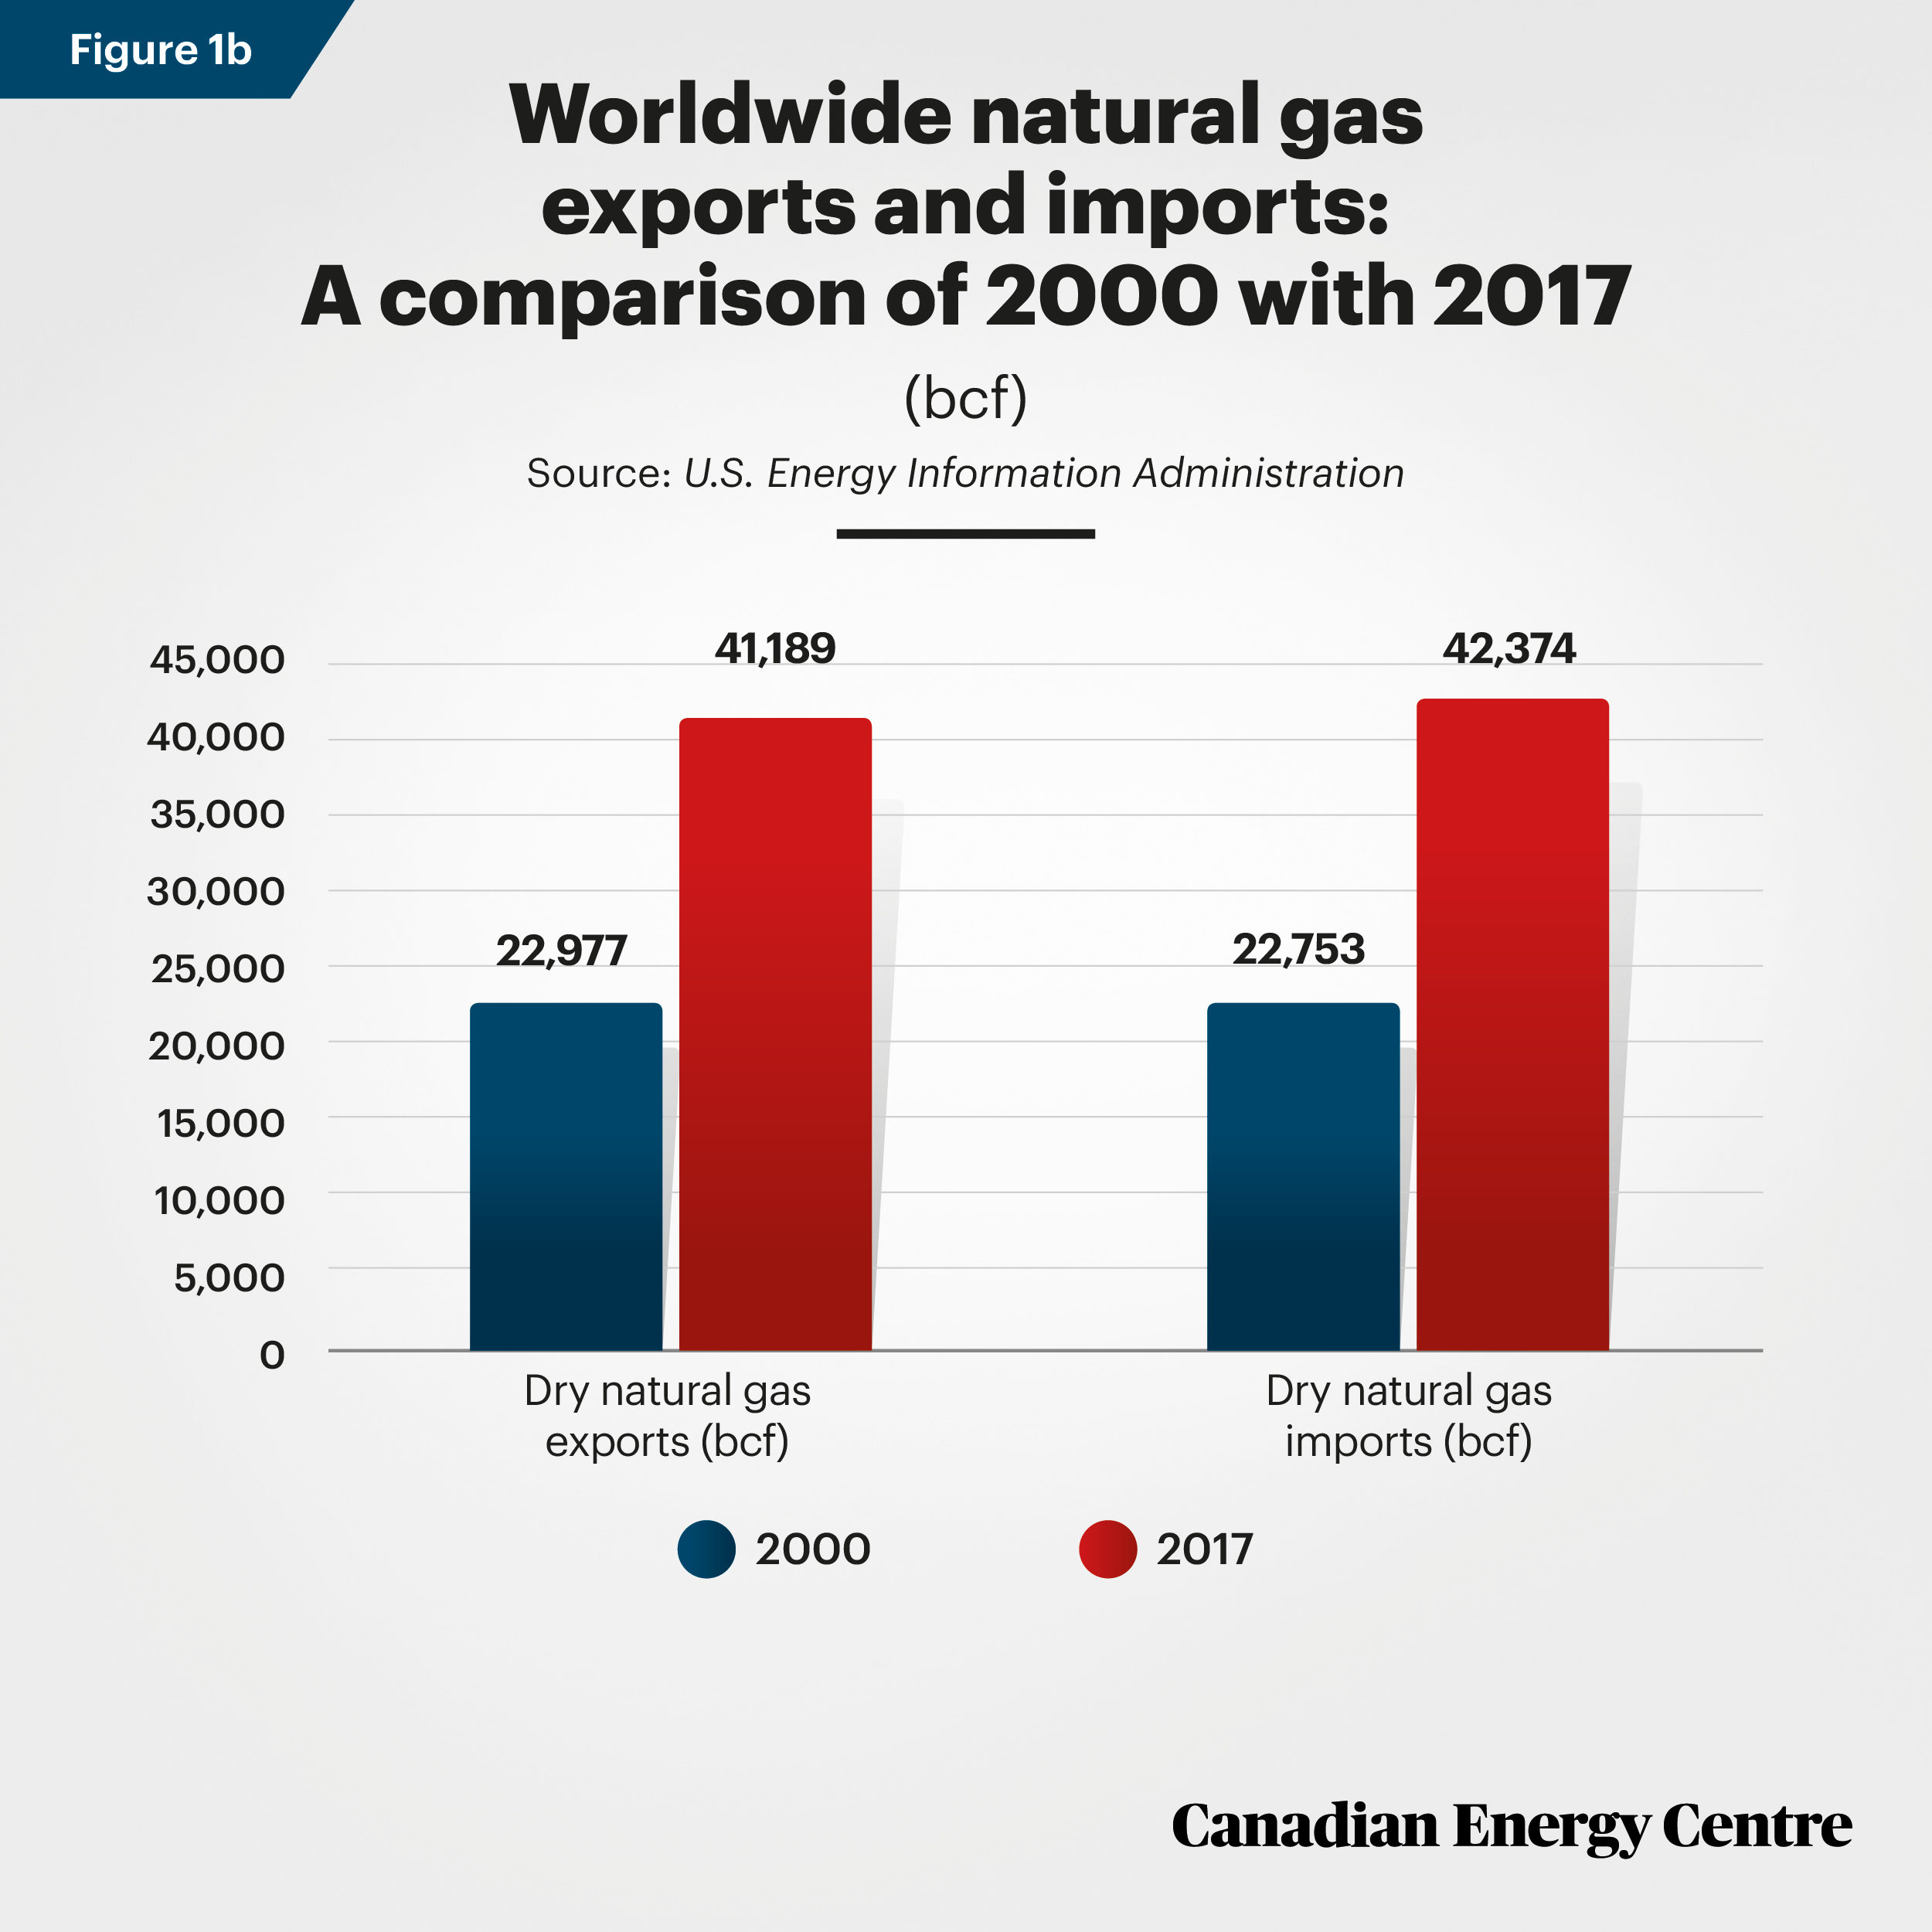
- Worldwide (dry) natural gas exports rose to 41,189 bcf annually in 2017 from 22,977 bcf in 2000, a 79 per cent
increase (Figure 1b).
Imports from 2000 to 2017
- Worldwide imports increased to 42,374 bcf annually in 2017 from 22,753 bcf in 2000, an 86 per cent increase (Figure 1b).
Source: U.S. Energy Information Administration
Natural gas consumption by country: The top ten in 2017 and trends since 2000
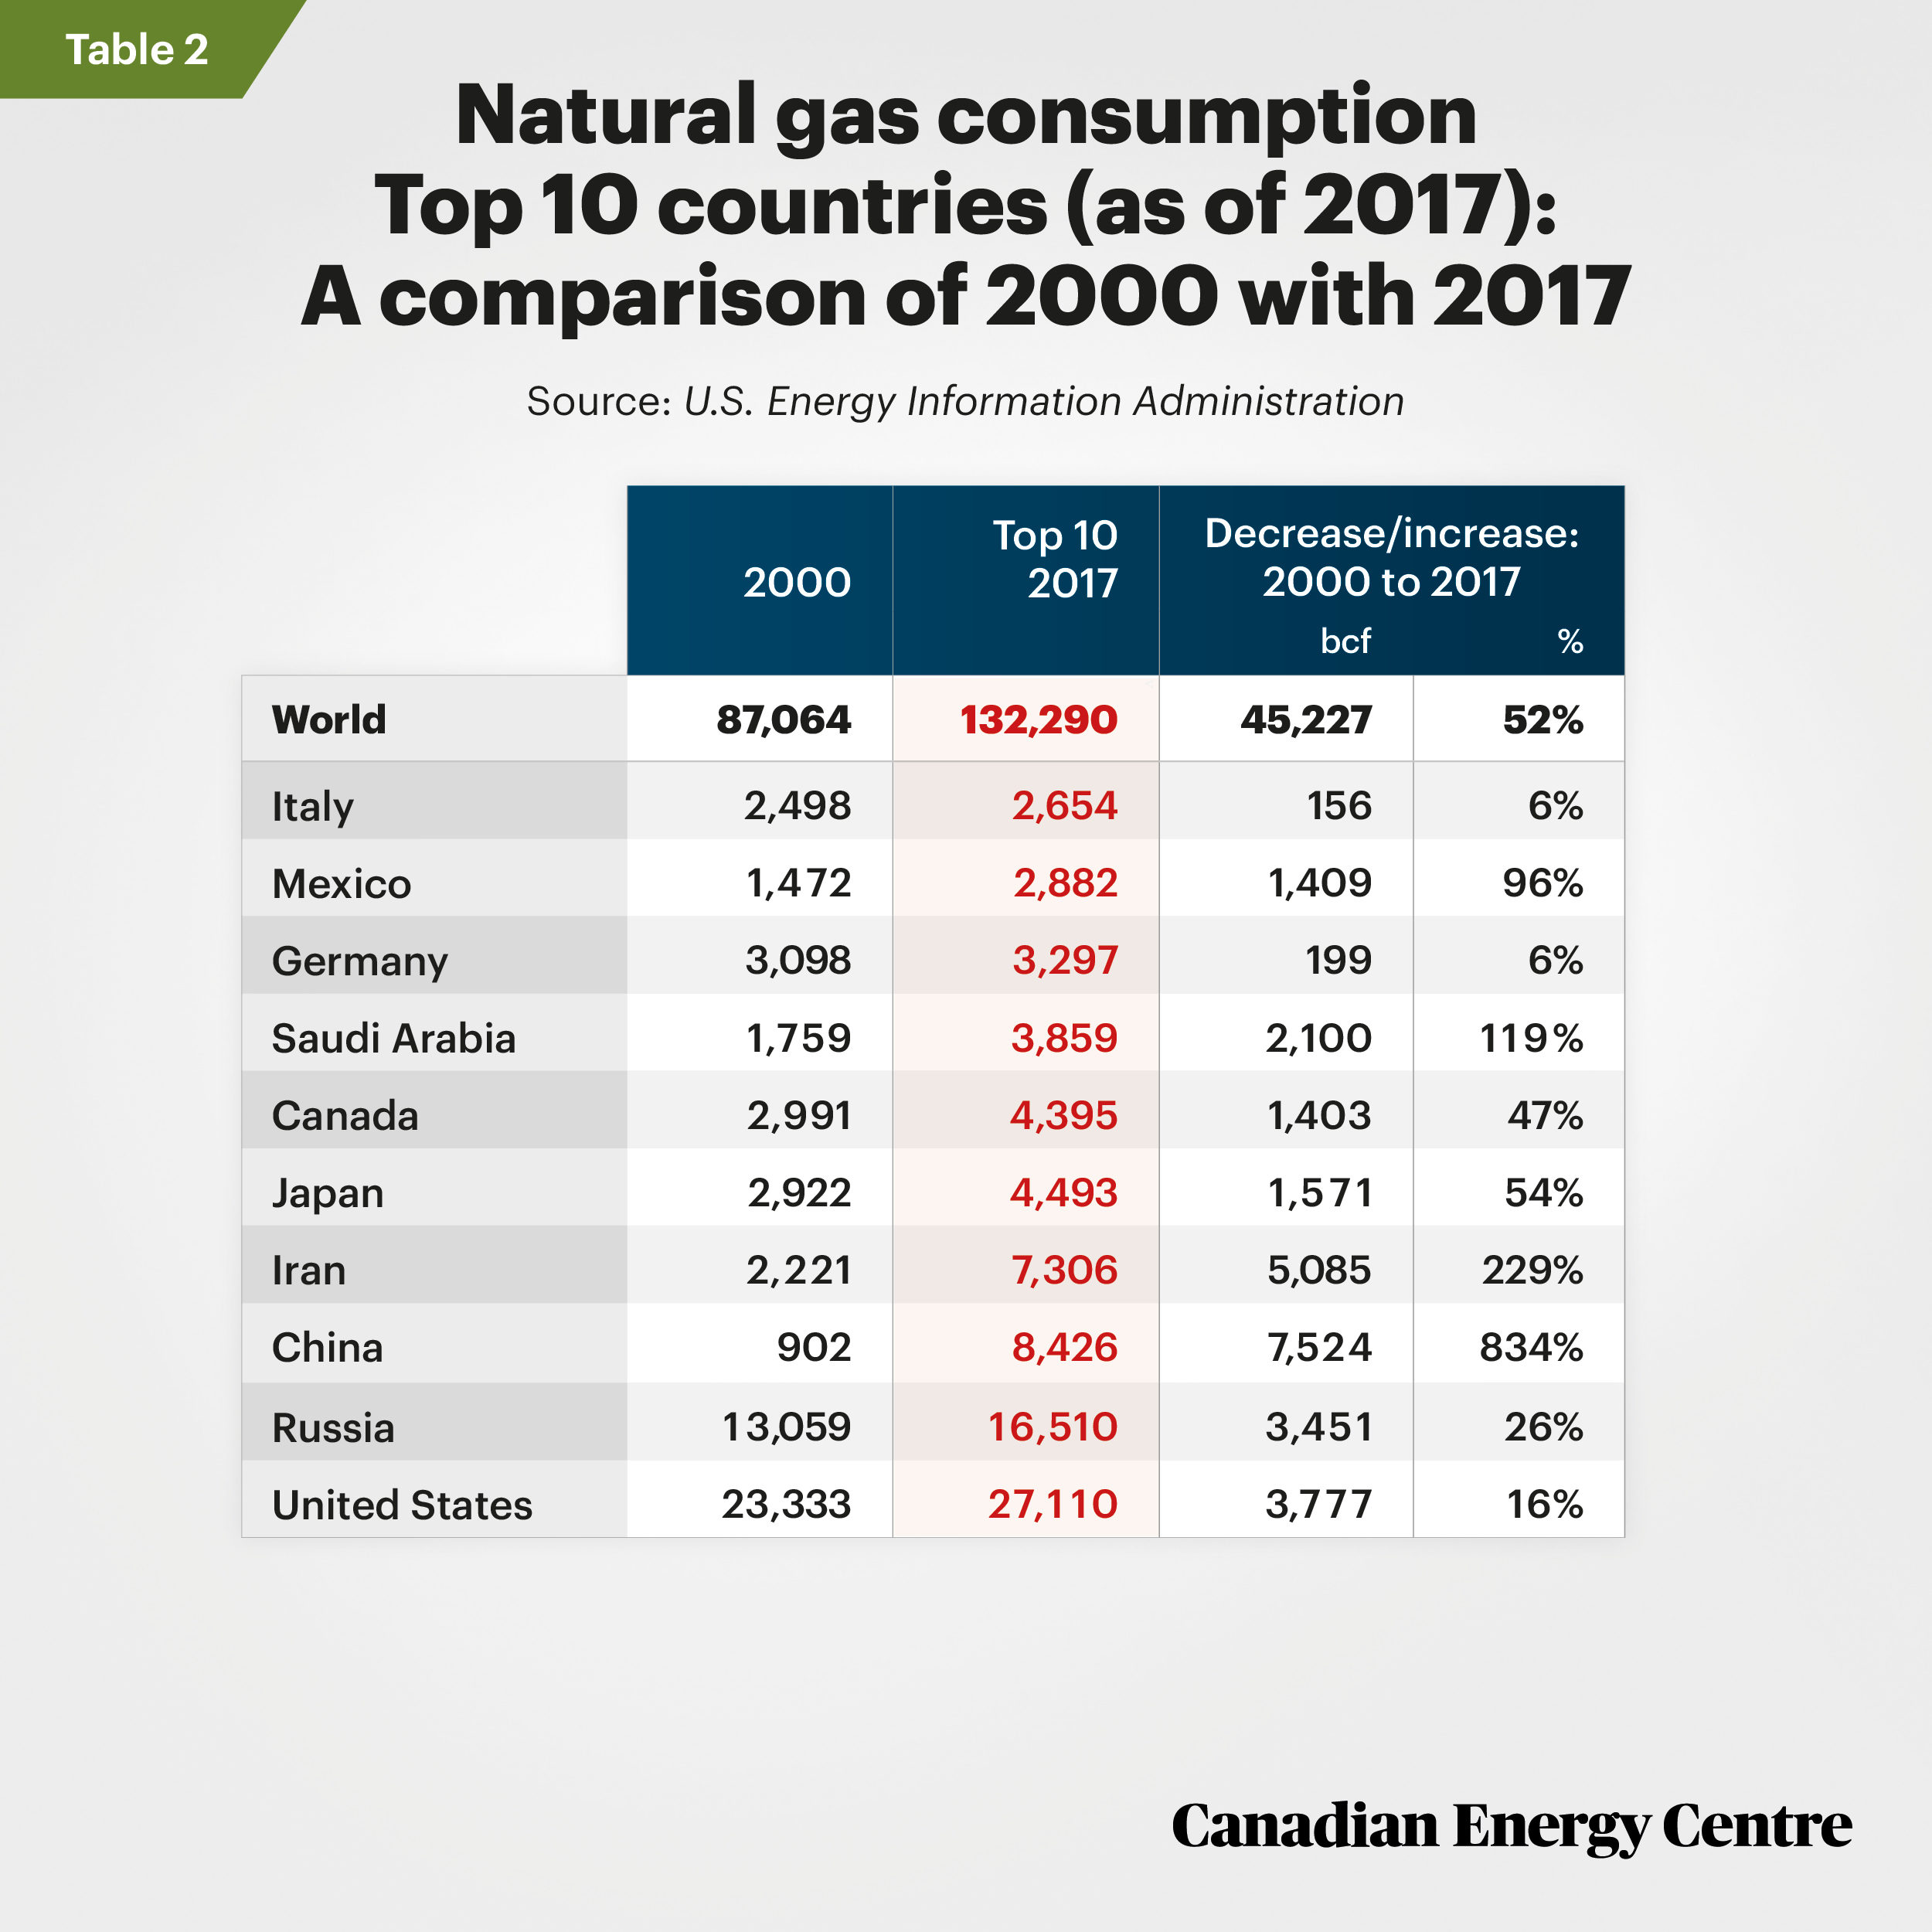
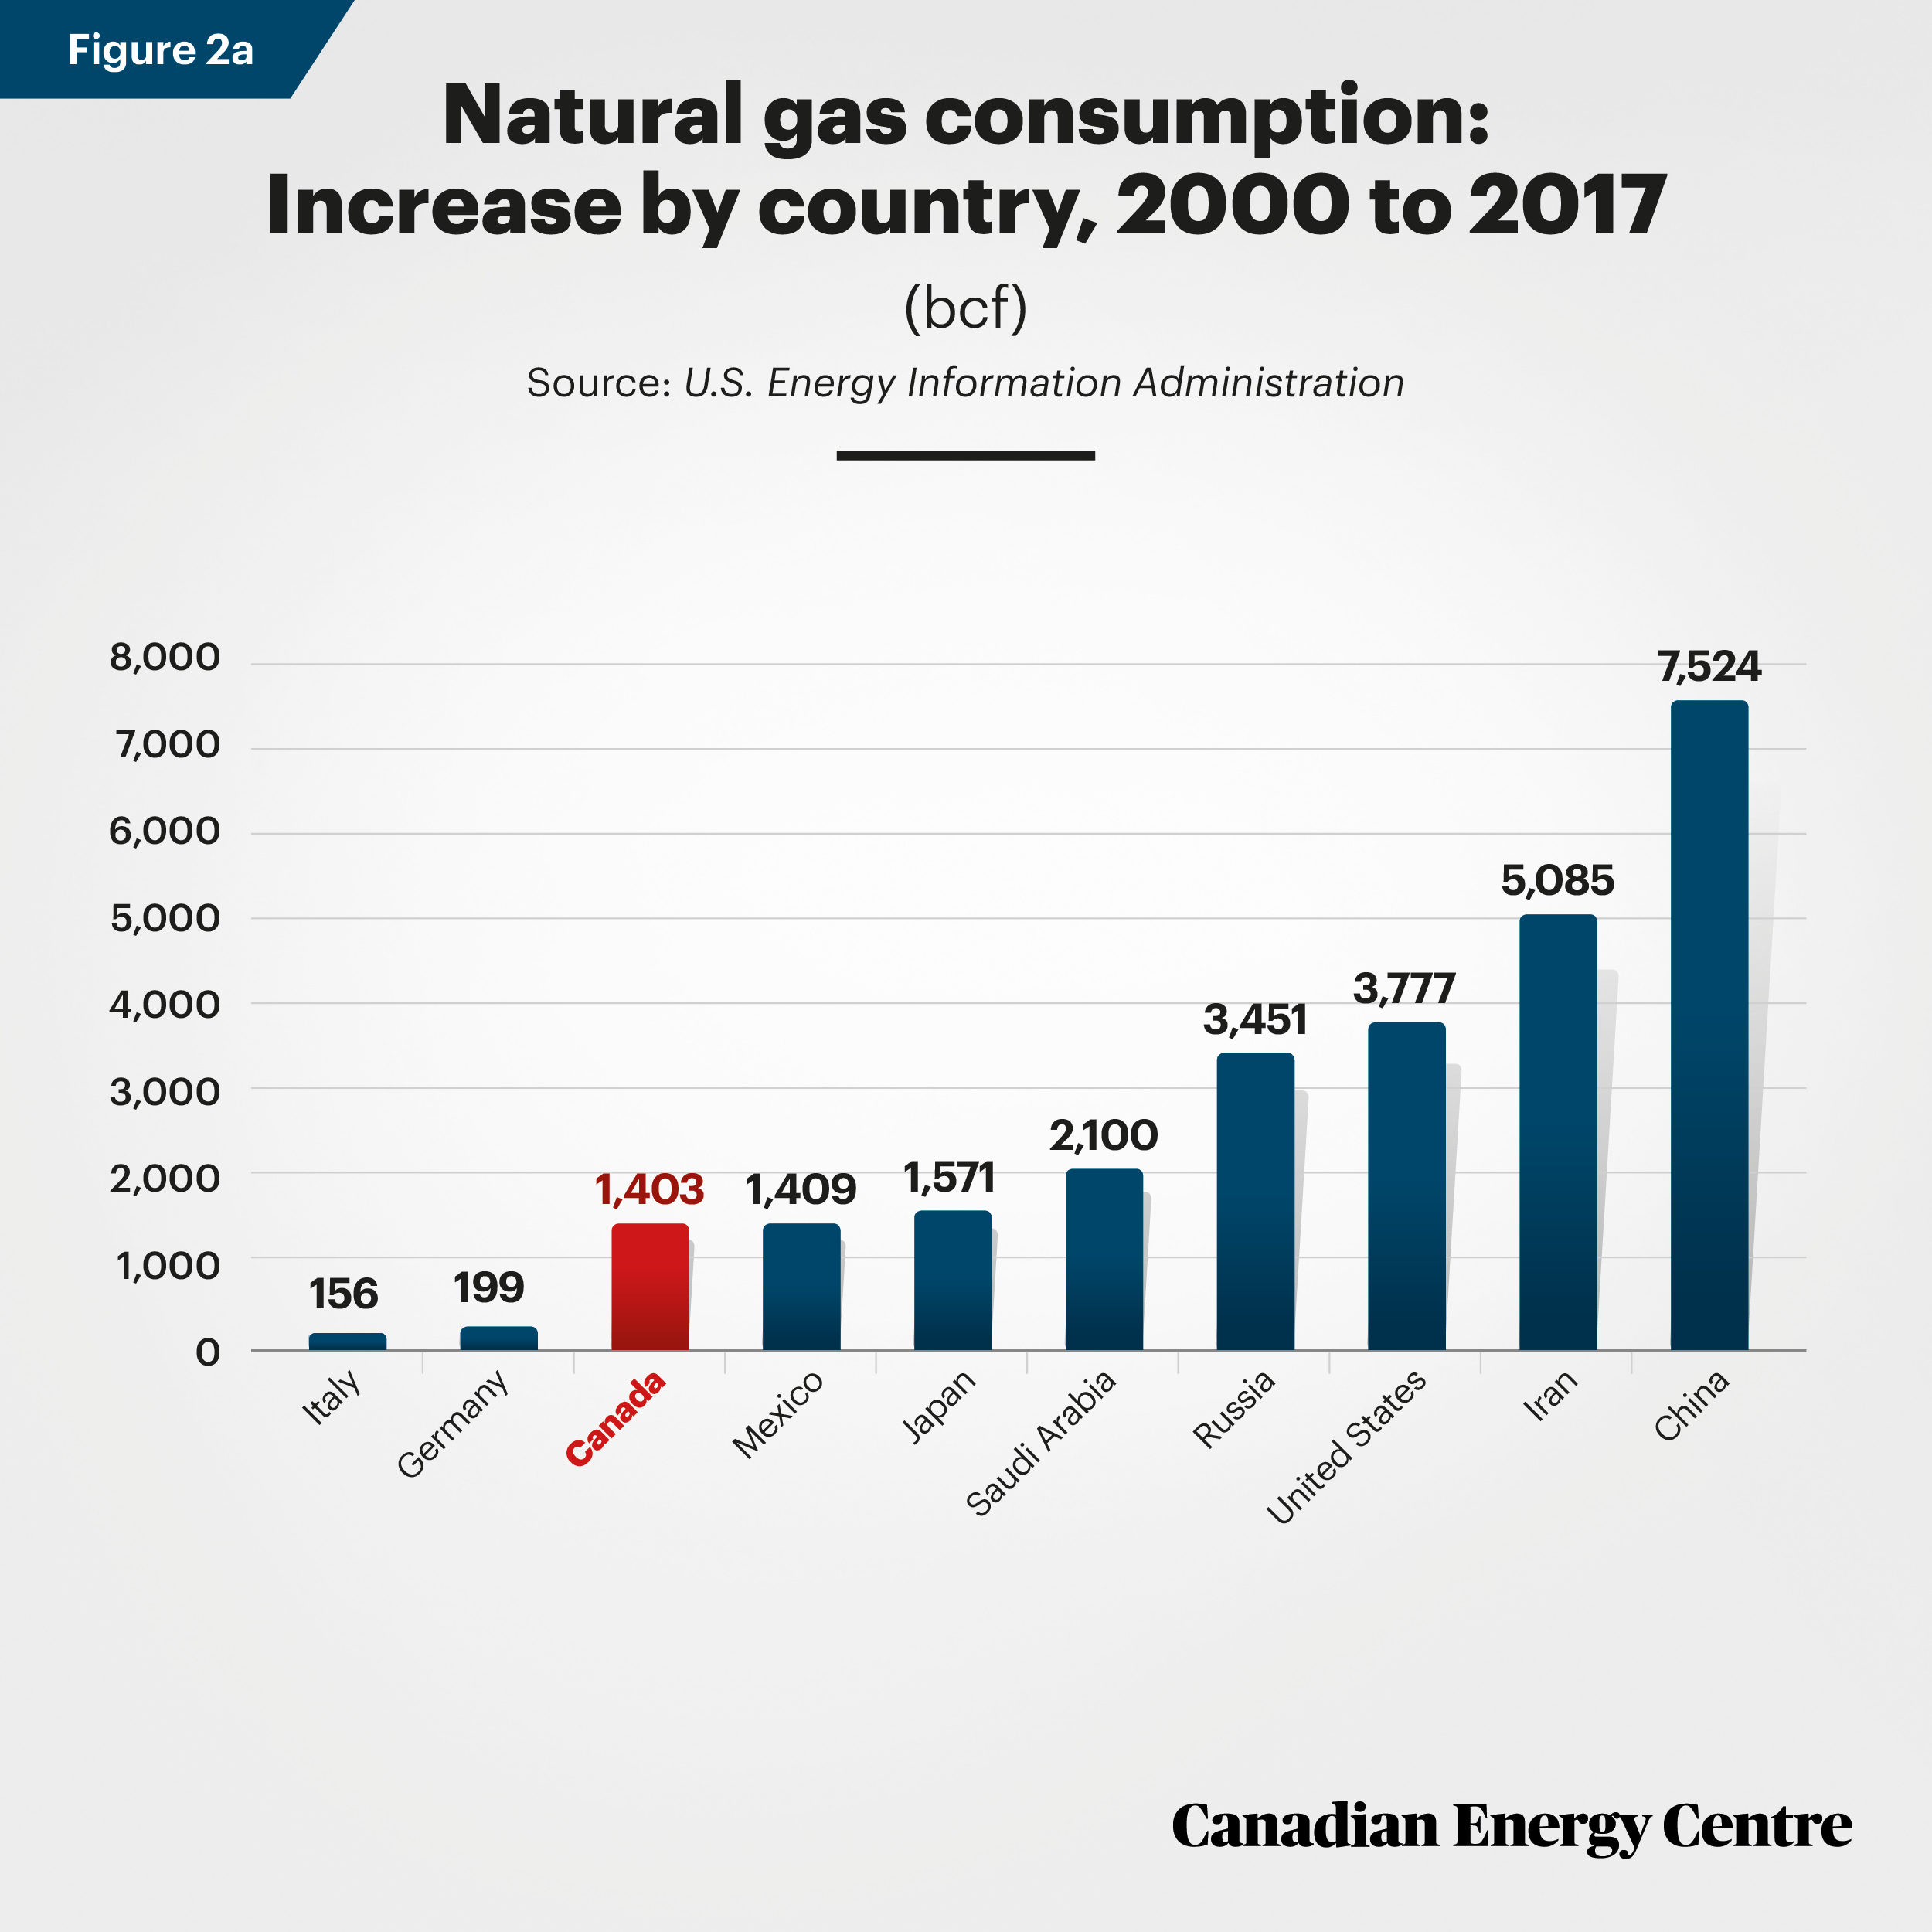
The following countries were ranked as the top ten for (dry) natural gas consumption in 2017 (see Table 2 and Figure 2a): Italy, Mexico, Germany, Saudi Arabia, Canada, Japan, Iran, China, Russia, and the United States. Table 2 and Figure 2a and Figure 2b compare their 2017 consumption with 2000, both by bcf and by percentage increases.
- Consumption of natural gas increased most in China, rising by 7,524 bcf, followed by Iran (up 5,085 bcf) and the United States (up 3,777 bcf). The smallest increase in consumption was recorded in Italy, where consumption rose by 156 bcf over the period.
- China’s consumption of natural gas rose by 834 per cent, while Iran’s rose by 229 per cent and Saudi Arabia’s
consumption rose by 119 per cent. - Between 2000 and 2017, the rise in natural consumption worldwide (all countries beyond just the 10 nations profiled here) was 45,227 bcf, an increase of 52 per cent.
Source: U.S. Energy Information Administration
Source: U.S. Energy Information Administration
Source: U.S. Energy Information Administration
Natural gas production by country: The top 10 in 2017 and trends since 2000
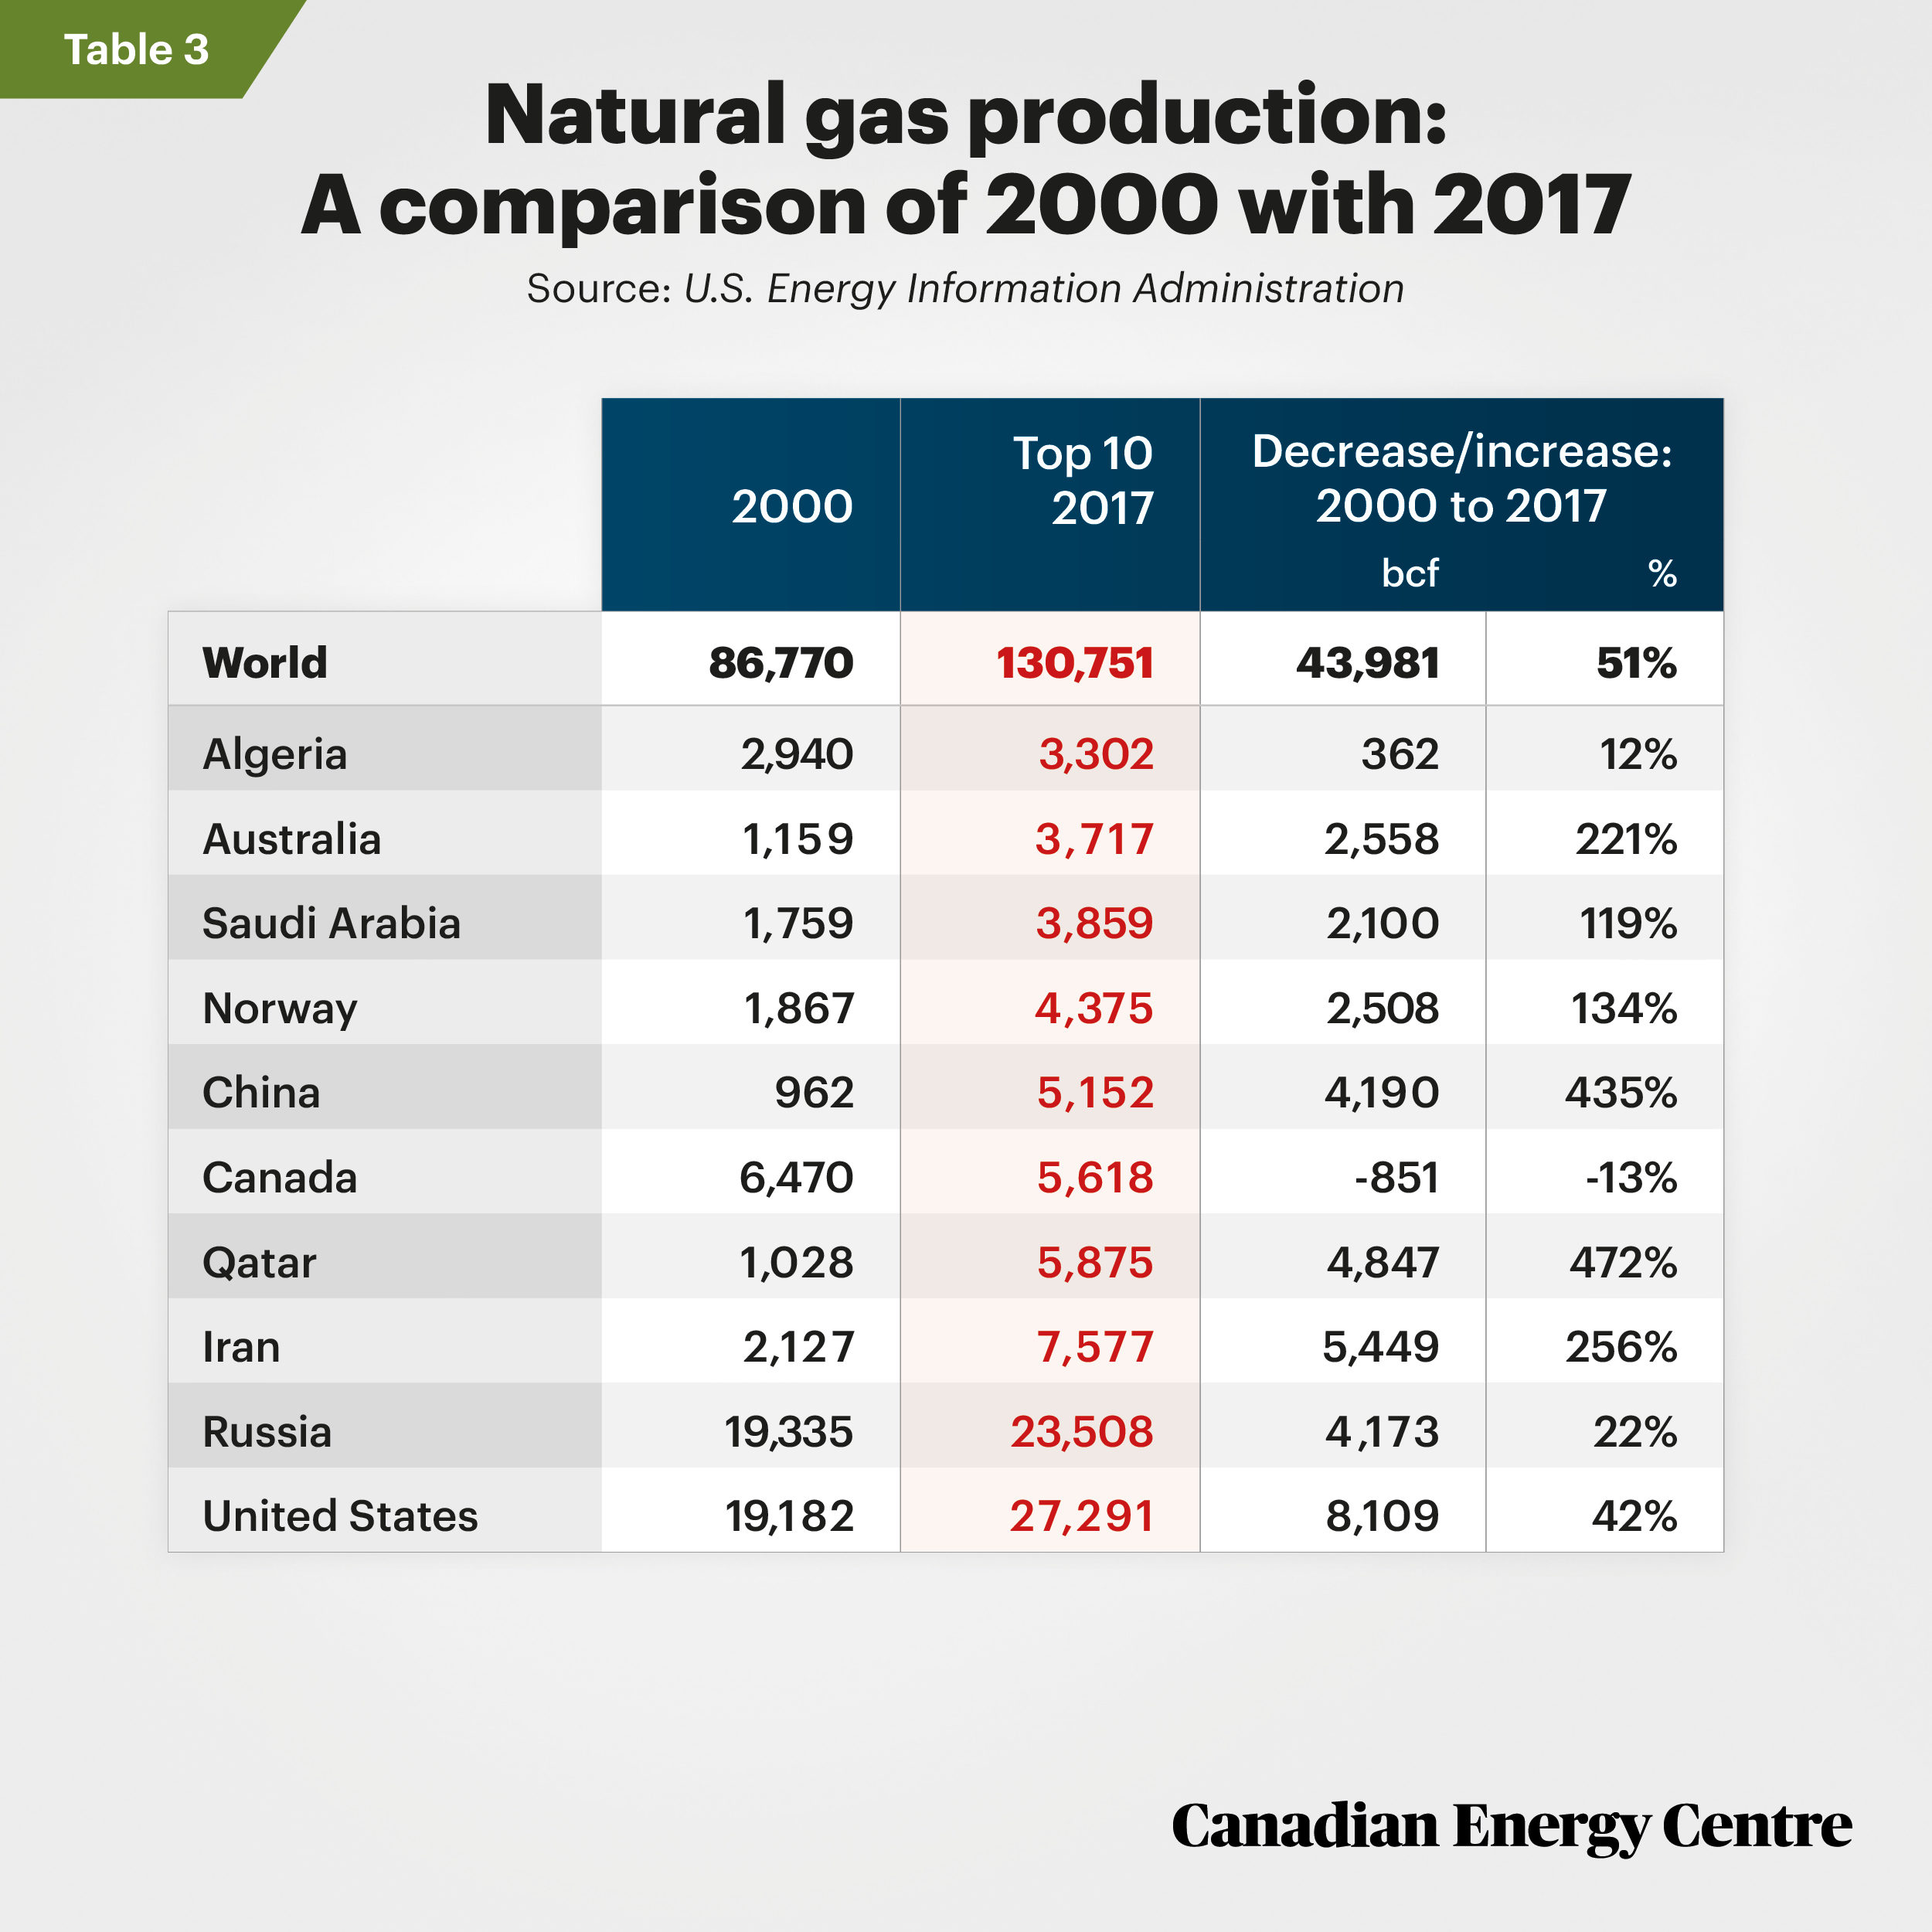
The following countries were ranked as the top ten for natural gas output in 2017 (Table 3): Algeria, Australia, Saudi Arabia, Norway, China, Canada, Qatar, Iran, Russia, and the United States. Their 2017 production is compared with 2000, both by bcf (Figure 3a) and by percentage increases (Figure 3b).
- Among the top ten countries in 2017 (compared with 2000), production of natural gas increased most in the United States where production rose by 8,109 bcf, followed by Iran (up 5,449 bcf) and Qatar (up 4,847 bcf).
- Of note, Canada was the only country among the top 10 producers in 2017 to see its natural gas production drop
relative to 2000, declining to 5,618 bcf from 6,470 bcf, a reduction in exports of 851 billion cubic feet. - Qatar’s production of natural gas rose by 472 per cent, while China’s rose by 435 per cent and Iran’s rose by 256 per cent. Canada’s natural gas production, meanwhile, declined by 13 per cent.
- The rise in natural gas production worldwide (all countries beyond just the 10 nations profiled here) between 2000 and 2017 was 43,981 bcf, higher by 51 per cent over 2000.
Source: U.S. Energy Information Administration
Source: U.S. Energy Information Administration
Source: U.S. Energy Information Administration
Natural gas imports by country: The top 10 in 2017 and trends since 2000
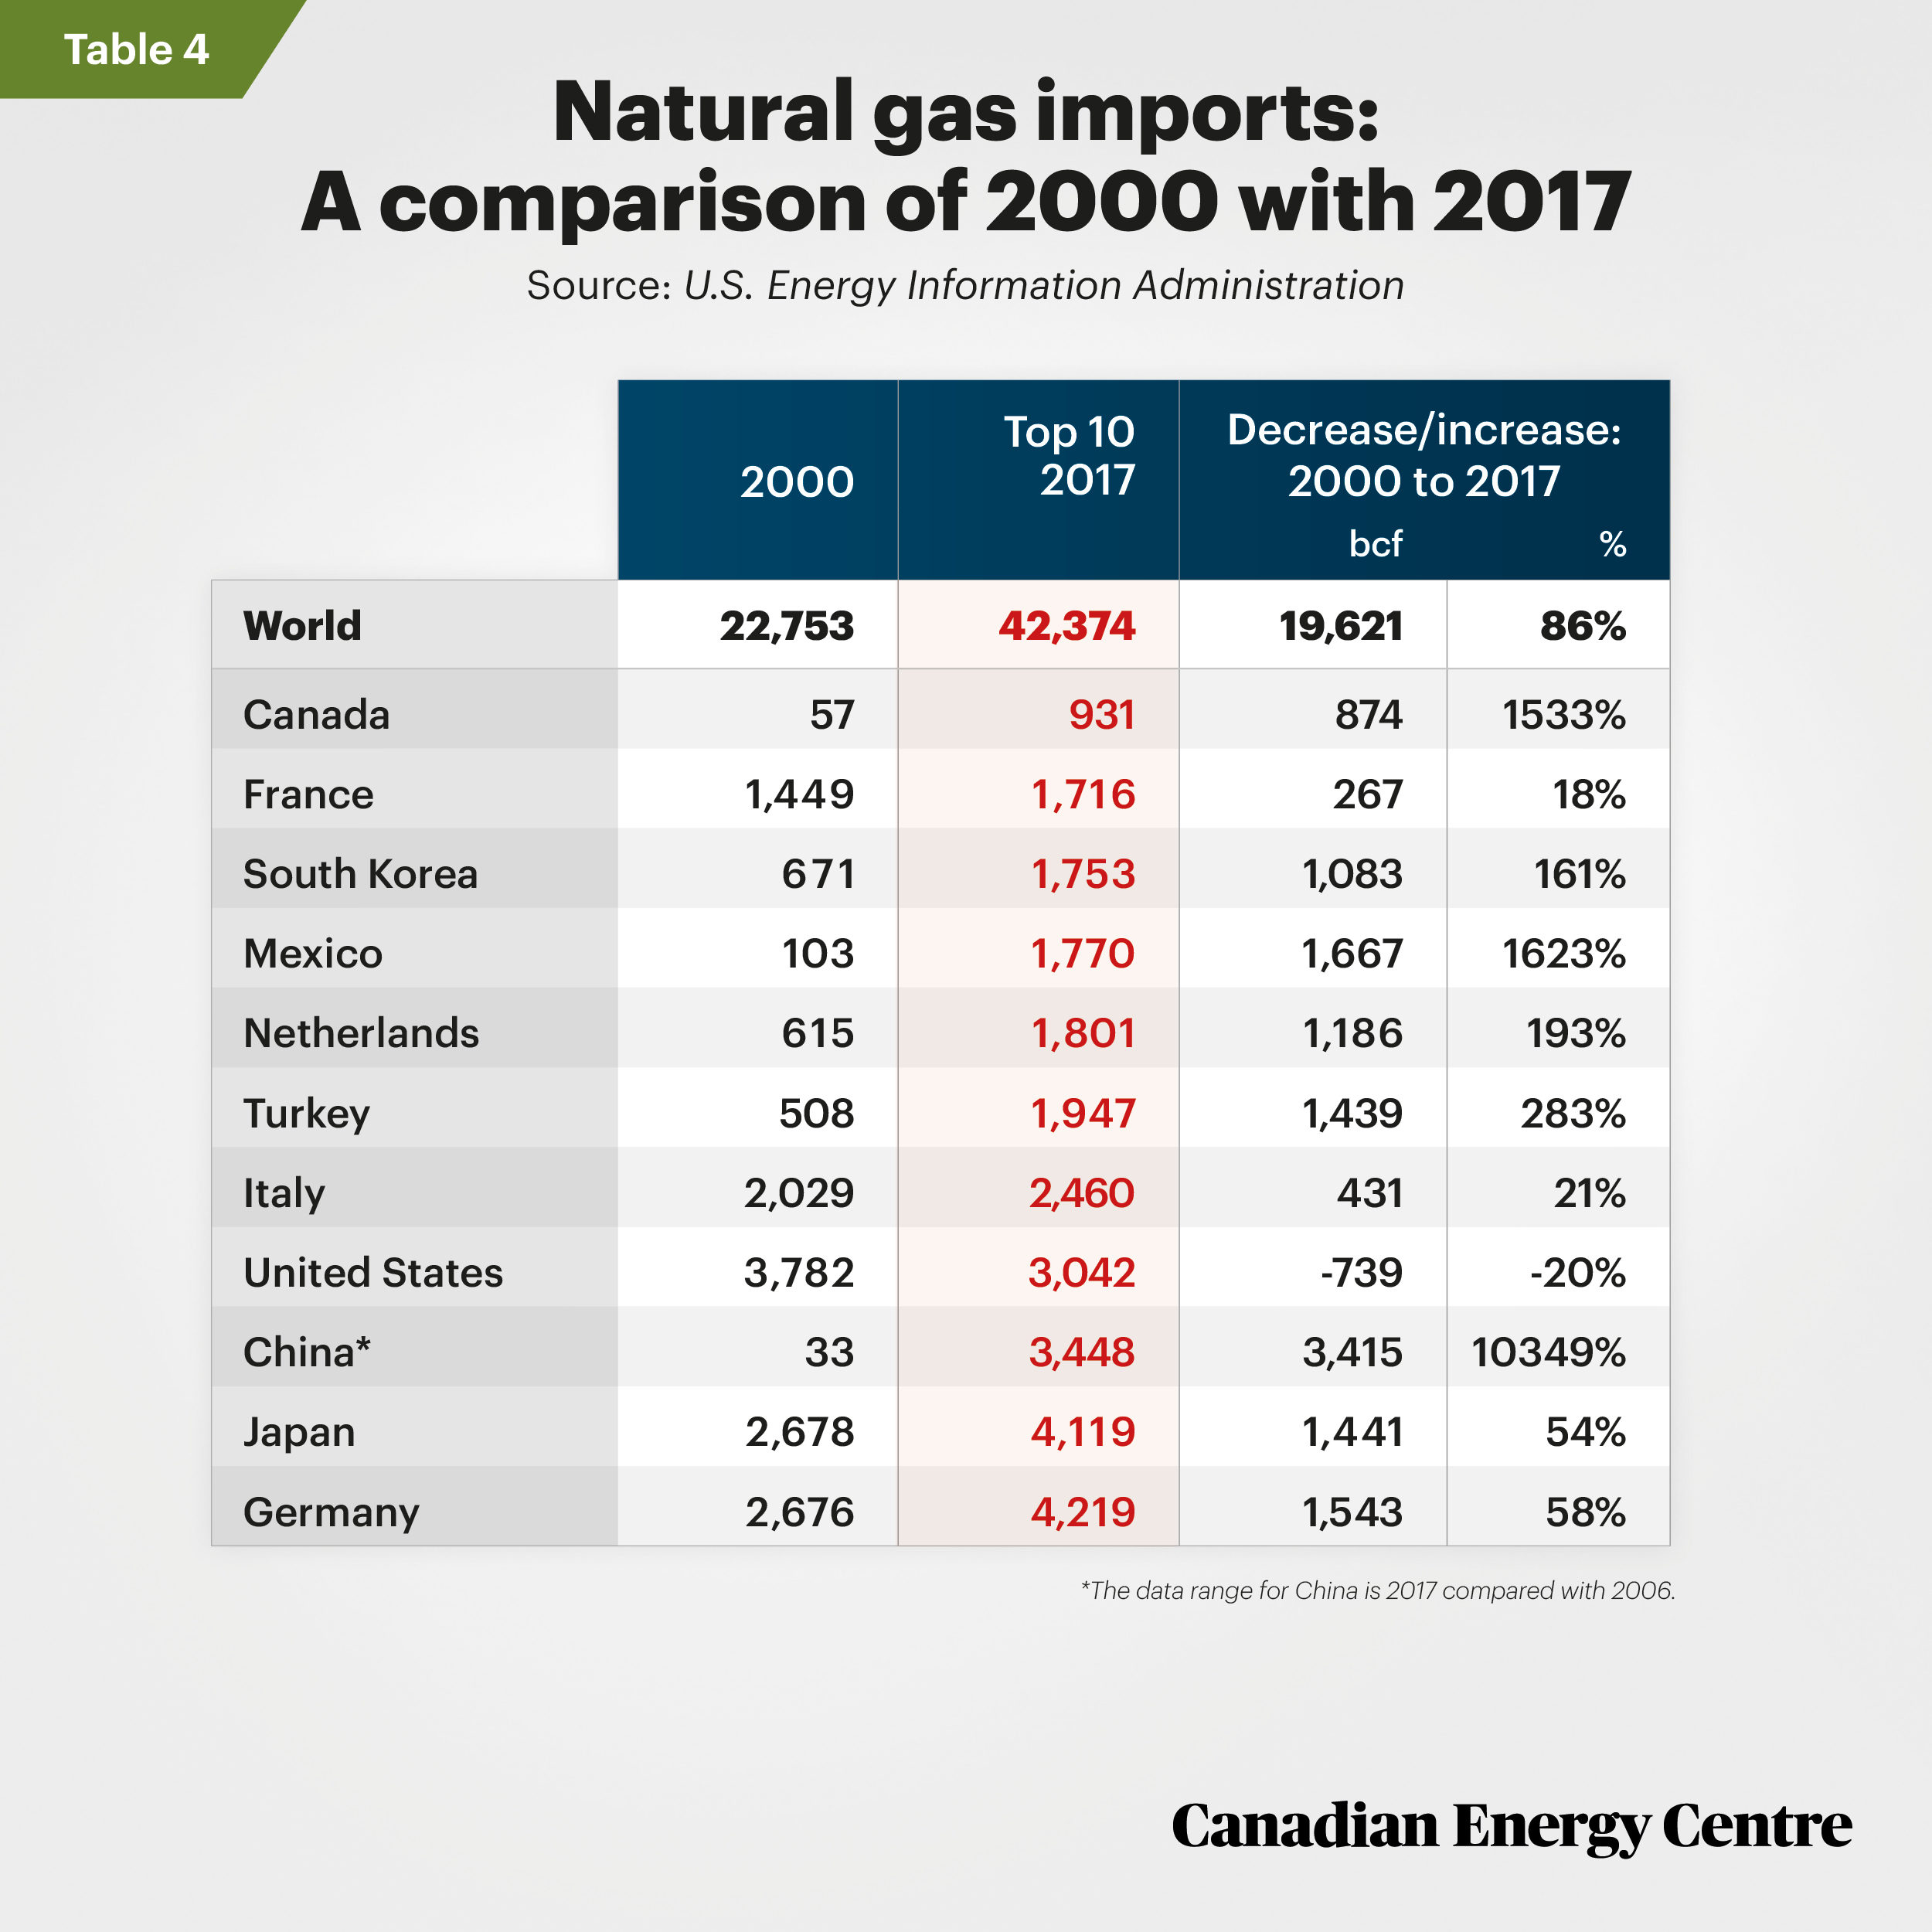
The following countries ranked the top ten for (dry) natural gas imports in 2017: France, South Korea, Mexico, Netherlands, Turkey, Italy, United States, China, Japan, and Germany (Table 4). Canada was not among the top ten importing nations in 2017. However, we added Canada to the comparison to provide a sense of its domestic trends since 2000 relative to other countries. Each country’s 2017 import levels are then compared with 2000, both by bcf (Figure 4a) and by percentage increases (Figure 4b).
Source: U.S. Energy Information Administration
*The data range for China is 2017 compared with 2006
Source: U.S. Energy Information Administration
- Among the top 10 importers of natural gas as of 2017 (compared with 2000), China’s imports of natural gas rose the most, at 3,415 bcf. Mexico’s imports rose by 1,667 bcf and Germany’s by 1,543 bcf.
- Of note, the United States was the only country among the top 10 importers in 2017 to record a decline in natural gas imports, at 739 bcf. (This decline was due to much higher domestic U.S. production, which soared to 27,291 bcf by 2017, up from 19,182 bcf in 2000, or 42 per cent more. The United States thus required significantly less natural gas imports, notably from Canada.) US imports were down by 20 per cent in 2017 compared with 2000.
- Data for China’s imports of natural gas in 2000 were unavailable, but stood at 33 bcf in 2006 and 3,448 bcf in 2017, a rise of 10,349 per cent. Given the low base for China, it has been excluded from Figure 4b.
- Imports of natural gas to all countries worldwide (beyond just the 10 nations profiled here) was up by 86 per cent by
2017 when compared with 2000.
Source: U.S. Energy Information Administration
*China is excluded from Figure 4b given that its figure (based on 2006) would result in a
10,349 per cent measurement and flatten the other comparisons as to make the comparison
unreadable
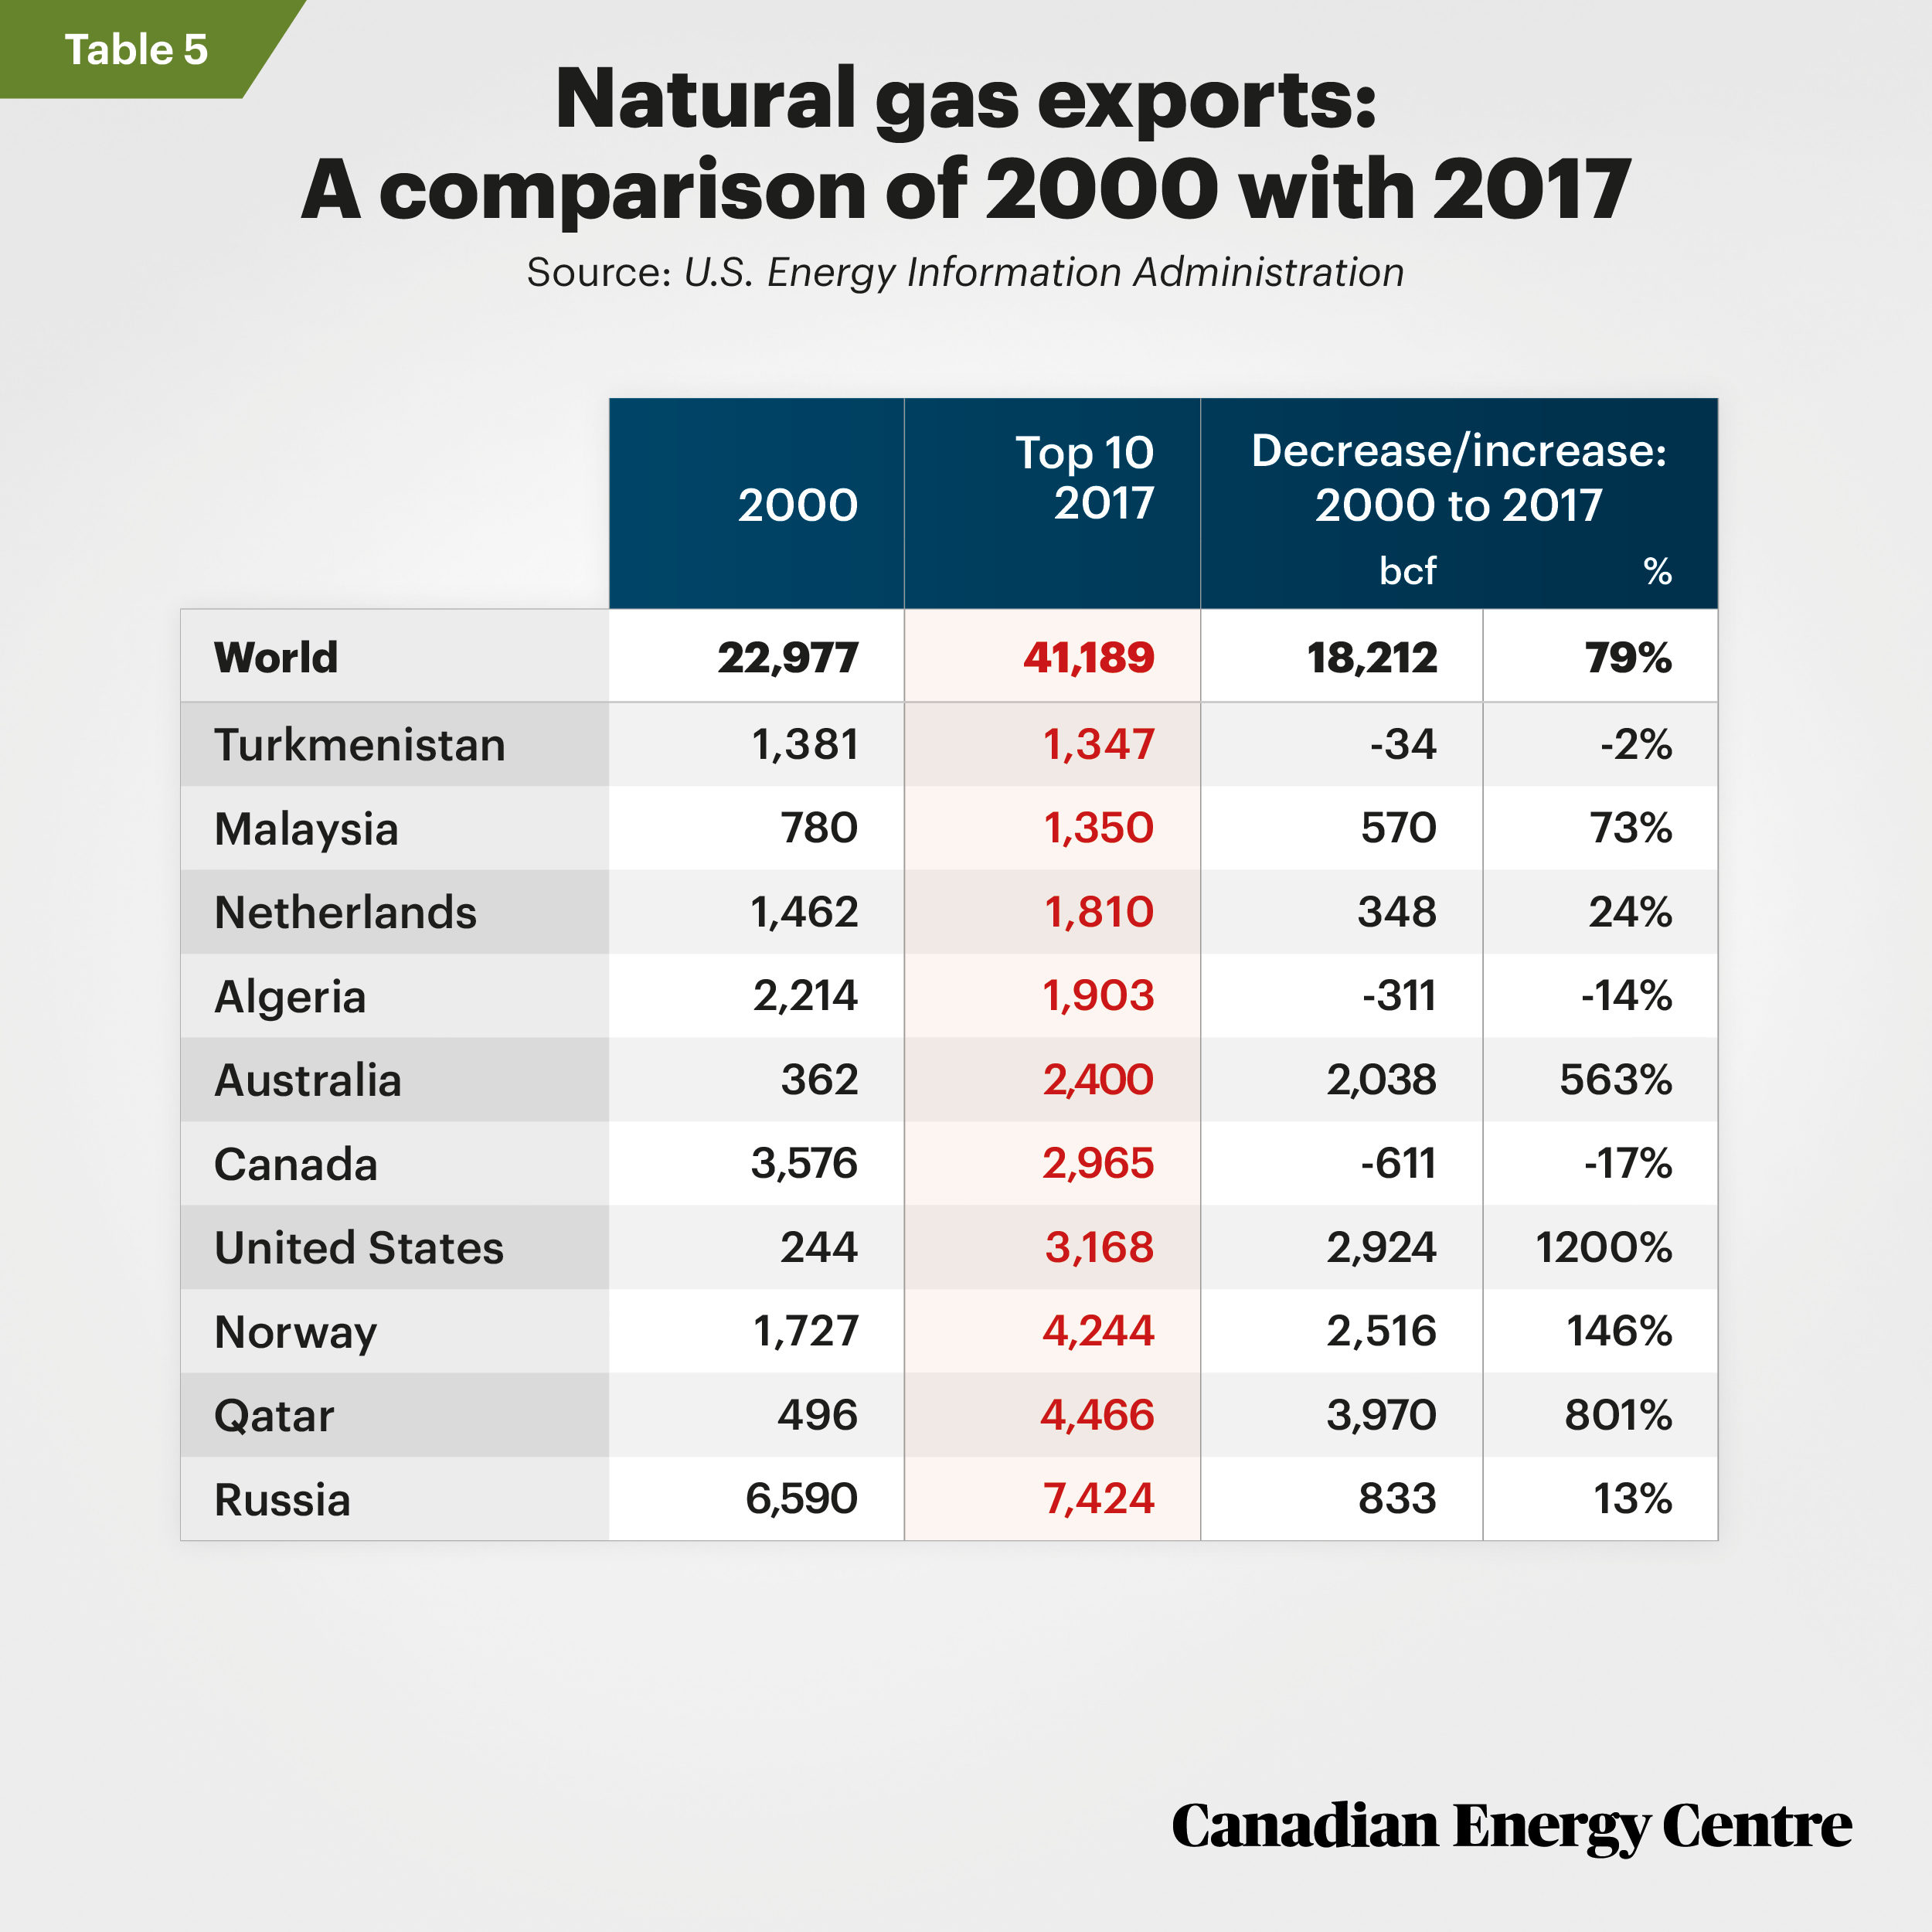
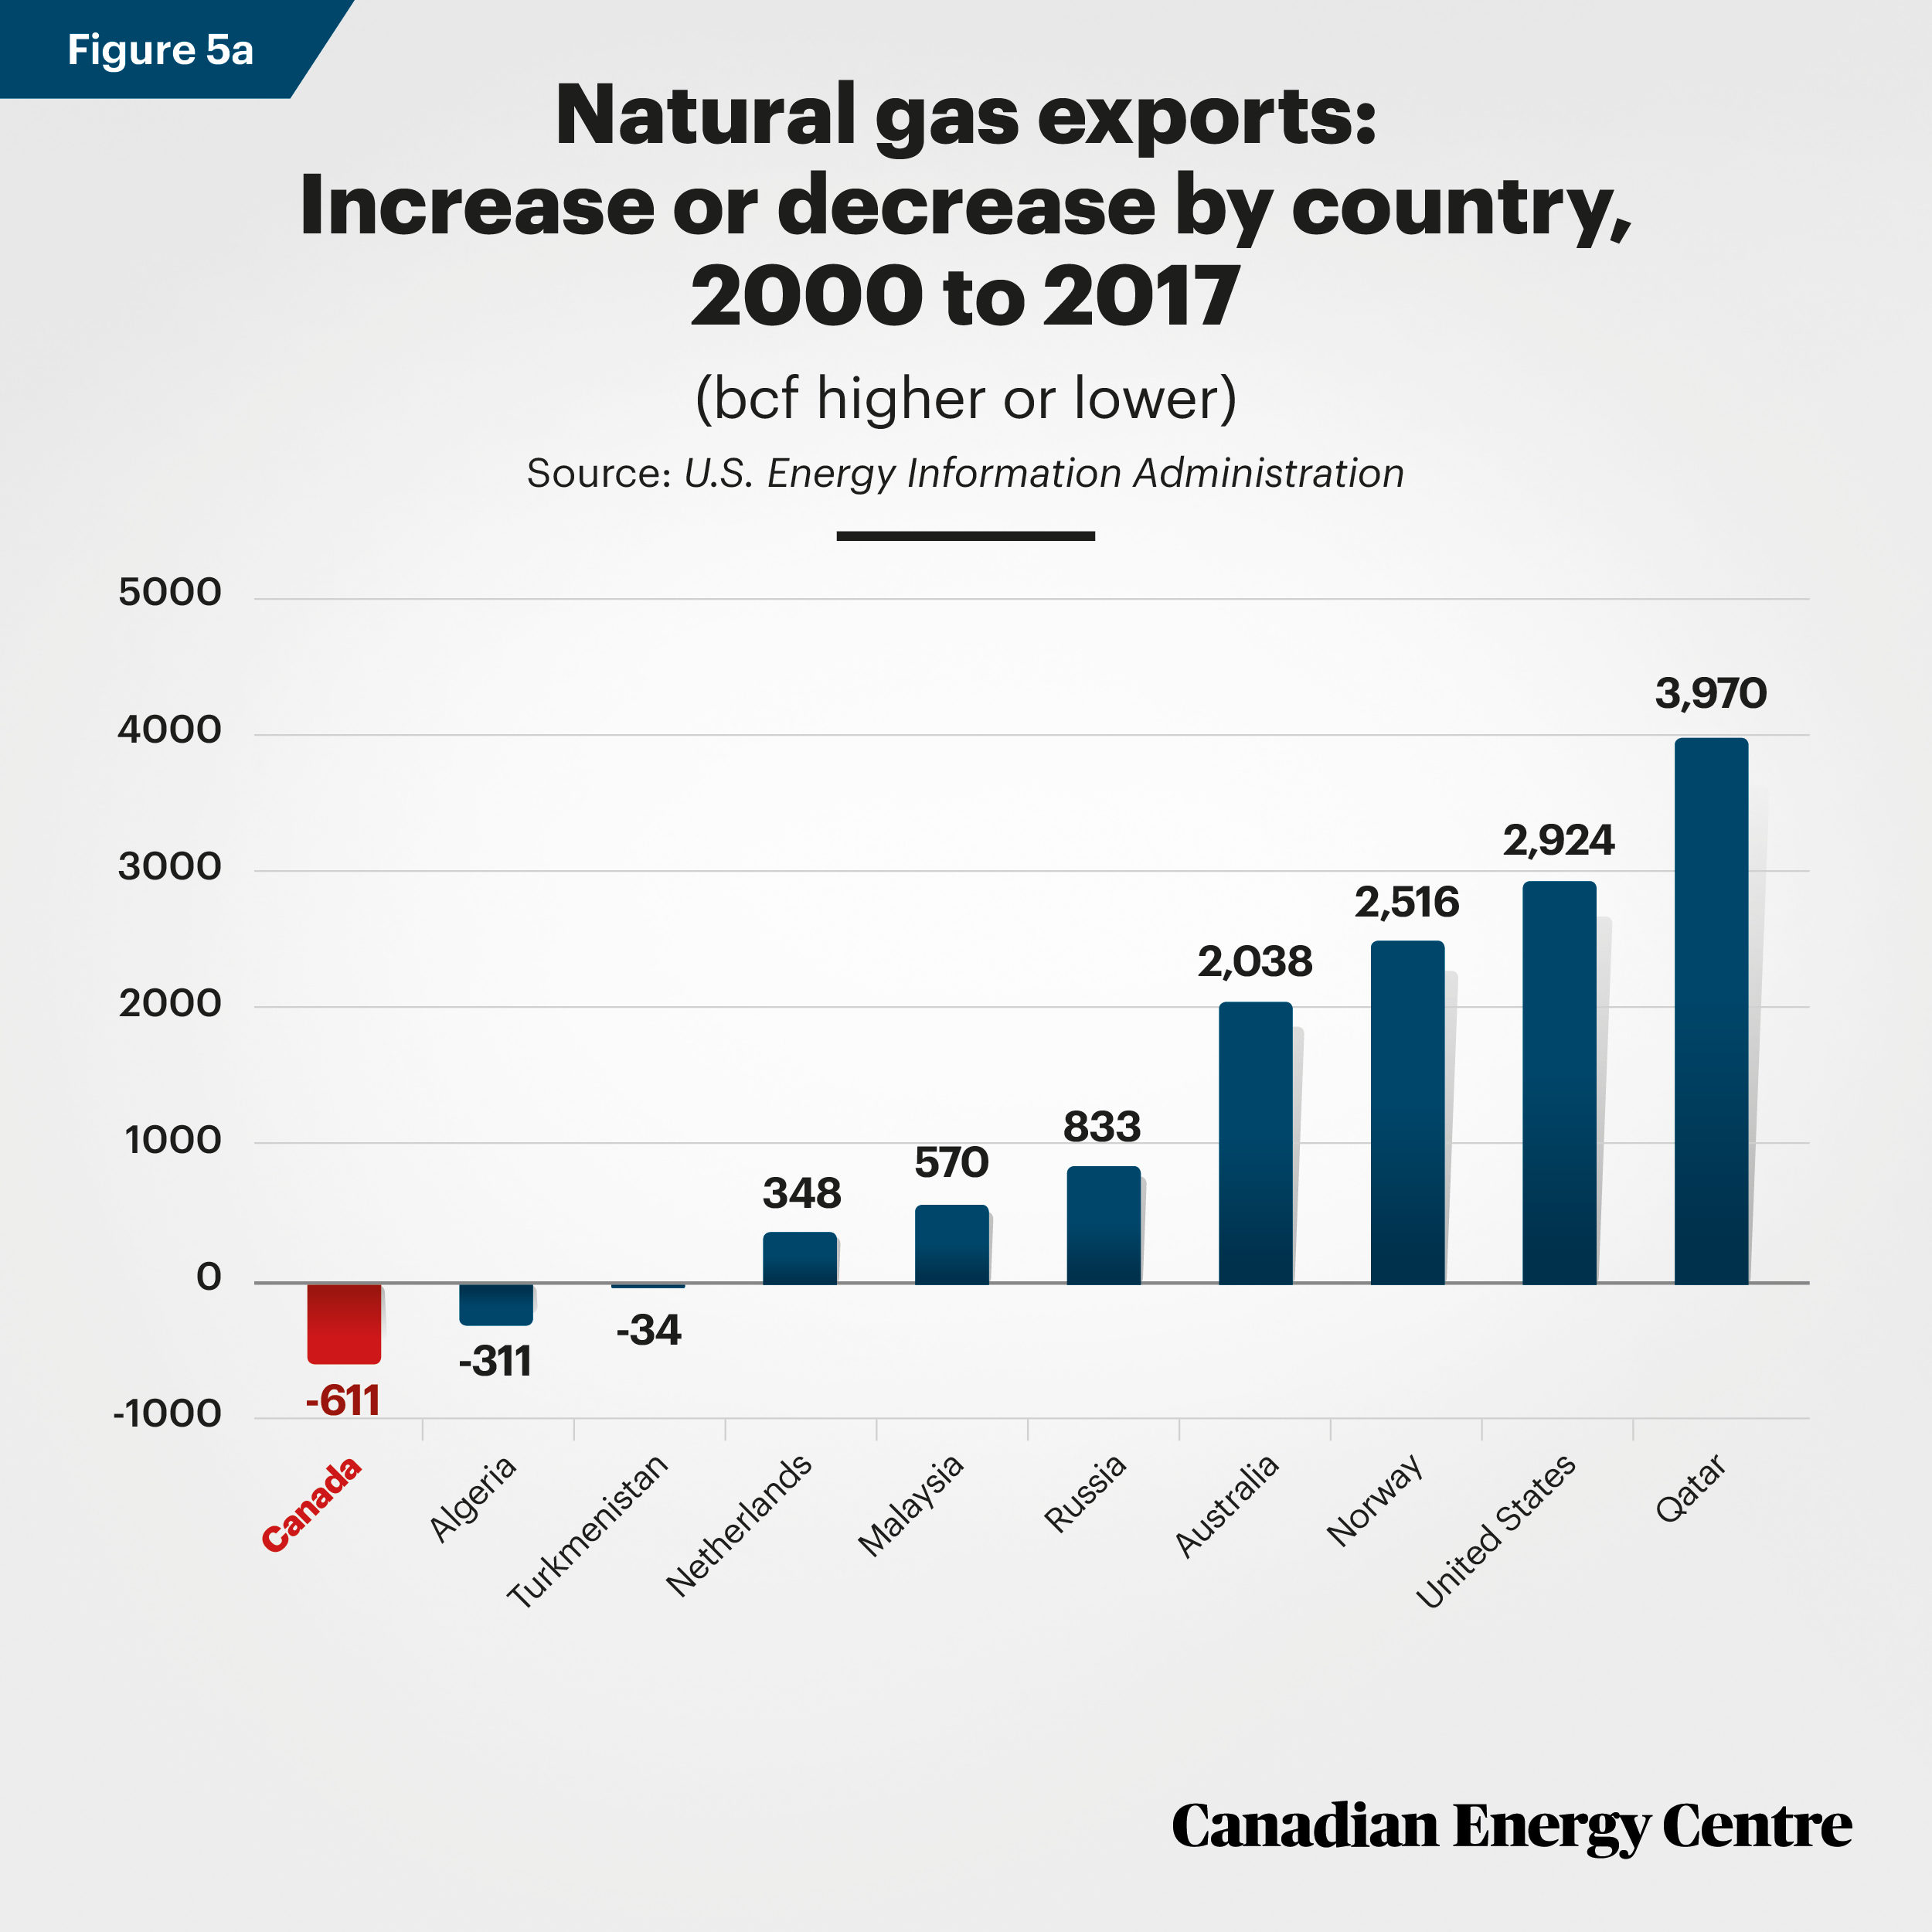
Natural gas exports by country: The top ten in 2017 and trends since 2000
The following countries ranked the top ten in 2017 for (dry) natural gas exports (Table 5): Turkmenistan, Malaysia,Netherlands, Algeria, Australia, Canada, United States, Norway, Qatar, and Russia. Each country’s 2017 exports levels are compared with 2000, both by bcf (Figure 5a) and by percentage increases (Figure 5b).
Source: U.S. Energy Information Administration
Source: U.S. Energy Information Administration
- Among the top ten exporters of natural gas in 2017 (compared with 2000), Qatar saw the largest rise in exports (3,970 bcf). The two countries with the next highest increases were the United States (up by 2,924 bcf) and Norway (up by 2,516 bcf).
- Three nations exported less natural gas in 2017 than in 2000: Turkmenistan (-34 bcf), Algeria (-311 bcf) and Canada (-611 bcf).
- Measured as a percentage, the three countries with the highest increase in natural gas exports (in 2017 relative to 2000) were the United States, whose exports rose by 1,200 per cent, Qatar (up by 801 per cent) and Australia (up by 563 per cent).
- The three nations with the greatest percentage declines in natural gas exports (2017 relative to 2000) were Turkmenistan (-2 per cent), Algeria (-14 per cent) and Canada (-17 per cent).• Worldwide (beyond just the ten nations profiled here), exports of natural gas rose by 18,212 bcf in 2017 when compared with 2000, a 79 per cent increase.
Source: U.S. Energy Information Administration
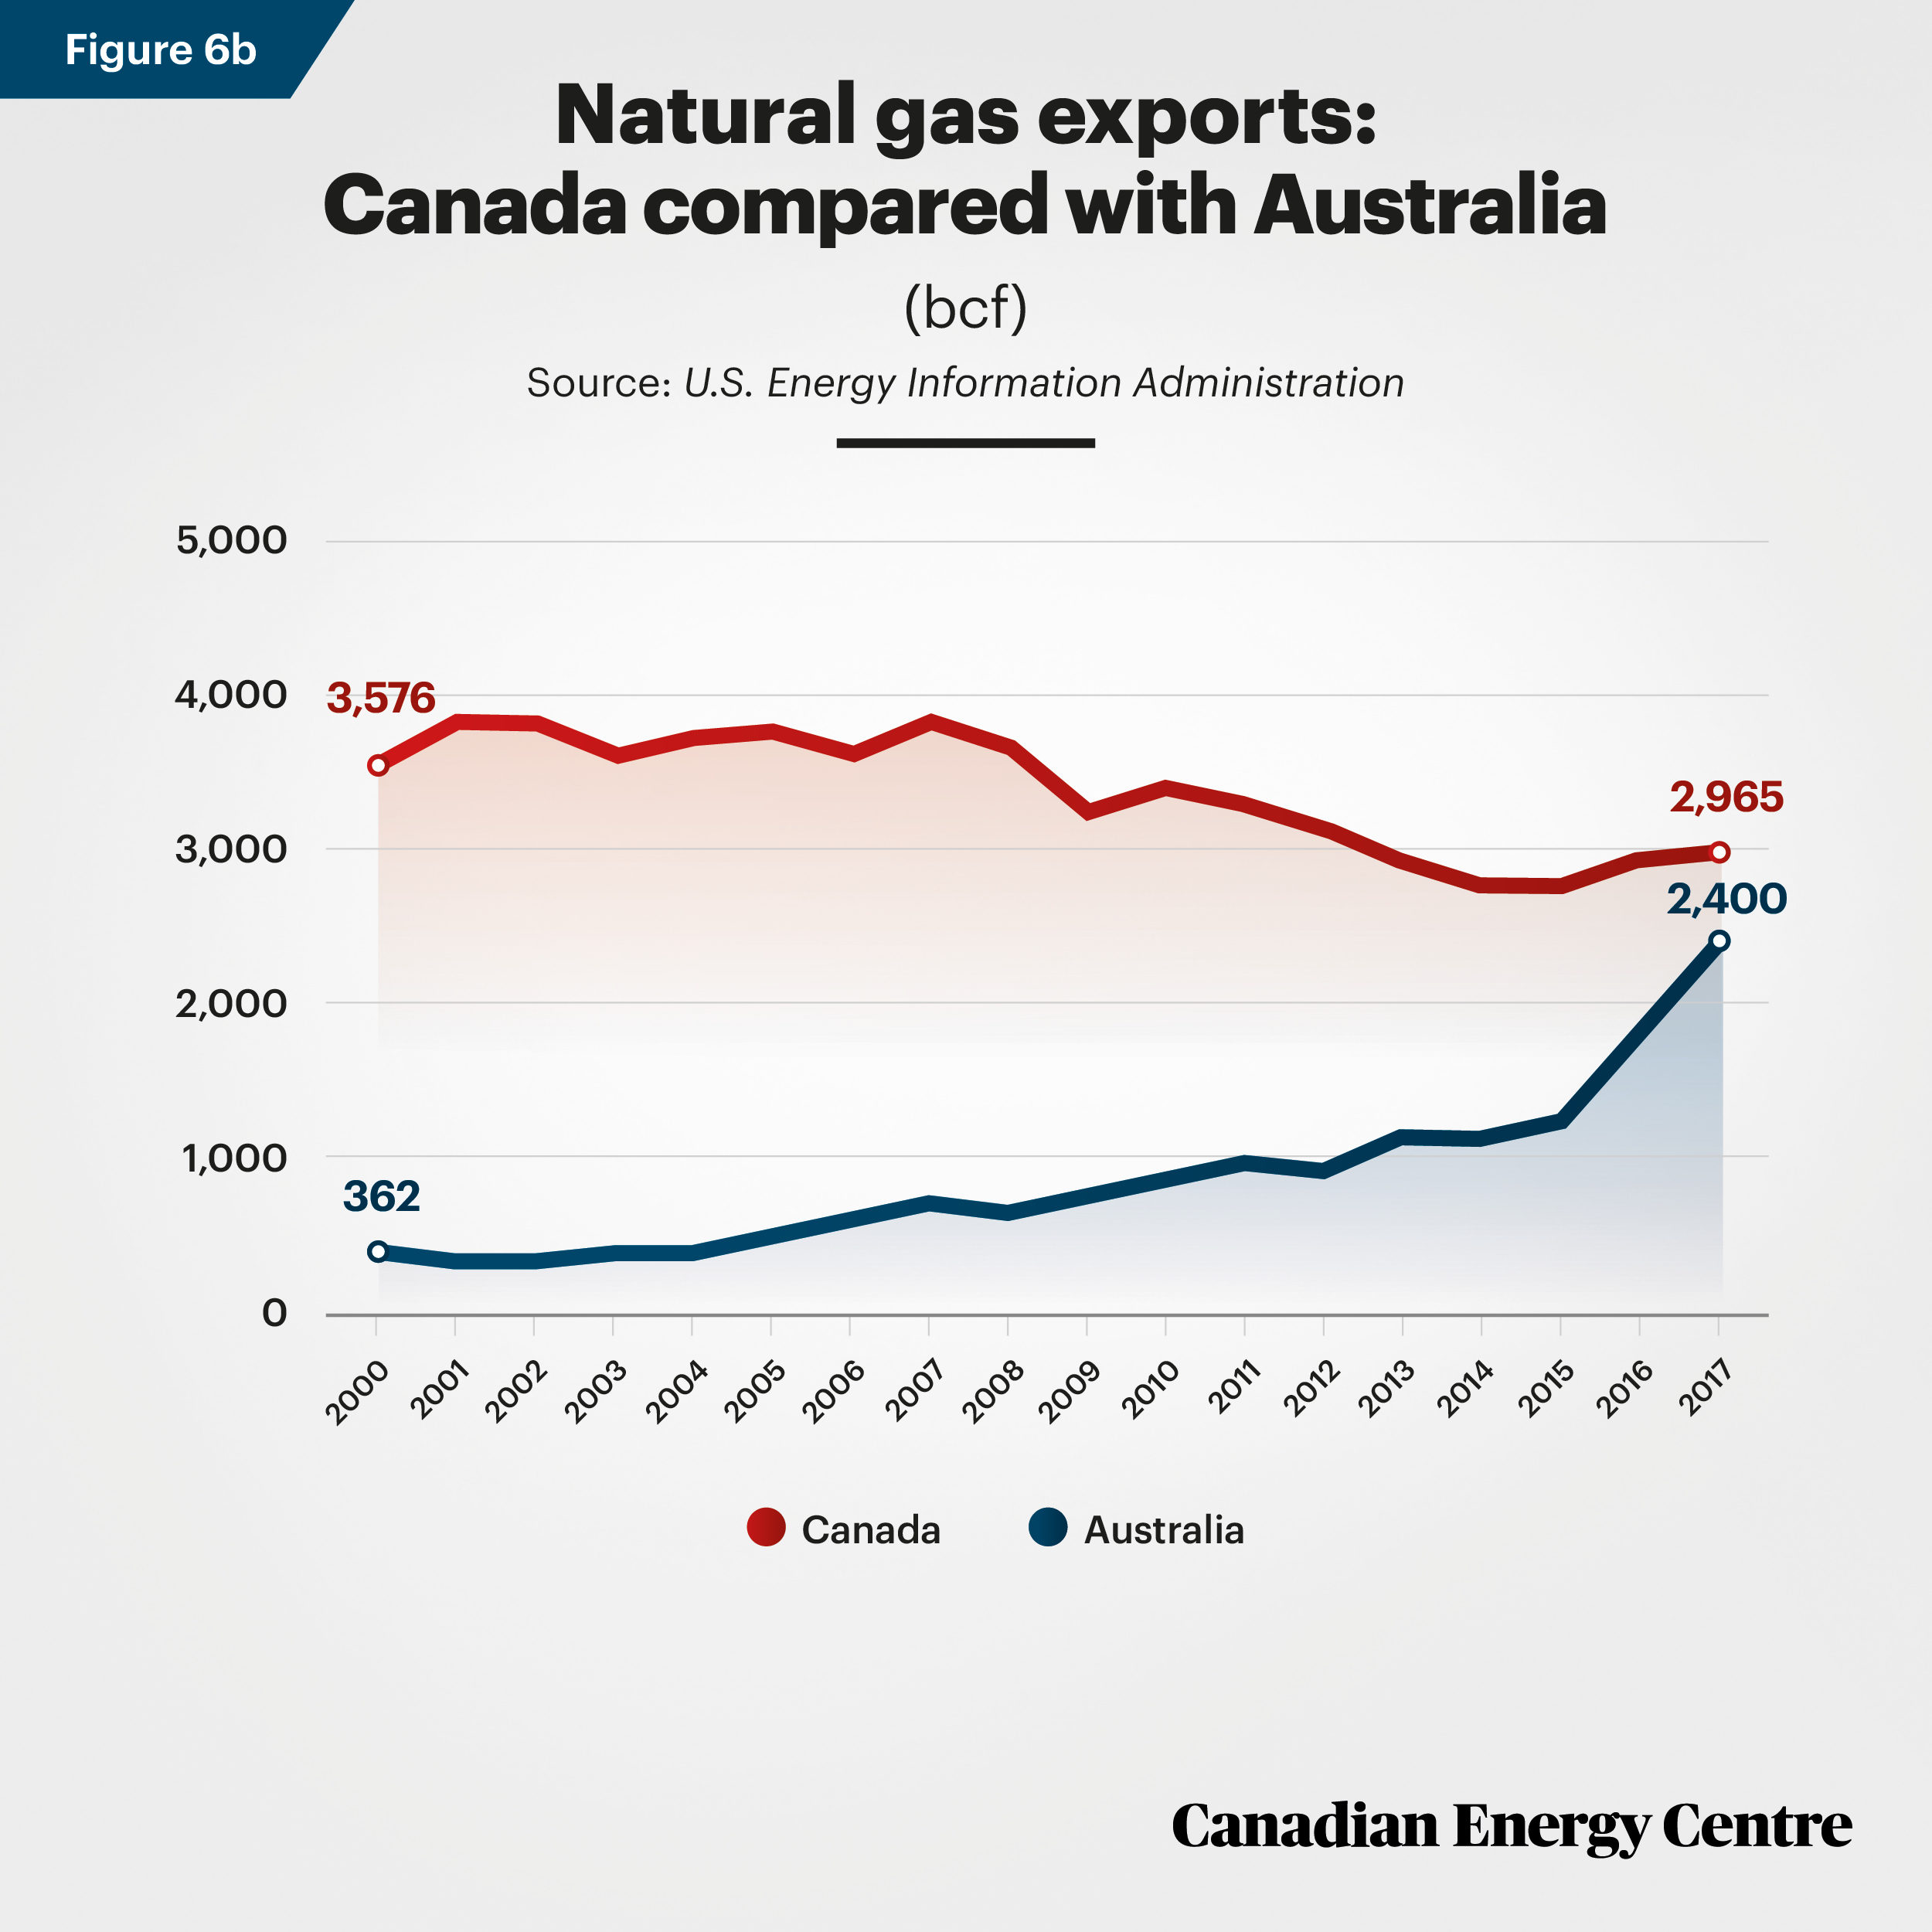
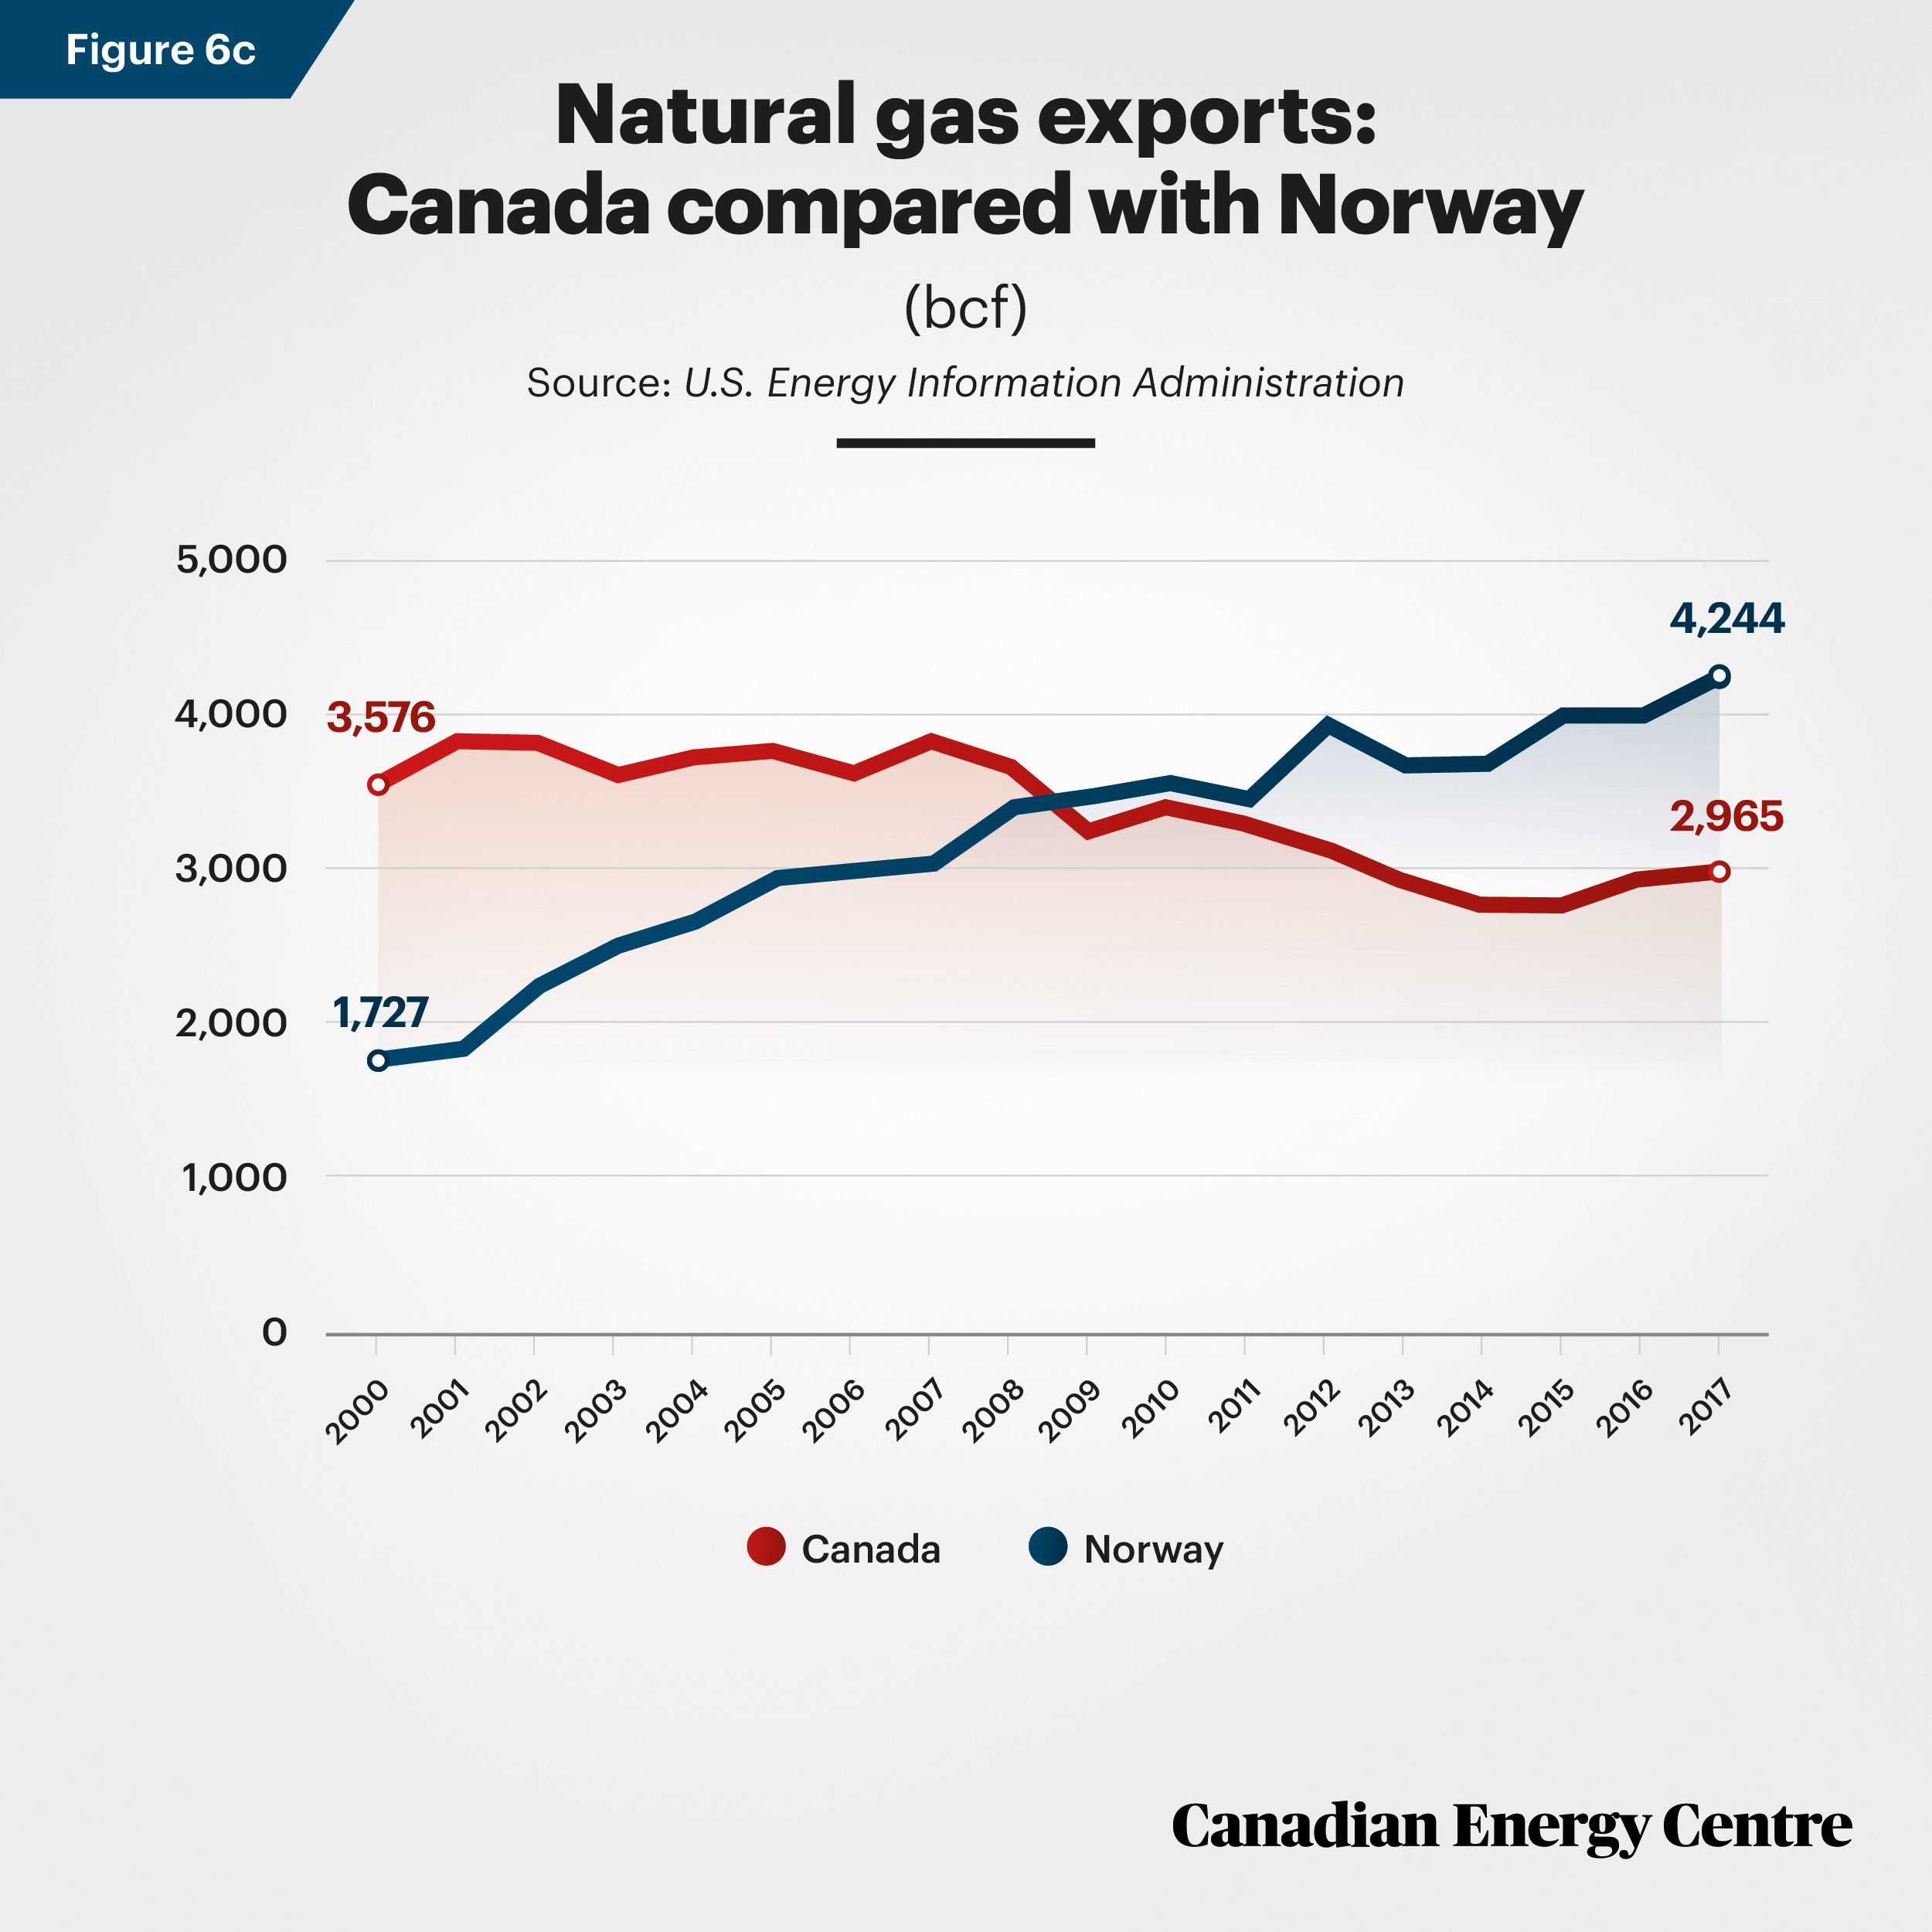
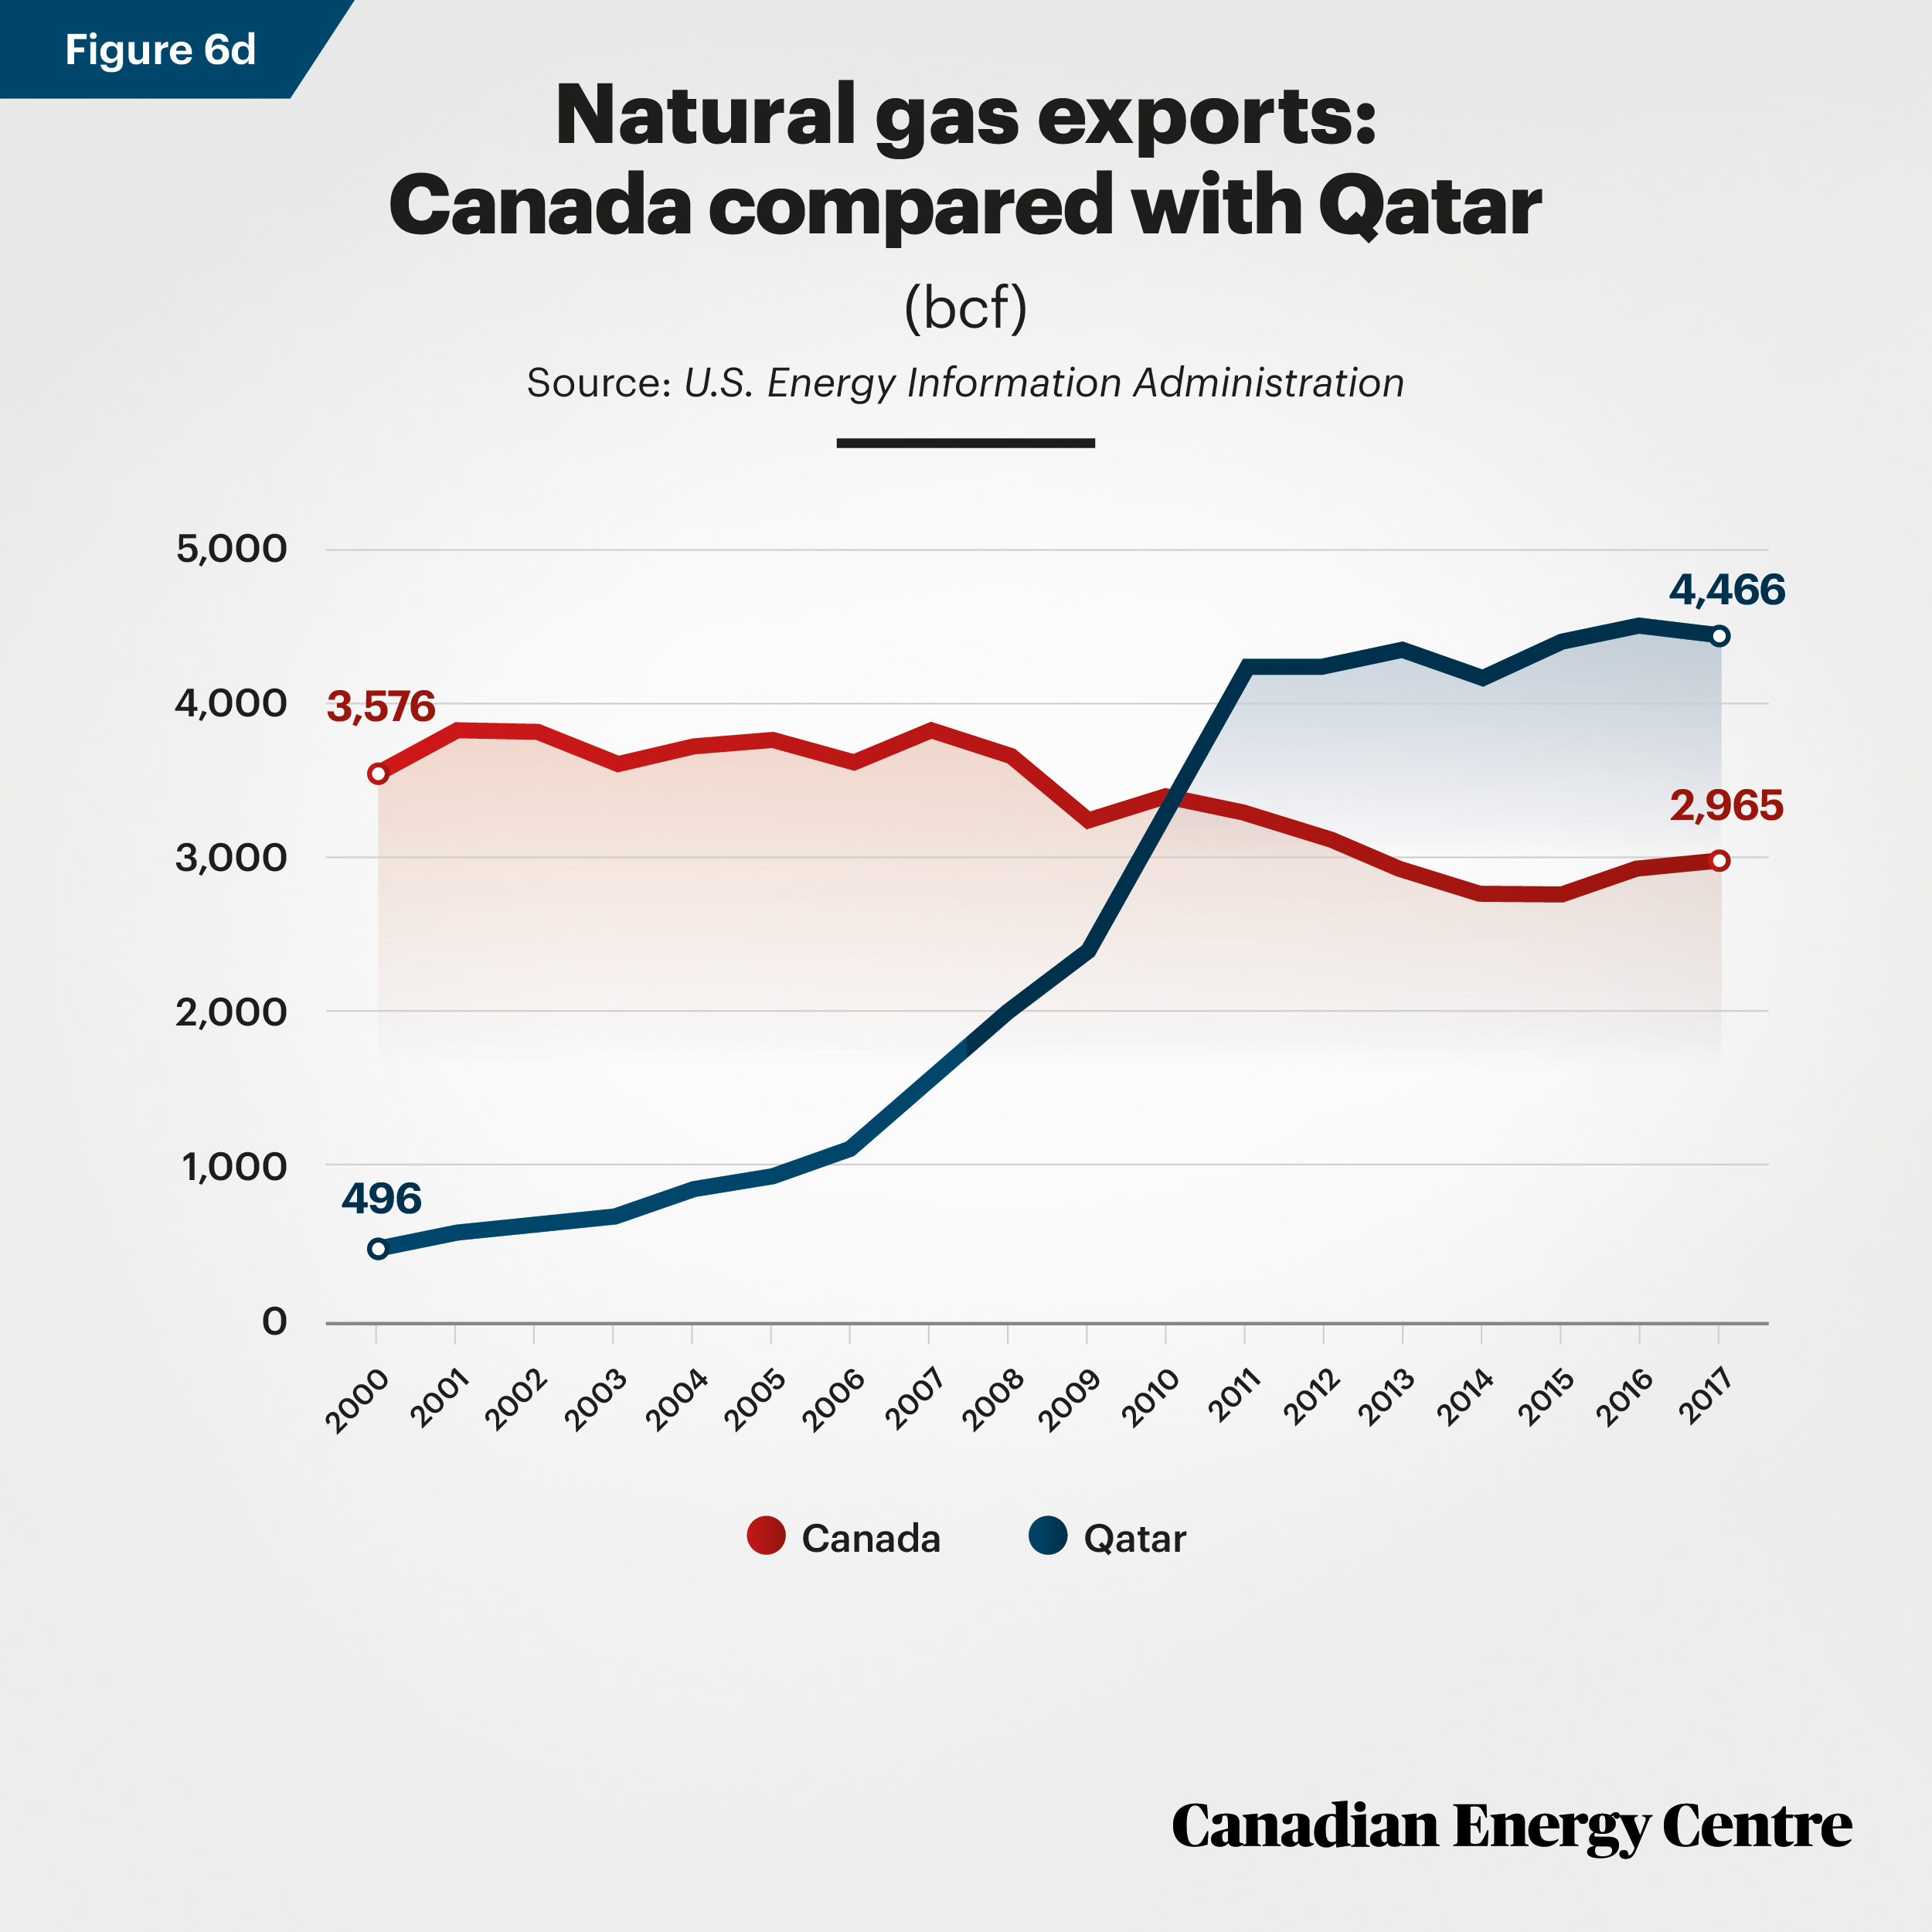
Canada’s natural gas exports compared with selected countries: Australia, Norway, Qatar, Russia, and the US
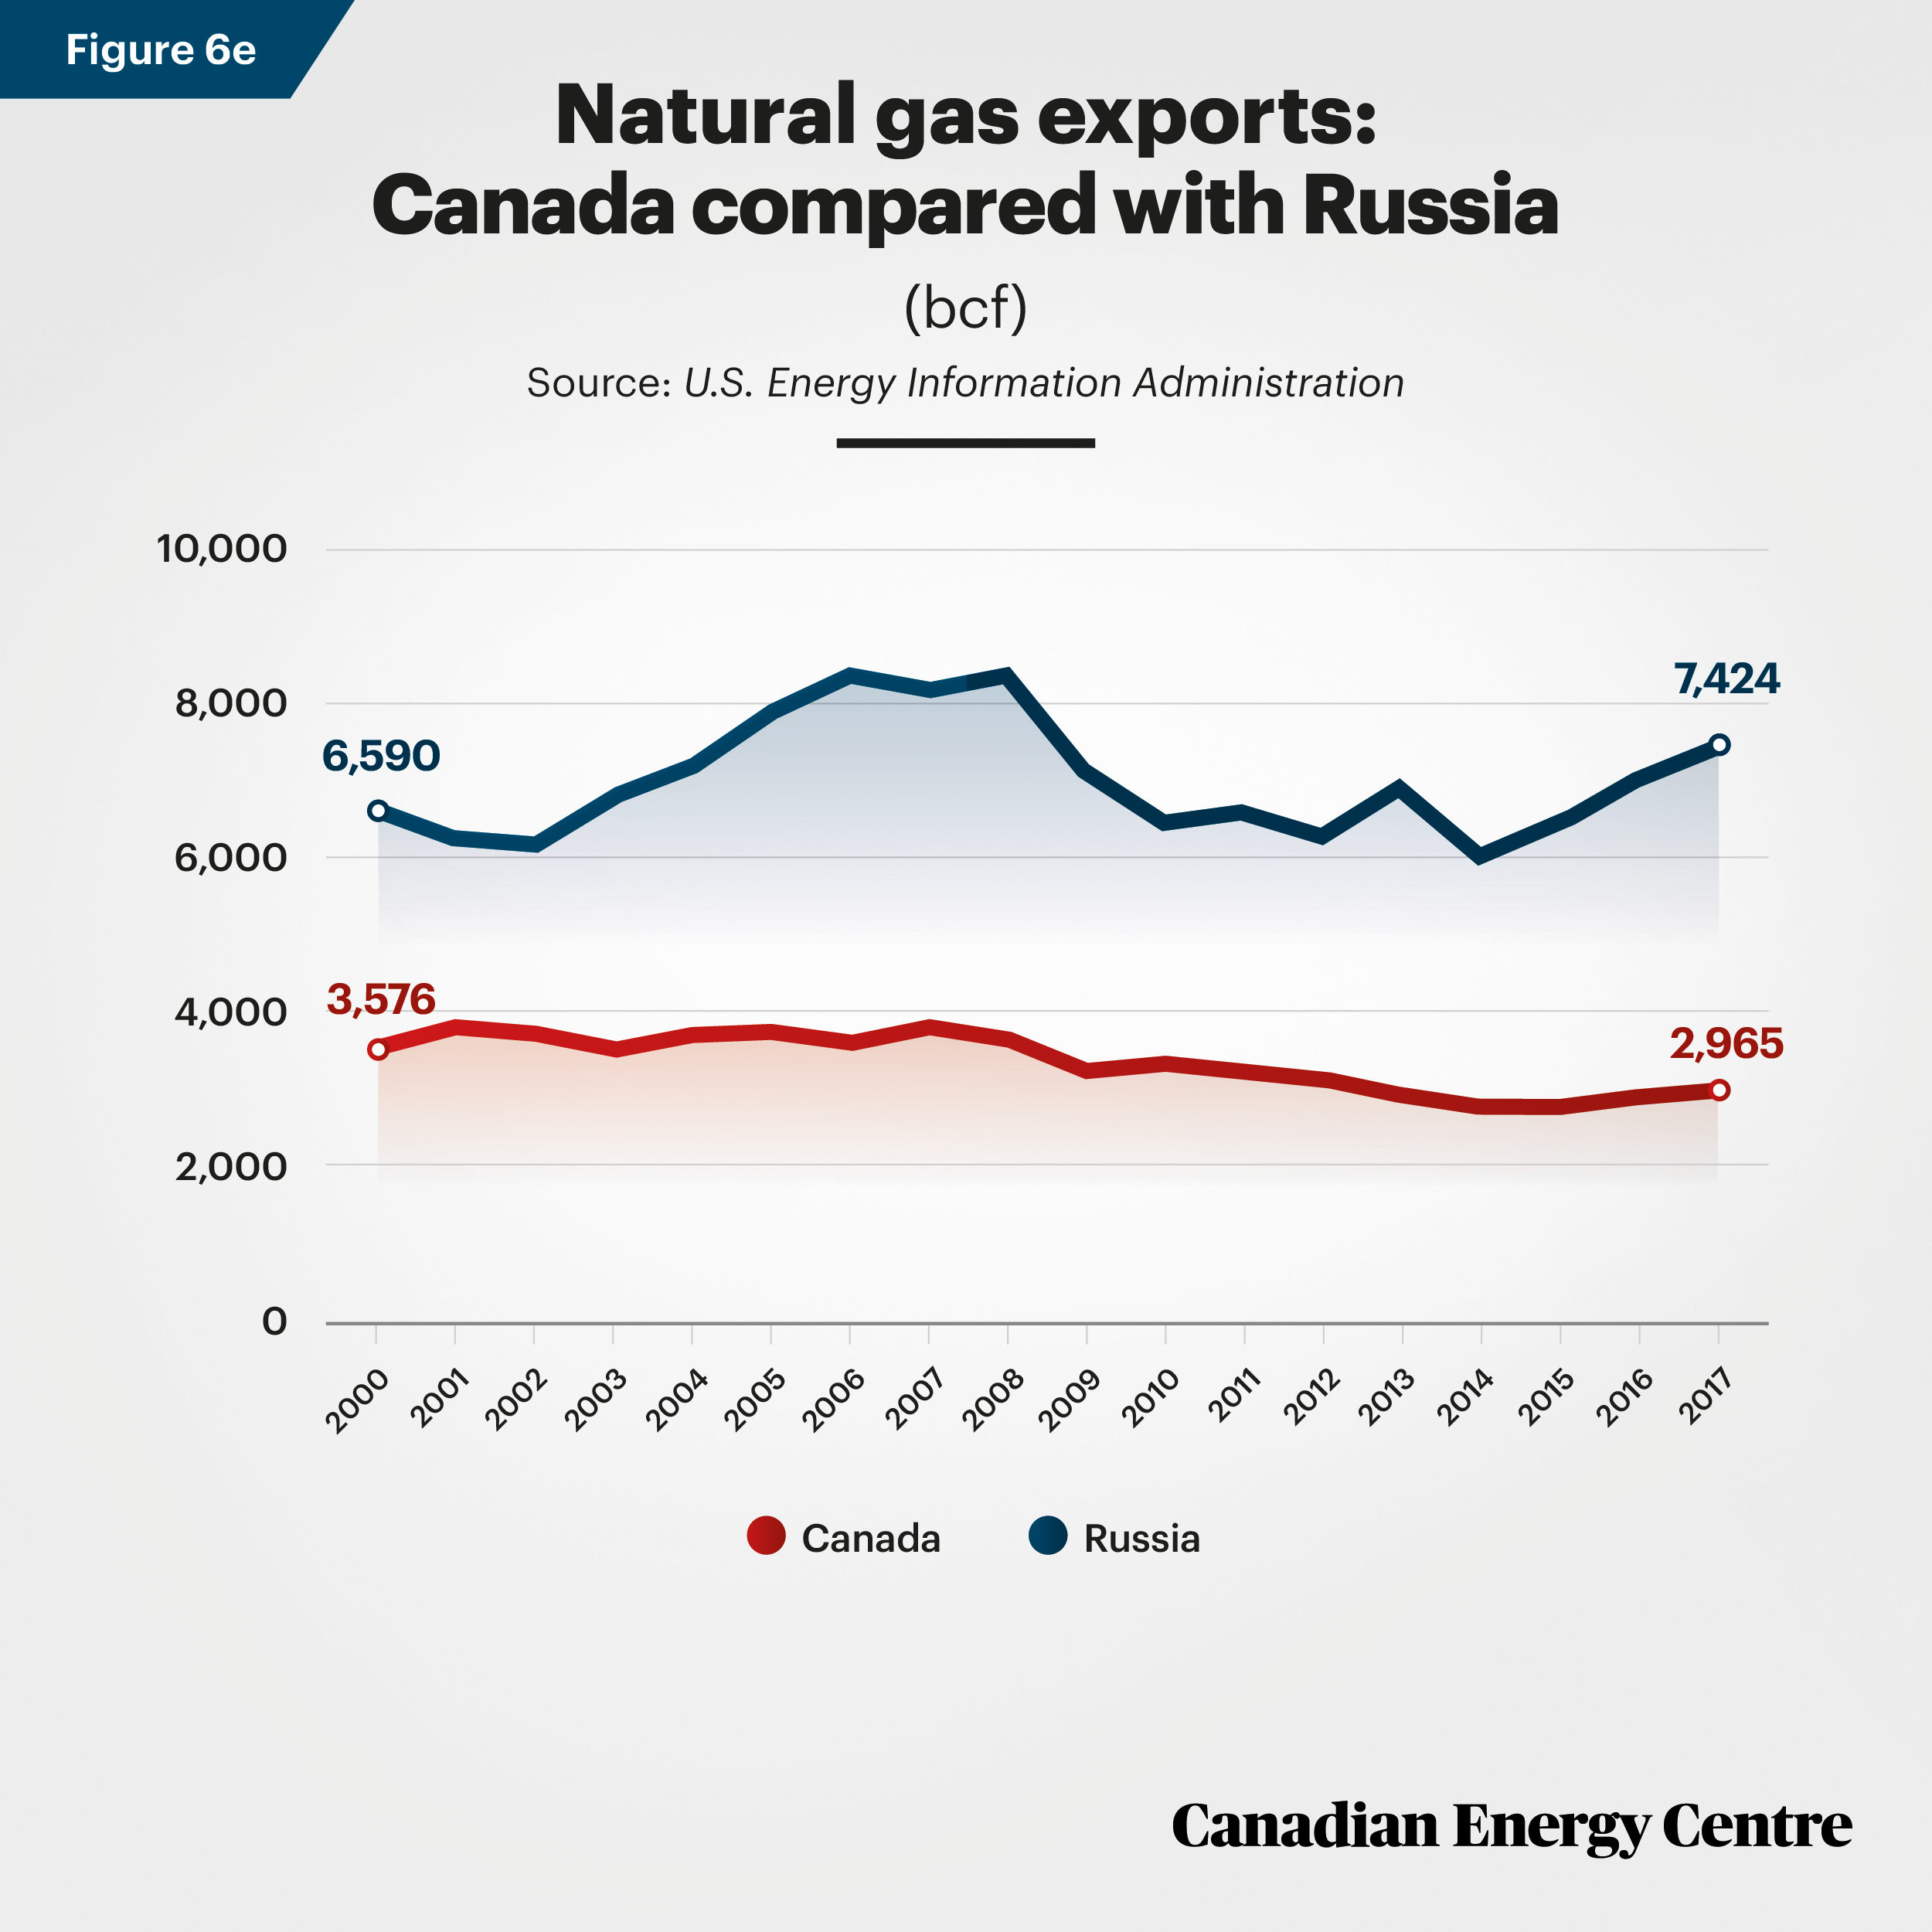
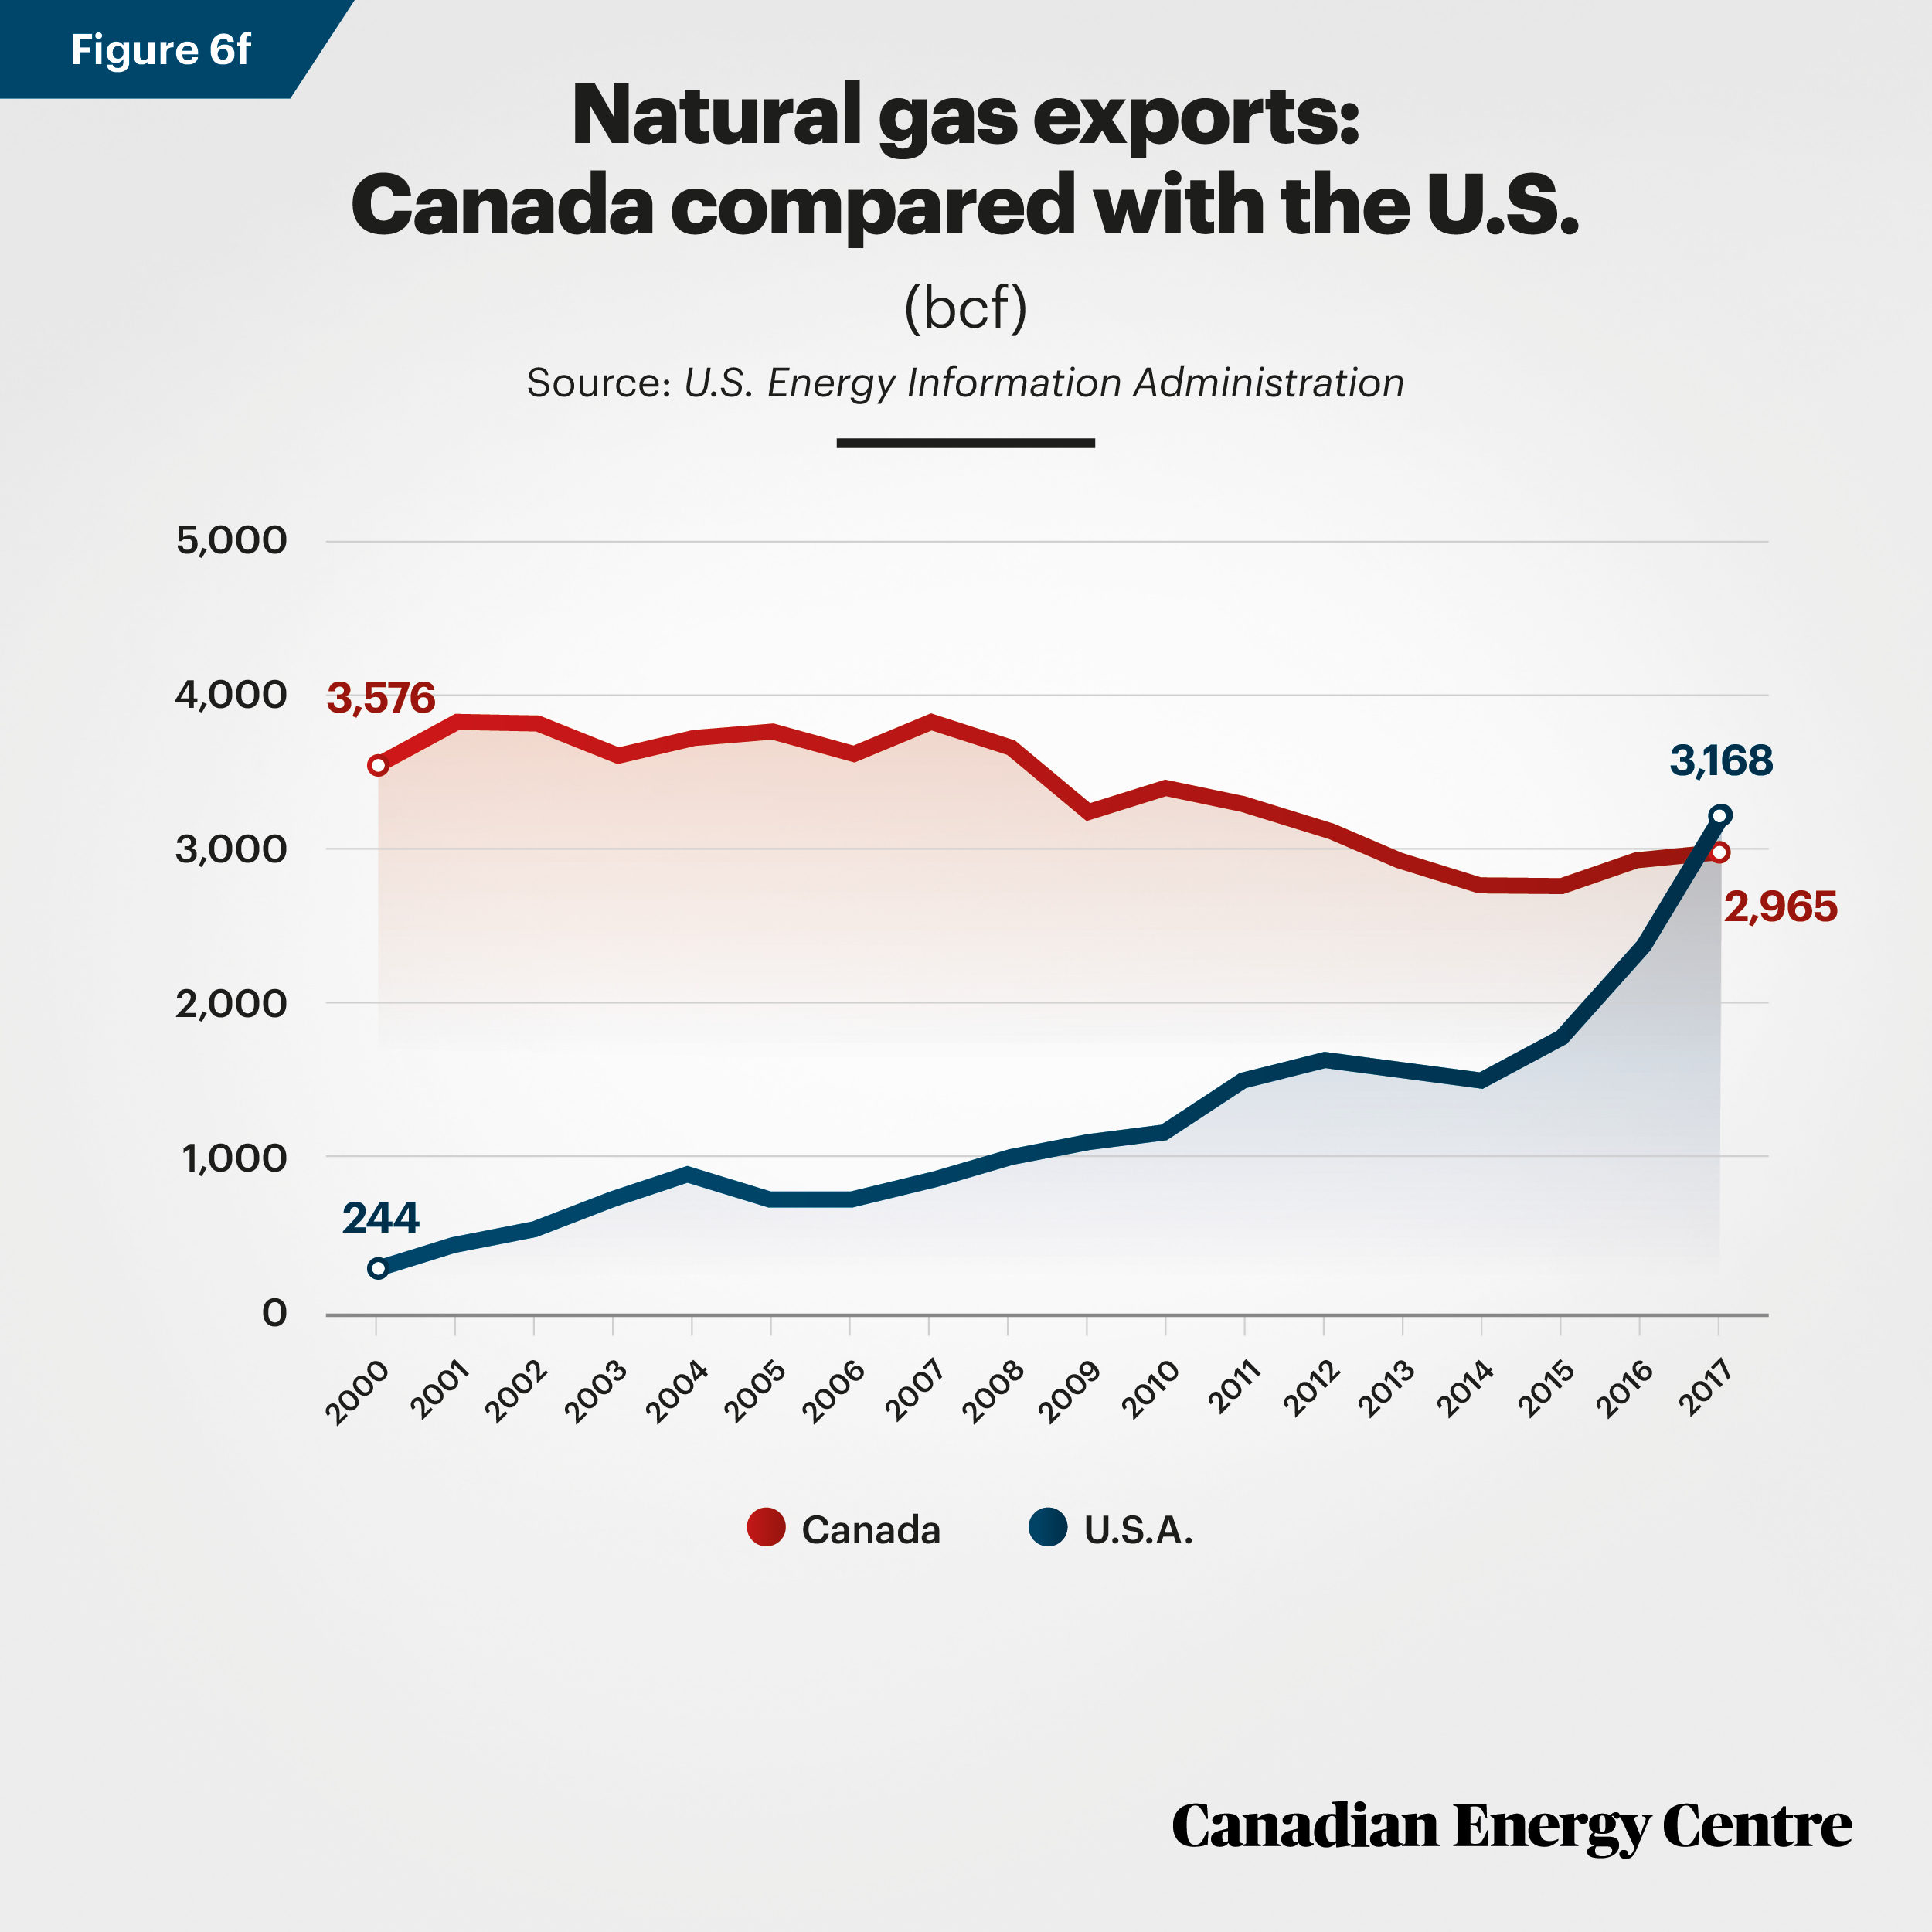
Worldwide exports of natural gas have risen by 79 per cent (2017 relative to 2000), but Canada’s exports have declined by 17 per cent over the same 18-year period. Canada exported 2,965 bcf of natural gas in 2017 compared with 3,576 bcf in 2000. The decline was due mainly to a drop in natural gas exports to the United States and a failure to capture new
export markets elsewhere in the world.
Meanwhile, US exports of natural gas to Canada hit new high of 3.3 bcf per day in February 2019, according to the US Energy Information Administration, which the agency described as the “highest level on record” (US EIA 2019). The United States is making inroads into the Canadian market even as Canada loses market share in the United States. More generally, Canada’s main competitors (the top five of six exporters, a list which includes Canada) have increased their exports substantially. Relative to 2000 and as of 2017:
• Russia’s exports of natural gas are up 13 per cent
• Norway’s exports are up 146 per cent
• Australia’s exports are up 563 per cent
• Qatar’s exports are up 801 per cent
• US exports are up 1,200 per cent
Source: U.S. Energy Information Administration
Source: U.S. Energy Information Administration
Source: U.S. Energy Information Administration
Source: U.S. Energy Information Administration
Source: U.S. Energy Information Administration
Source: U.S. Energy Information Administration
Summary
Consumption: Worldwide, natural gas consumption has risen continually since 2000 with the exception of the 2008/09 recession. Global natural gas consumption increased by 52 per cent from 2000 to 2017. The rise in consumption in Canada was lower (47 per cent) while Japan (54 per cent) Mexico (96 per cent), Saudi Arabia (119 per cent), Iran (229 per cent) and China (834 per cent) were higher than the worldwide figure.
Production: Of the top ten countries producing natural gas in 2017, relative to 2000 only Canada produced less in absolute terms (851 bcf, or 13 per cent less). Natural gas production in the other nine nations ranged from 12 per cent higher in Algeria to 472 per cent higher in Qatar.
Imports: Between 2000 and 2017, natural gas imports rose most in China (3,415 bcf) an increase of 10,348 per cent, while Mexico’s imports rose by 1,667 bcf, or 1,623 per cent. Canada’s imports rose by 874 bcf or 1,533 per cent between 2000 and 2017.
Exports: Of particular note for Canada’s export potential, of five competitors to Canada for export markets, relative to 2000 by 2017 export volumes rose in Russia (13 per cent), Norway (146 per cent), Australia (563 per cent), Qatar (801 per cent) and the United States (1,200 per cent). Worldwide exports of natural gas rose by 79 per cent on average in that period while Canadian exports declined by 17 per cent.
————————————————————————————————————————————————————————————
Sources
Carpenter, Claudia (2020, February 16). “Saudi Arabia Aims to Export Gas in Near Future: Energy Minister.” S&P Global Platts. <https://bit.ly/2uRvD8C>, as of February 19, 2020. US Energy Information Administration [EIA] (Undated).” Glossary. US EIA <https://bit.ly/3aHiSfU>, as of March 10, 2020. US Energy Information Administration [EIA] (2019). “Worldwide Natural Gas Outlook.” US EIA <https://bit.ly/2U05JrI>, as of February 27, 2020. US Energy Information Administration [EIA] (2019). “Canada Is a Key Energy Trade Partner to the United States.” US EIA <https://bit.ly/2I3g14F>, as of February 27, 2020. US Energy Information Administration [EIA] (2020). International: Natural Gas. US EIA. <https://bit.ly/2vKxGv8>, as of February 19, 2020.
About the authors
This CEC Research Brief was compiled by Mark Milke, Executive Director—Research for the Canadian Energy Centre, and Lennie Kaplan, Chief Research Analyst at the Canadian Energy Centre: www.canadianenergycentre.ca.
Acknowledgements
The authors and the Canadian Energy Centre would like to thank and acknowledge the assistance of two anonymous reviewers.
Creative Commons Copyright
Research and data from the Canadian Energy Centre (CEC) is available for public usage under creative commons copyright terms with attribution to the CEC. Attribution and specific restrictions on usage including non-commercial use only and no changes to material should follow guidelines enunciated by Creative Commons here: Attribution-NonCommercial-NoDerivs CC BY-NC-ND