Canadian employment stalls for a decade
This Fact Sheet examines job creation in the oil and gas sector in Canada and the United States between 2009 and 2018. It also examines trends at the provincial and state level in the same period.¹
Oil and gas production in the United States surged dramatically between 2009 and 2018, at a growth rate not seen in Canada. The relevance for Canadians is that multiple voices over the same period argued that the weaker Canadian oil and natural gas sectors were due a “tectonic” shift in energy consumption and production and thus in jobs (i.e. away from oil and natural gas).²
Along such lines of thought, such voices argued that Canadians should “transition” away from oil and natural gas extraction, consumption, and exports due to carbon emissions. They were thus opposed to resource development including oil sands mines, natural gas processing plants, and pipelines among other capital-intensive infrastructure.
It is beyond the scope of this Fact Sheet to wade into debates over transition issues, which are connected to technological capabilities. Among other factors, readers may wish to consult the work of University of Manitoba Professor of Environment (Emeritus) Vaclav Smil.³
This Fact Sheet serves to review the trends in oil and gas employment in Canada and the United States during the period (2009 to 2018) when these claims and counter-claims occurred. (The entire fact sheet can be viewed and downloaded here.)
1. The analysis has relevance even in the current economic downturn where both countries face a
slump in demand for oil and natural gas due to the Coronavirus pandemic. A similar downturn
in demand occurred during the 2008-09 recession and oil and gas consumption did return and
rise in subsequent years.
2. As one example, see “Let’s stop Catering to Big Oil” Tzeporah Berman, The Globe and Mail,
August 1, 2012: “If there is an upside to the clash over the Gateway pipeline, it’s that it
has crystallized the choice Canadians face between the risks of doubling down on fossil fuels
and an alternative that might actually have a future but is quickly passing Canada by.”
3. The barriers to transition ordered via government policy was summarily addressed by Smil in
his 2017 book, Energy Transition: Global and National Perspectives. In it, Prof. Smil, who is
concerned about carbon emissions and their effect upon global temperatures, notes the
following: “As in the past, the unfolding global energy transitions will last for decades,
not years, and modern civilization’s dependence on fossil fuels will not be shed by a
sequence of government-dictated goals.”
Oil and gas extraction: 1,610 new Canadian jobs vs. 95,000 new American jobs
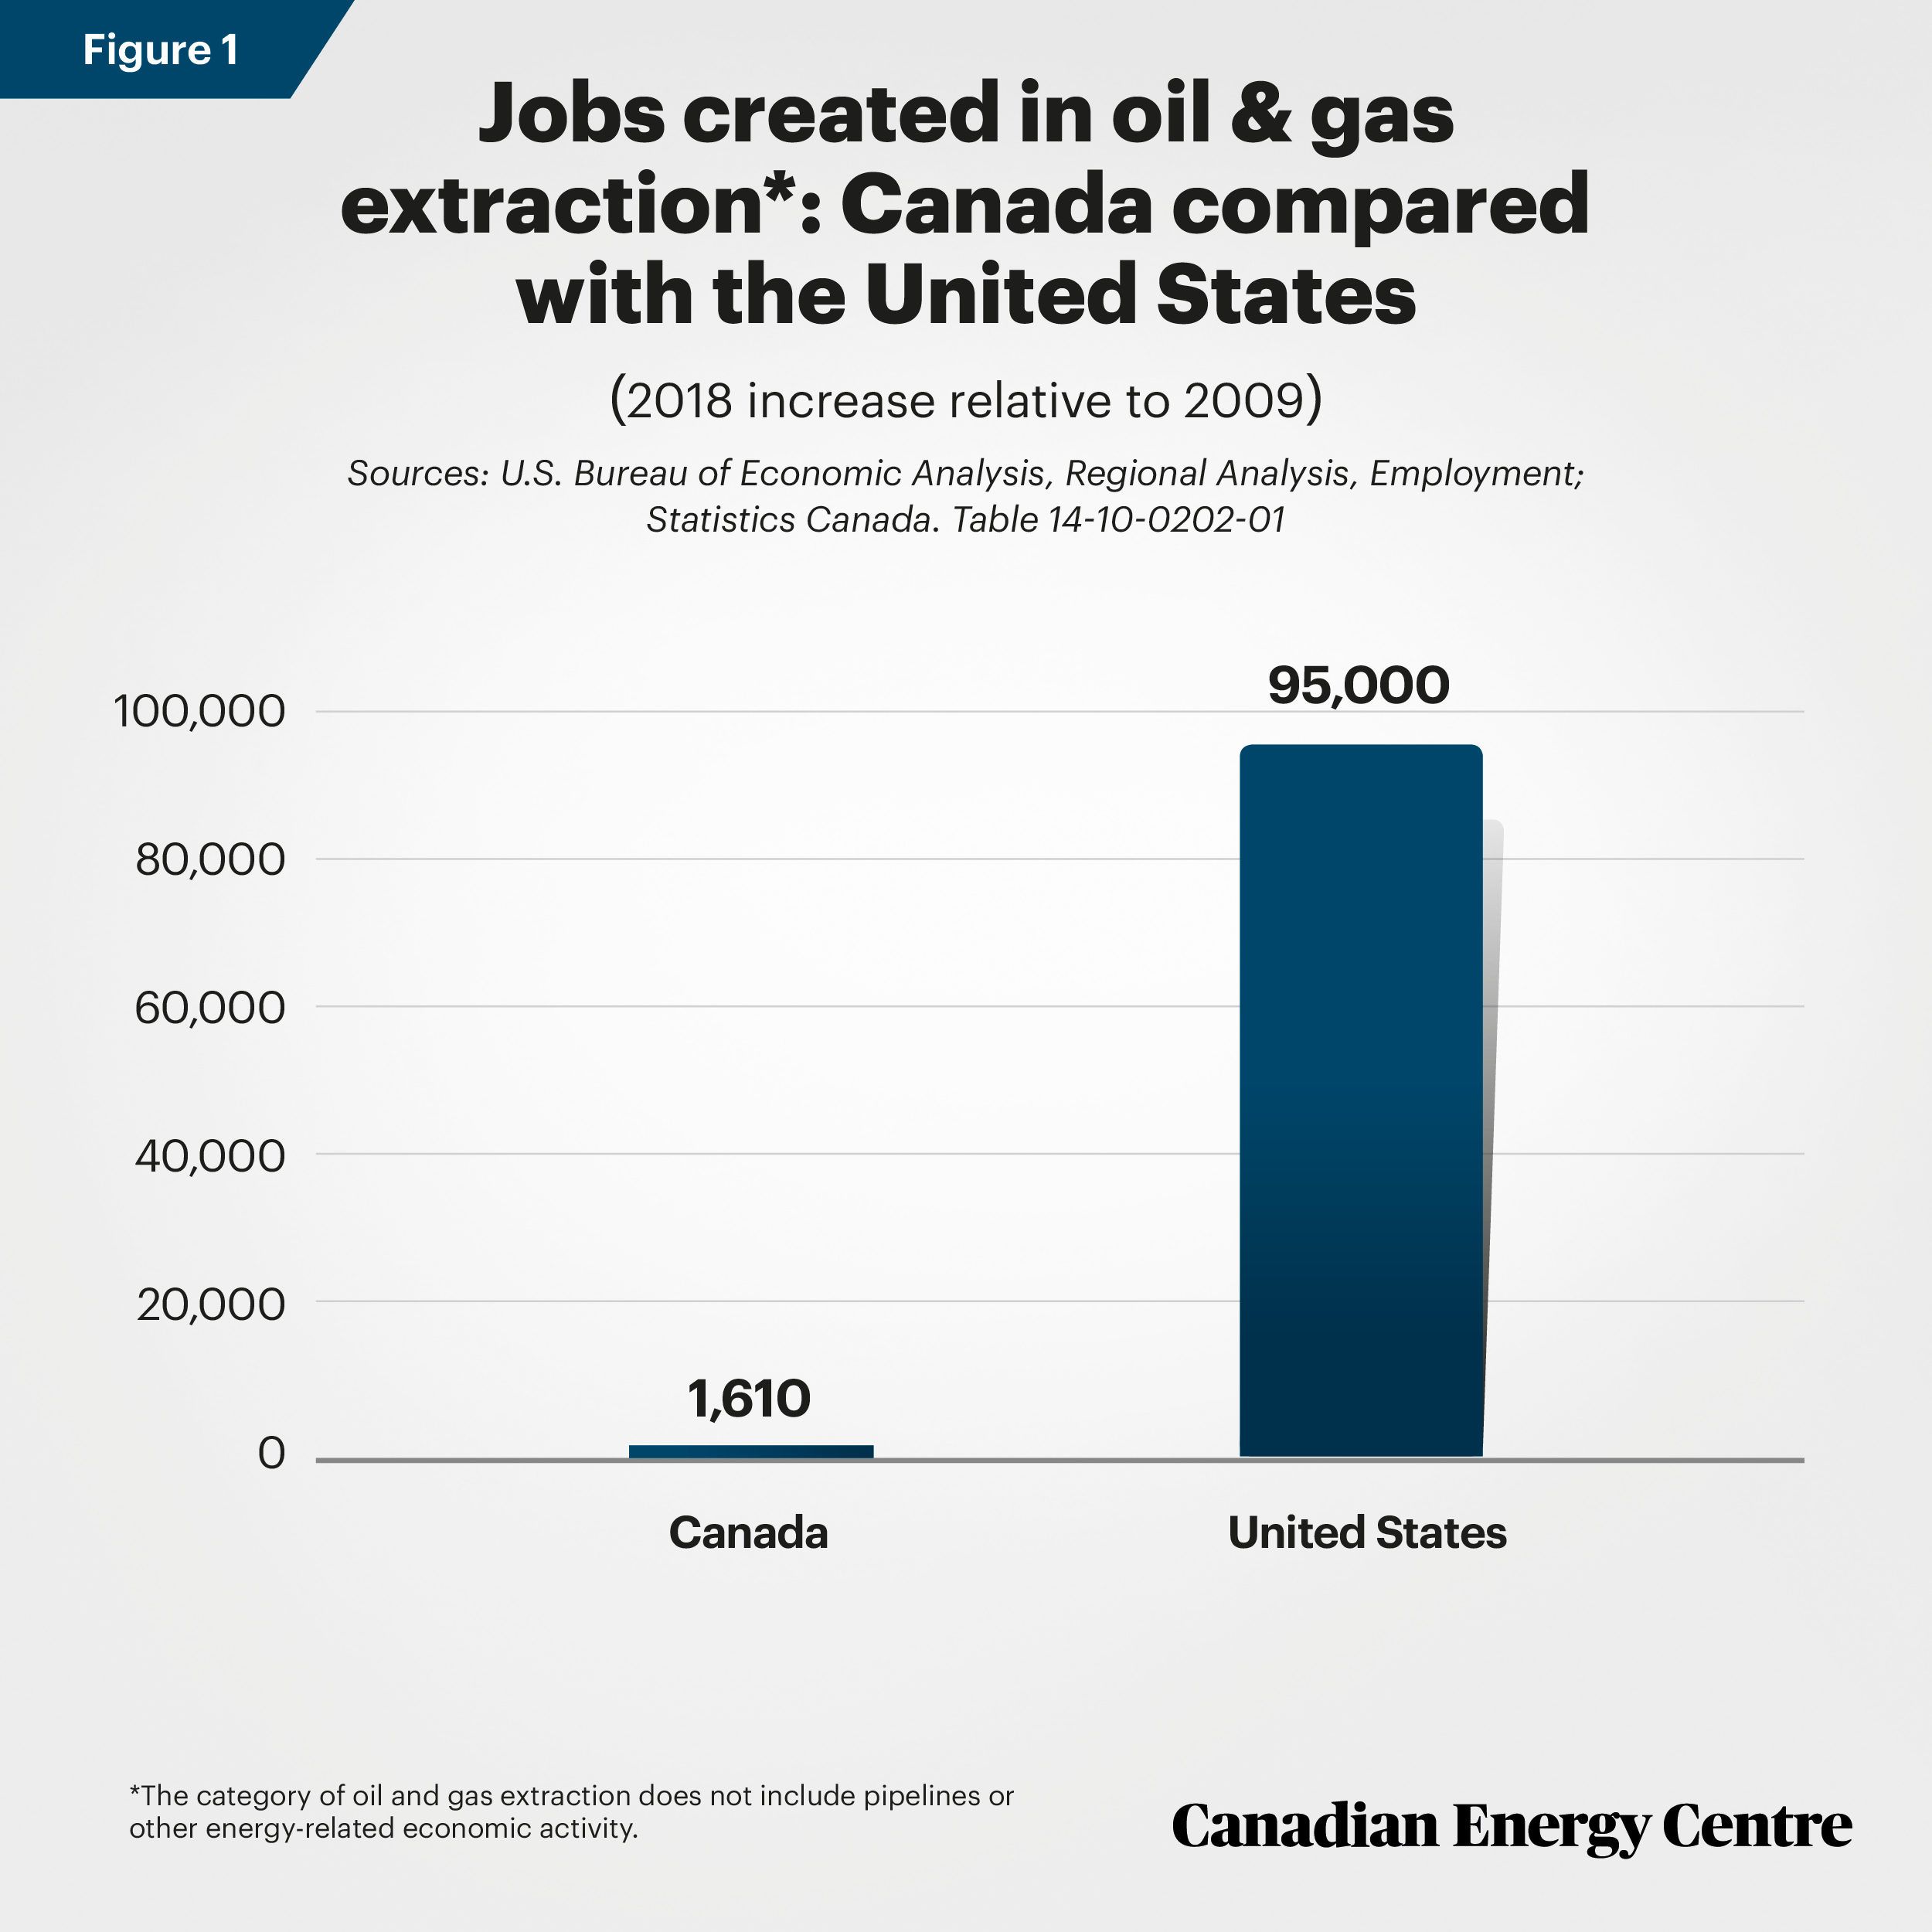
Figure 1 compares employment in the oil and gas sector in Canada and the United States in 2018 compared with 2009, just as both countries emerged from the 2008/09 financial crisis and recession. The results are stark:
- The number of people at work in oil and gas extraction in Canada in 2018 was just 1,610 more than in 2009. That compares with 95,000 new jobs in the oil and natural gas extraction industry in the United States over the same period.
- Expressed as a percentage, employment in Canada’s oil and natural gas extraction sector was 2.9 per cent higher in 2018 relative to 2009 while American employment grew by 16.4 per cent over that decade.

A wider look on employment trends
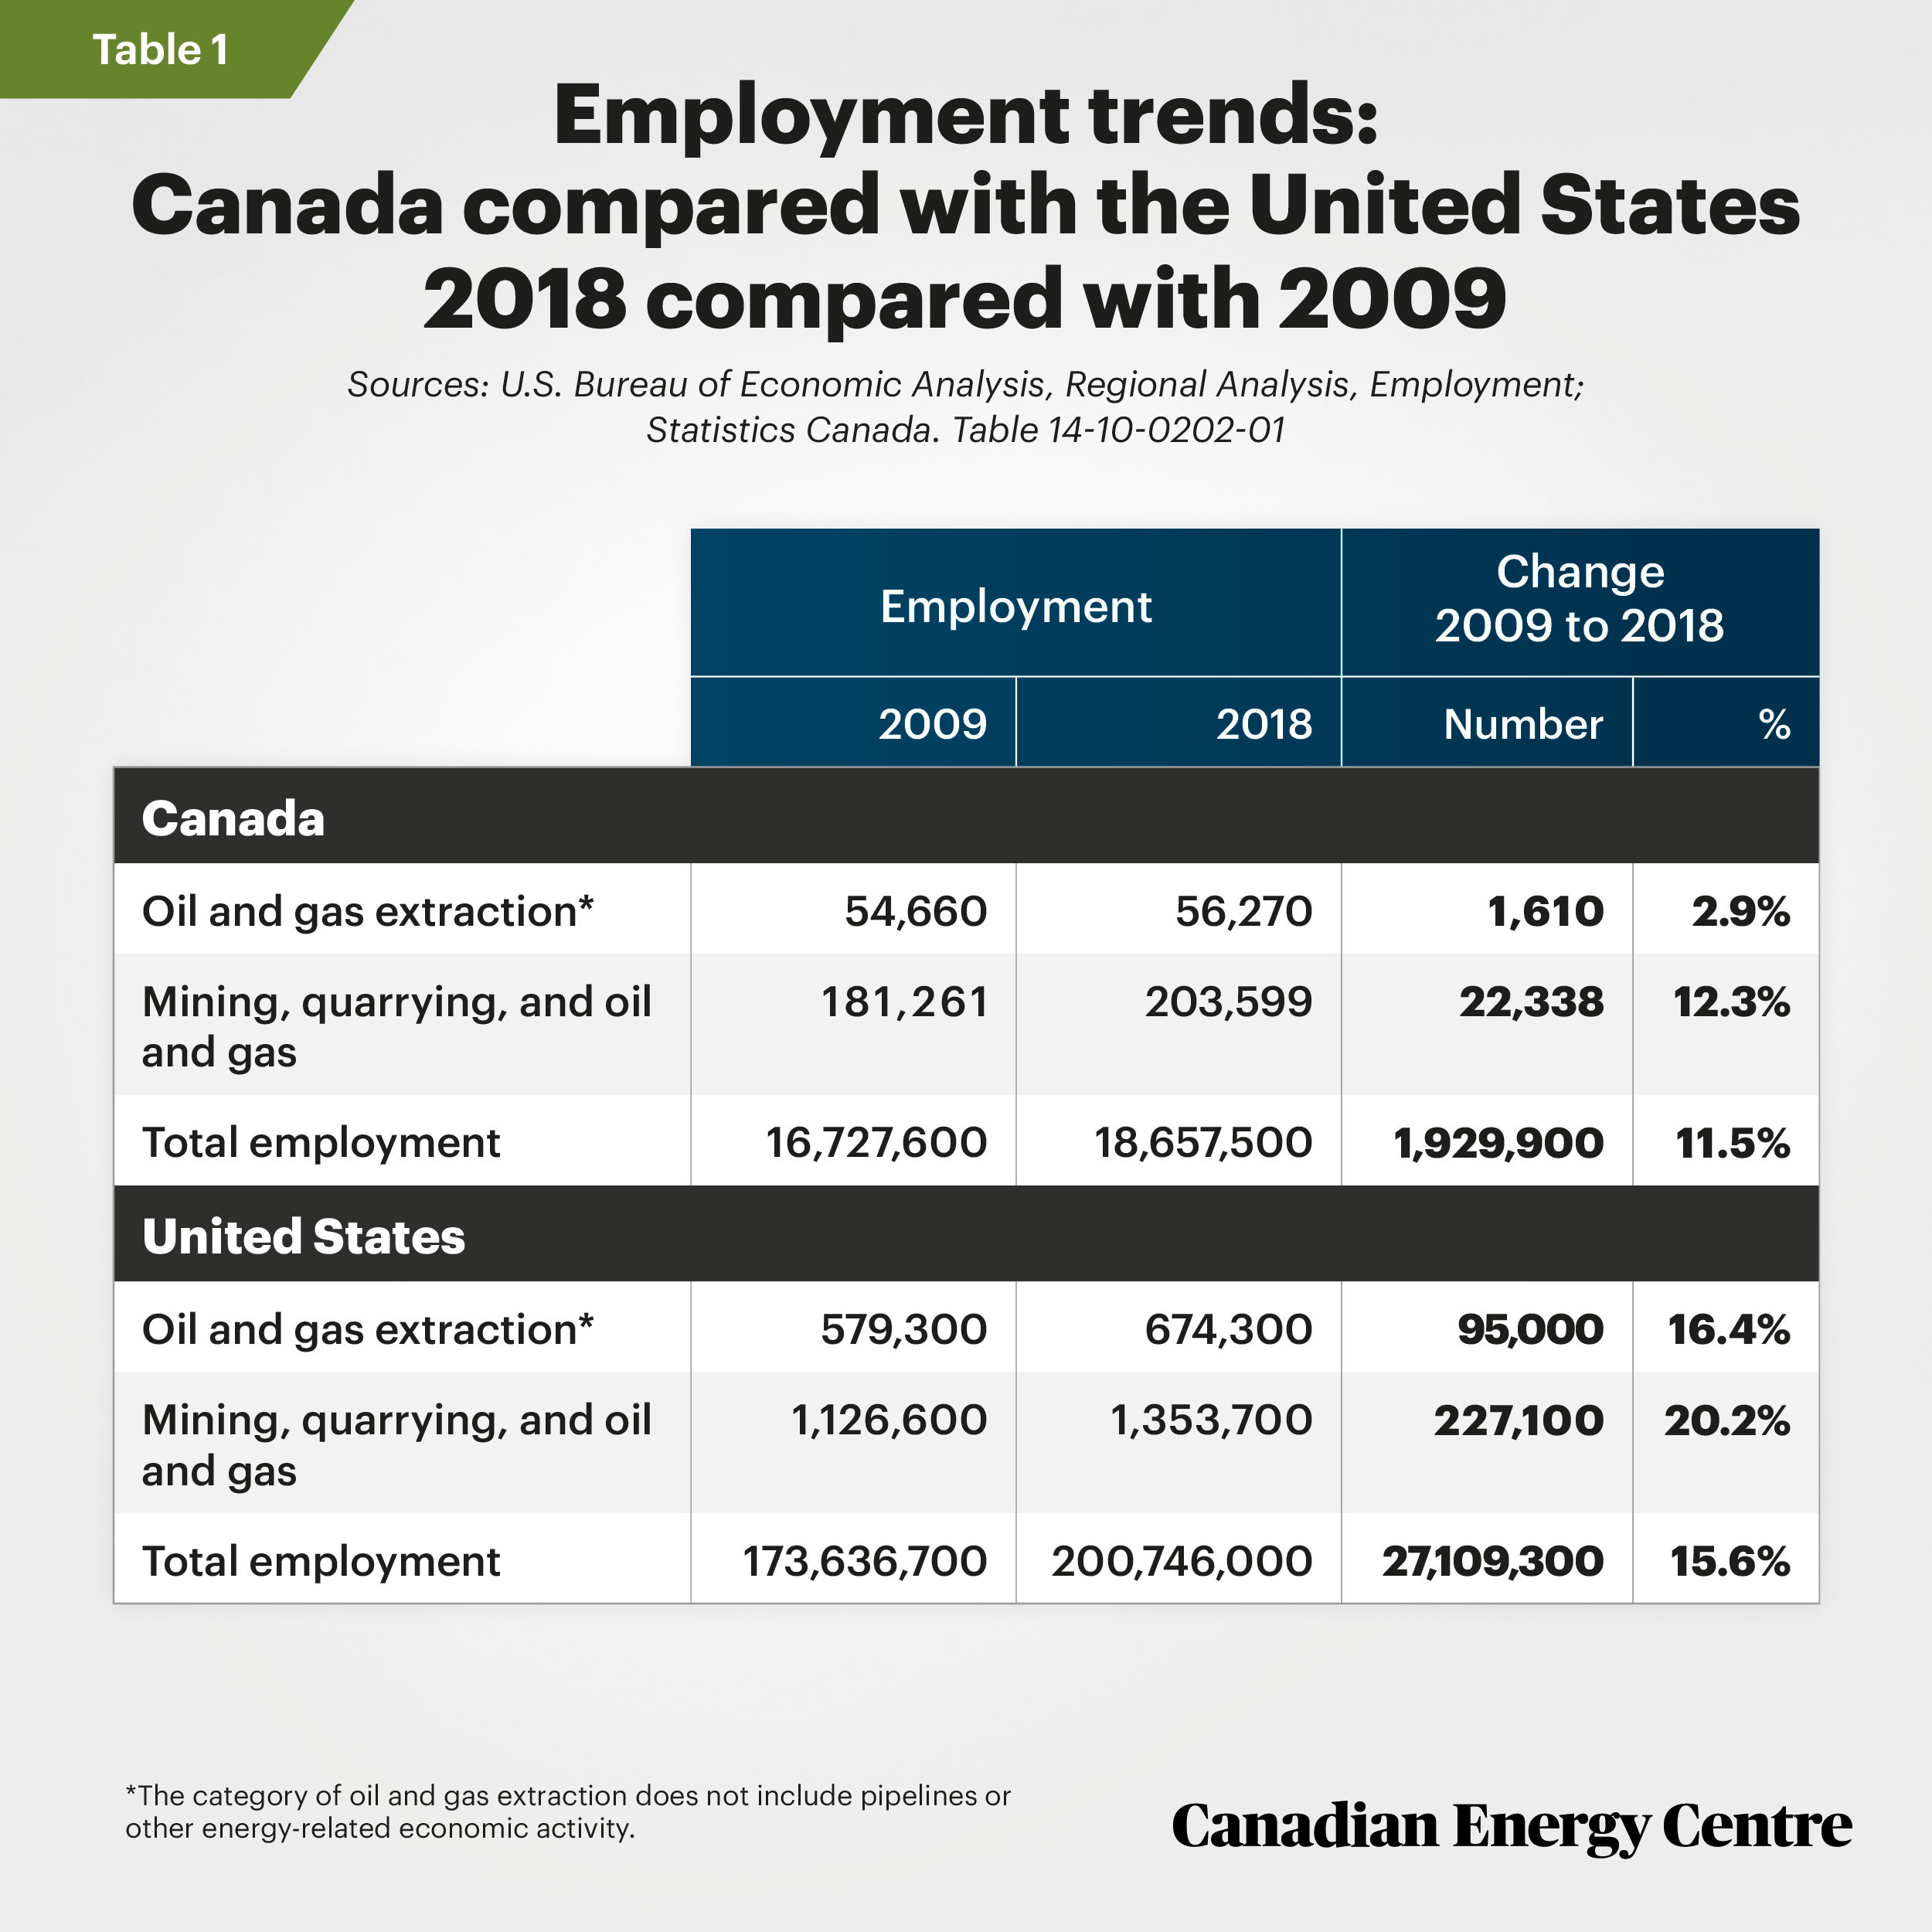
The oil and natural gas extraction industry is only a subset of all oil and gas economic activity and more broadly, energy. Even with an expanded look (Table 1)—mining, quarrying and oil and gas extraction in 2018 versus 2009— employment numbers in Canada rose less than in the United States not only in absolute terms (22,338 and 227,100 respectively)—but also in percentage terms (12.3 per cent in Canada and 20.2 per cent in the United States).
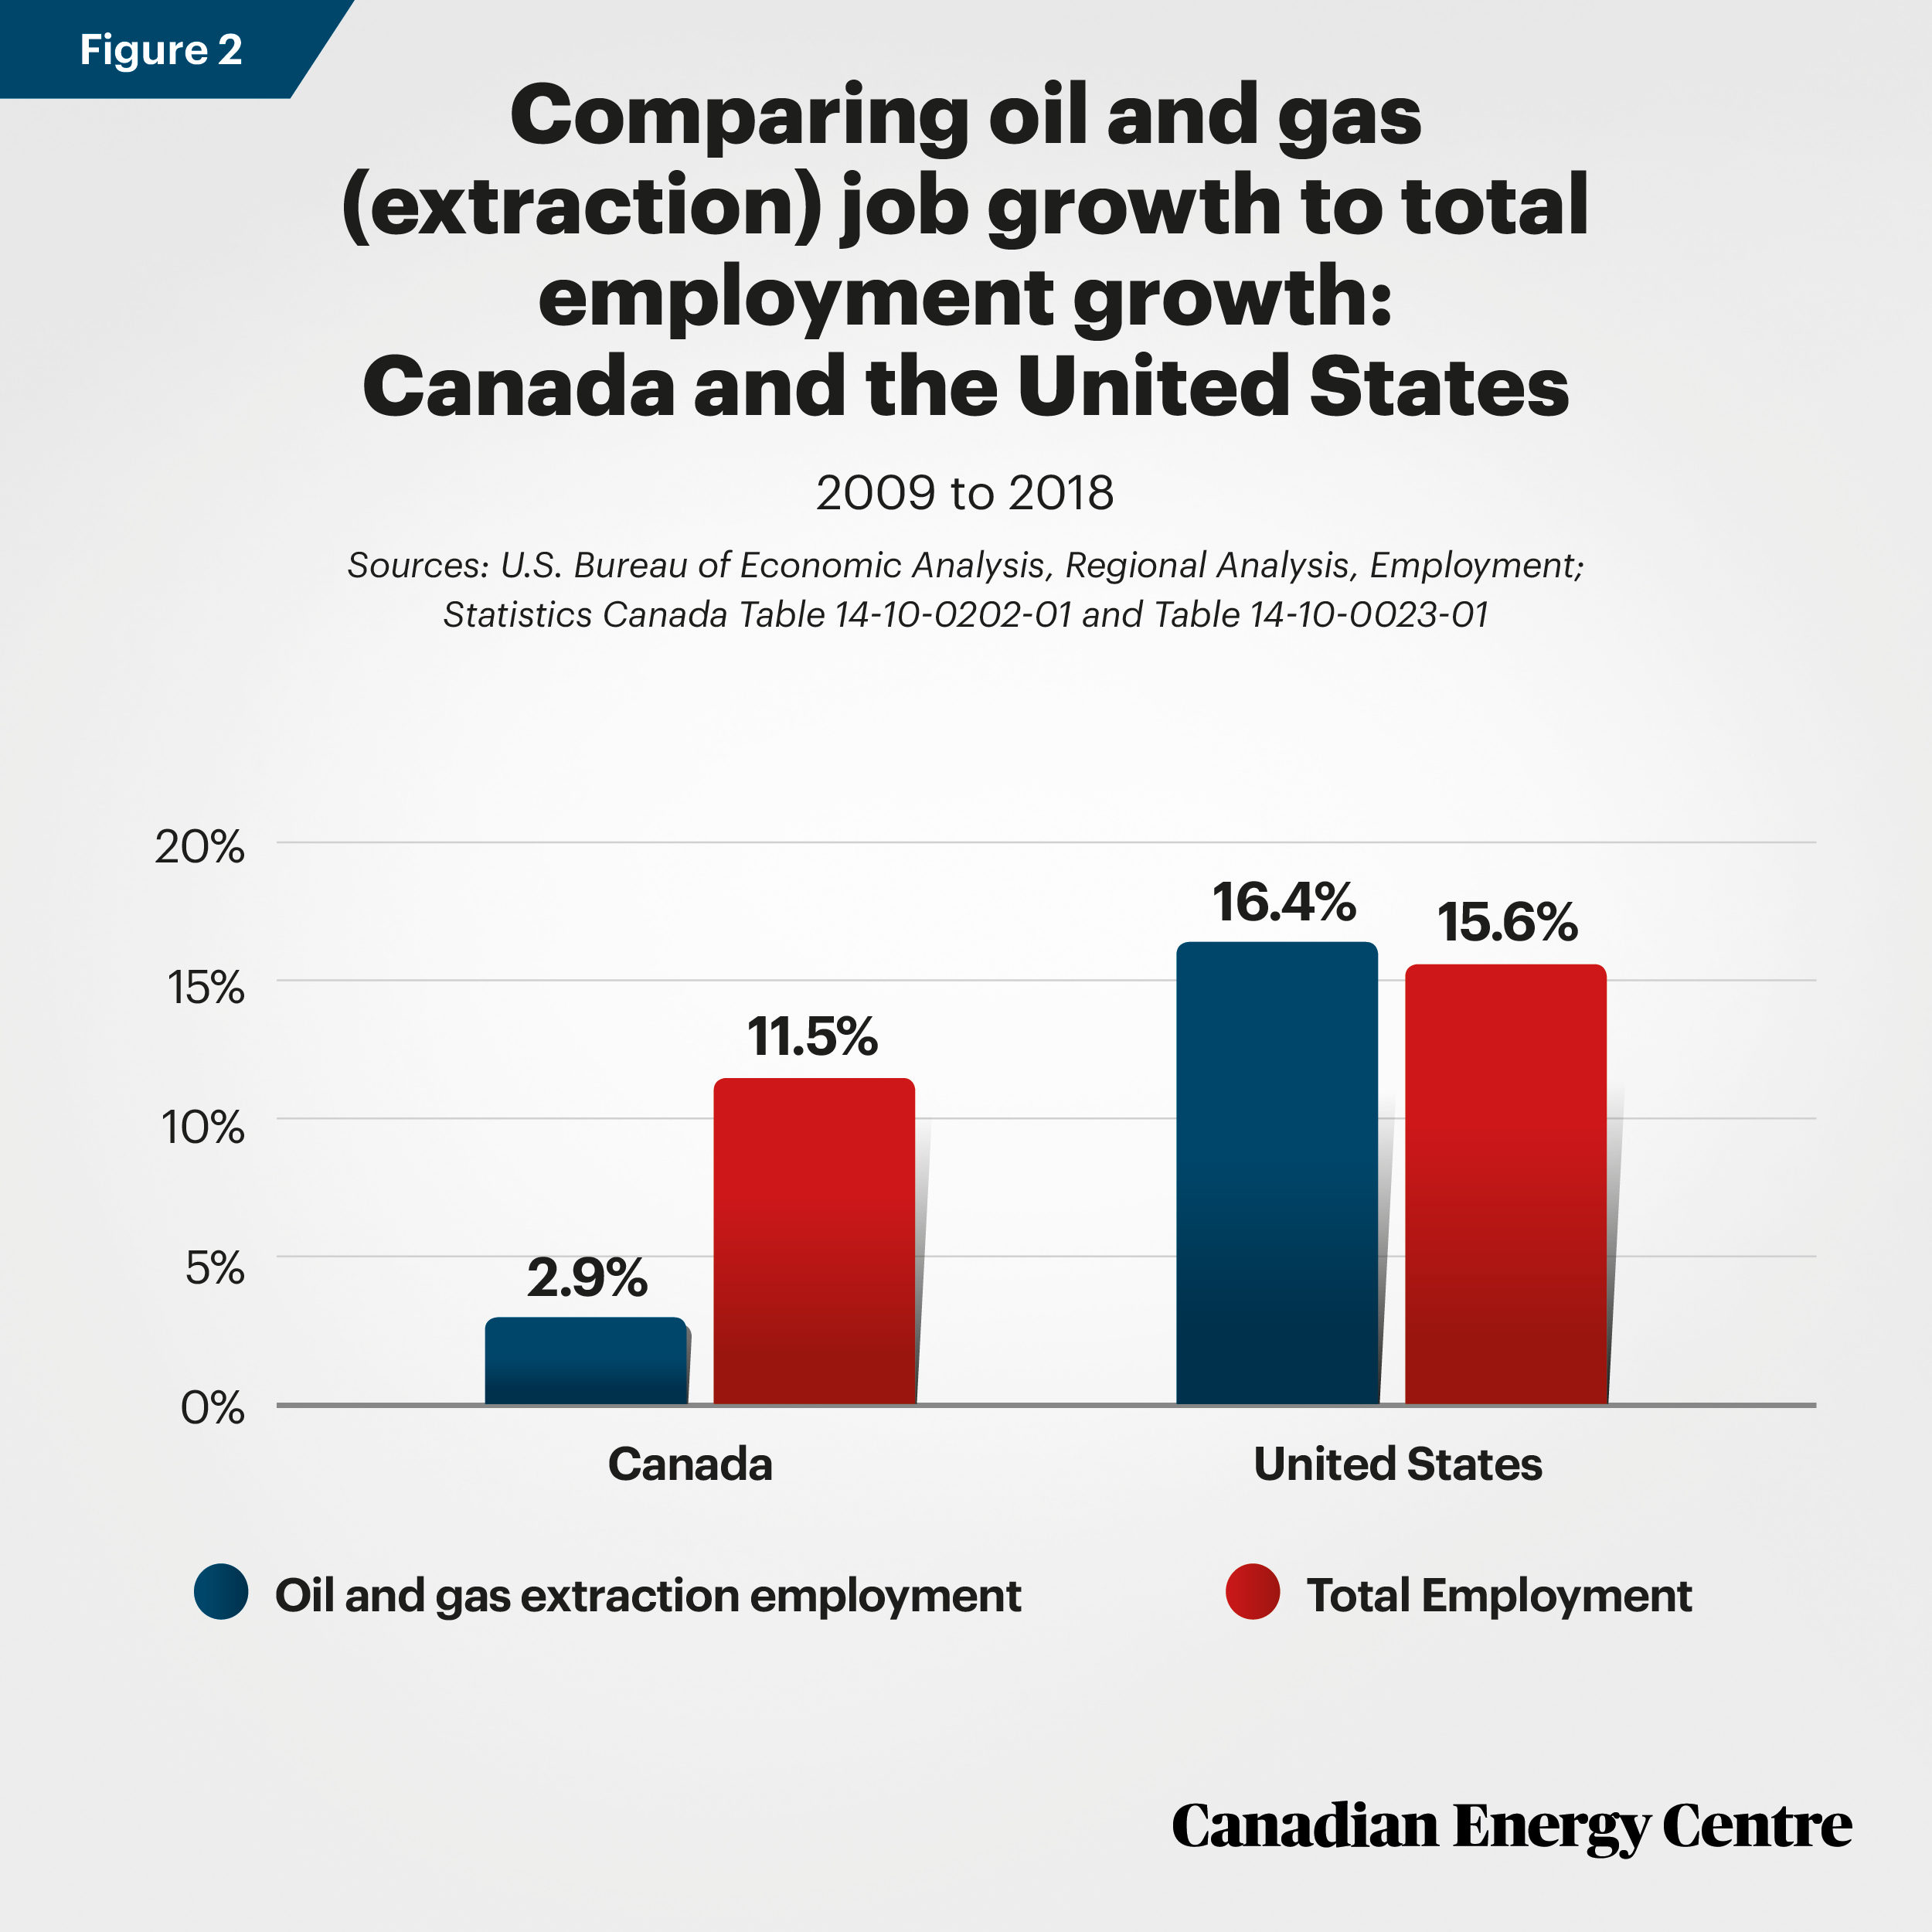
Canada’s overall employment numbers rose by just over 1.9 million between 2009 and 2018, or by 11.5 per cent. Thus, the growth rate in oil and gas extraction jobs at 2.9 per cent was roughly one-quarter overall employment growth in Canada. In the United States, overall employment numbers rose by over 27.1 million between 2009 and 2018, or 15.6 per cent. Thus, the growth in oil and gas extraction jobs at 16.4 per cent in that period was higher than overall employment growth in the United States.

Provincial and state comparisons
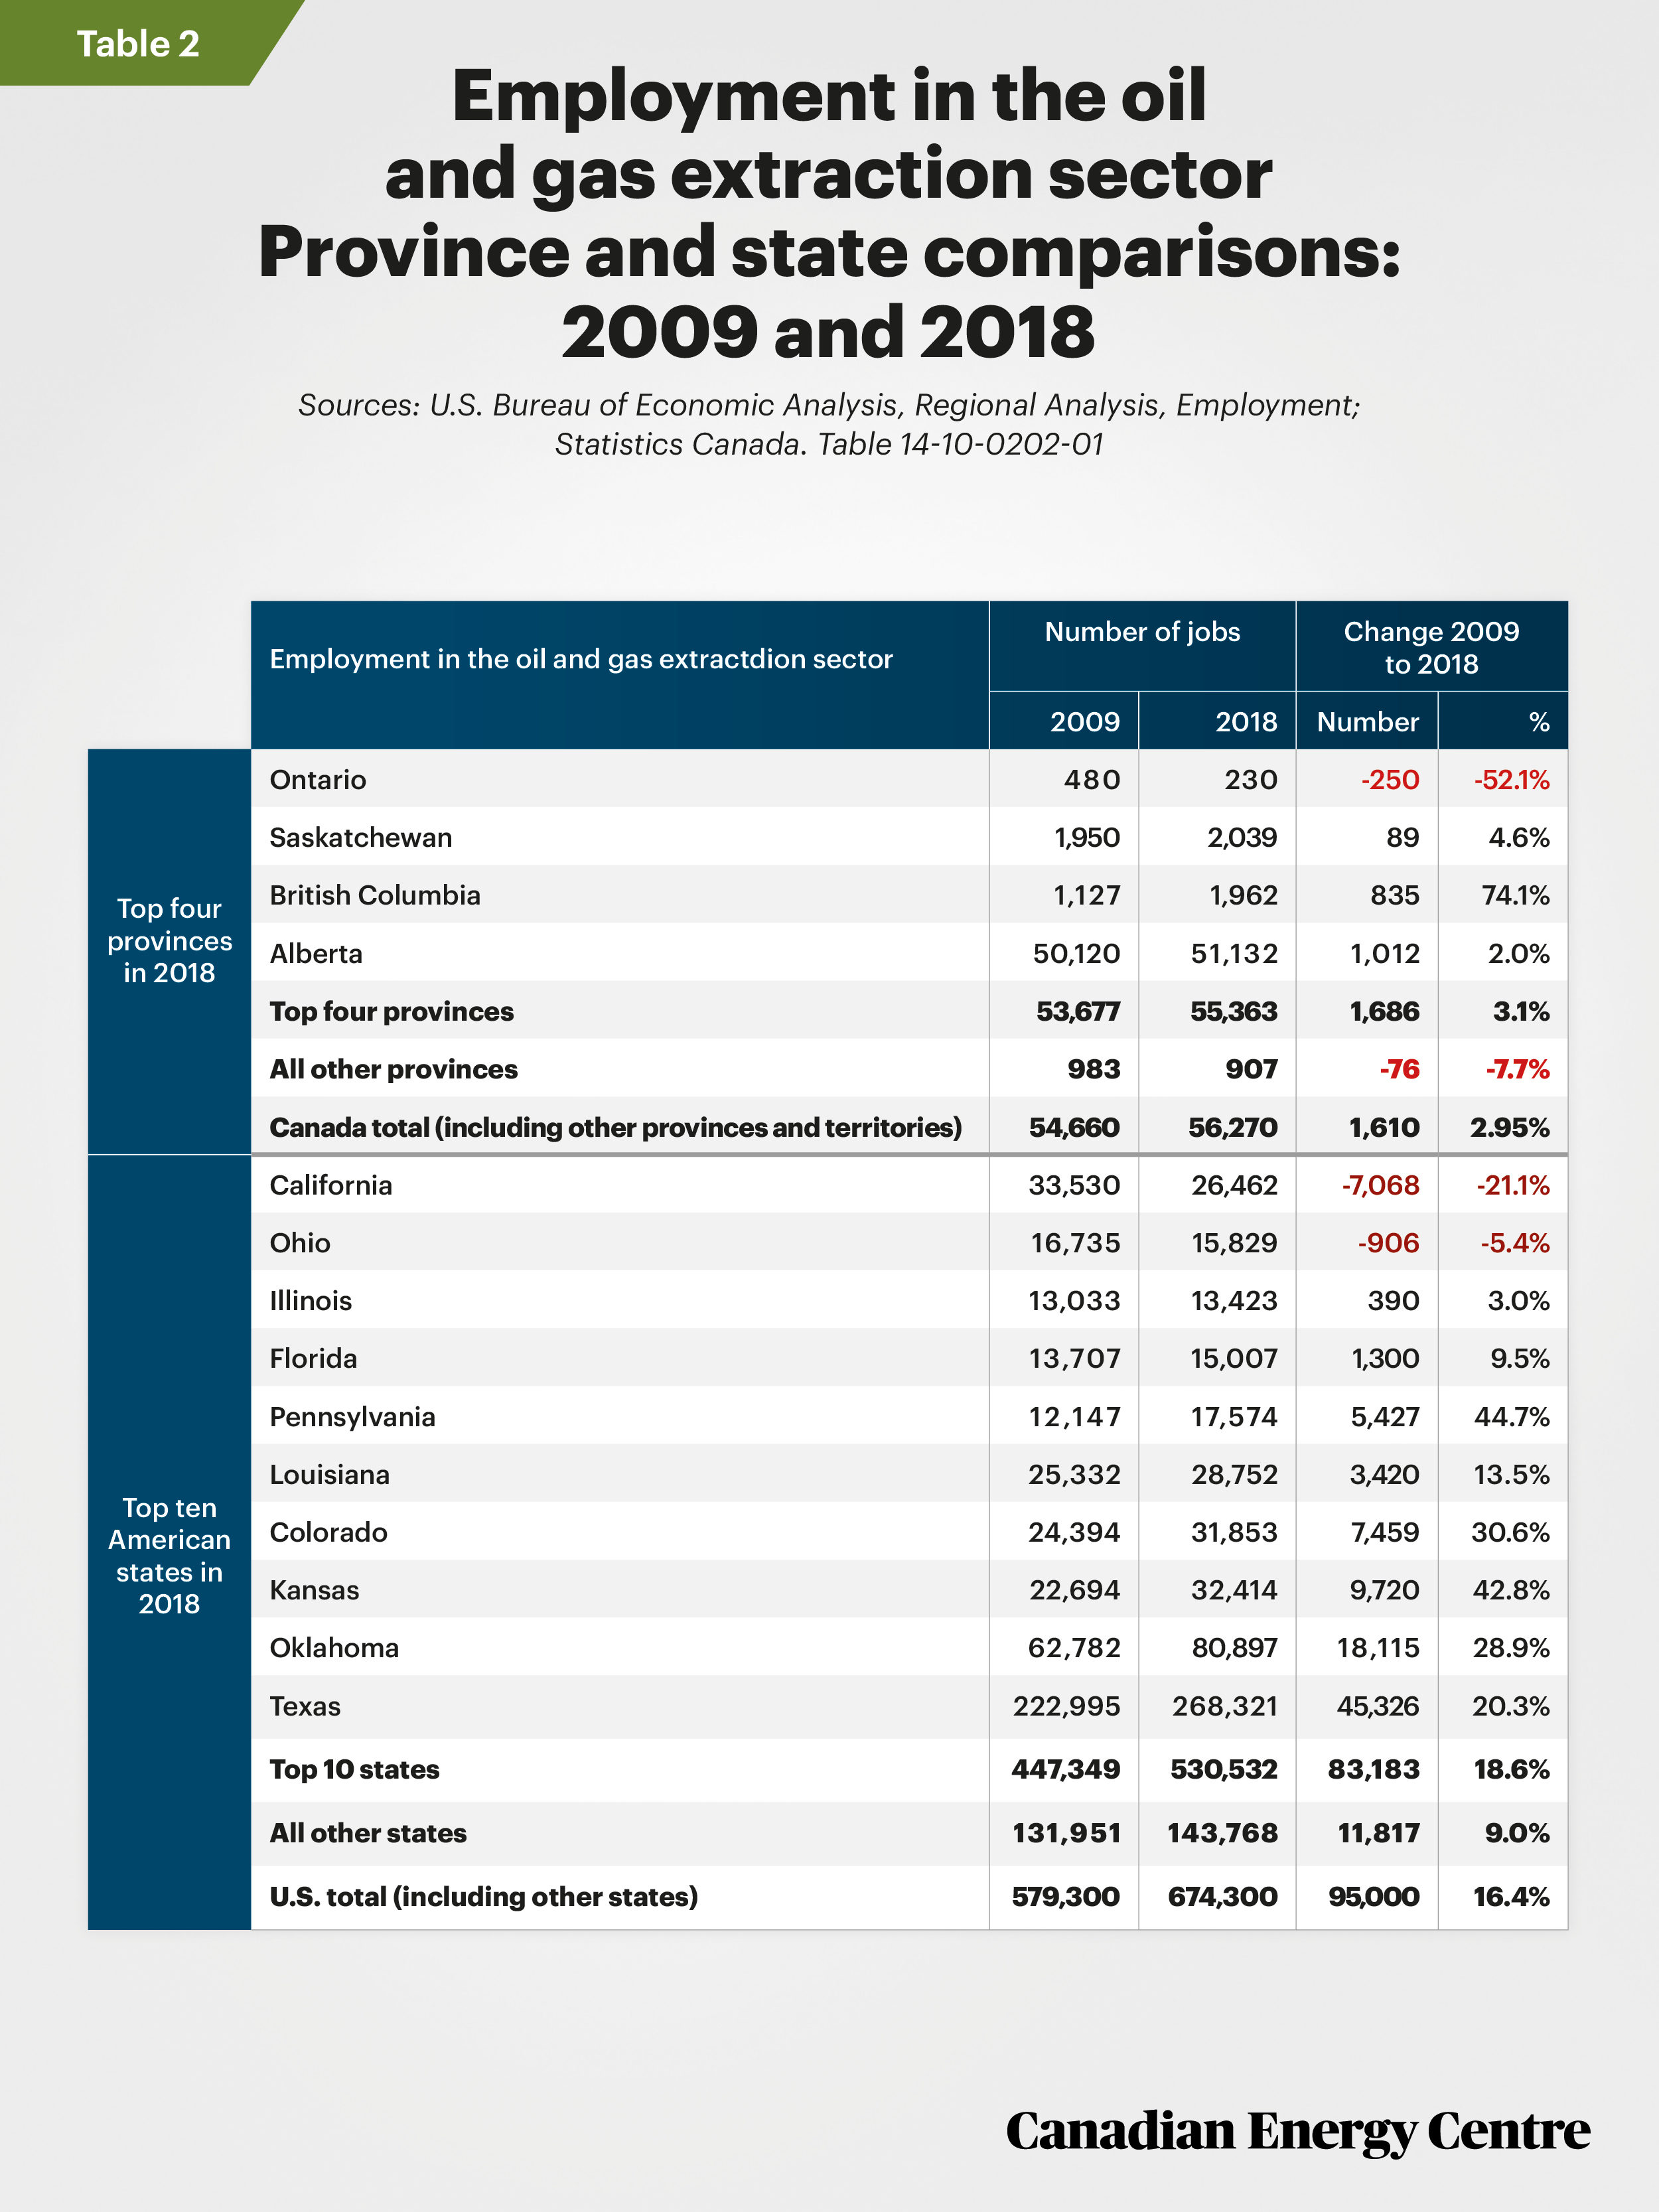
Table 2 compares four Canadian provinces with ten American states on the narrower measurement of employment in the oil and gas extraction sector. Statistics Canada data on employment is available for British Columbia, Alberta, Saskatchewan and Ontario, and nationally, but is not broken out for the remaining six provinces. Data for all 50 American states are available and we highlighted 10 states with the highest number of oil and gas extraction jobs as of 2018.
The highlights from the data reinforce the previously-noted findings on oil and gas extraction employment:
- British Columbia’s employment in the oil and gas sector was higher in 2018 by over 74 per cent, though relative to a small base in 2009. There were an extra 835 jobs in the oil and gas extraction sector in 2018 (1,962 in total) relative to 2009 (1,127)
- Saskatchewan’s employment was up by 89 jobs (less than five per cent higher).
- Alberta’s employment was higher by 1,012 jobs in 2018 when compared with 2009 (two per cent higher).
- Ontario lost 250 oil and gas extraction jobs between 2009 and 2018.
In contrast, American increases in oil and gas extraction jobs were significant, with only a few exceptions:
- Texas and Oklahoma employed 45,326 and 18,115 more Americans in oil and gas extraction in 2018 than they did in 2009, or 20.3 per cent (Texas) and 28.9 per cent (Oklahoma) more respectively.
- The top 10 American states for oil and gas extraction employment (in 2018) collectively employed 83,183 more Americans in 2018 than they did in 2009, or 18.6 per cent more.
- The other 40 states employed 11,817 more Americans in oil and gas extraction in 2018 than they did in 2009, an increase of nine per cent.
- Pennsylvania, with a significant industry that exports natural gas to central Canada and Atlantic Canada, recorded 5,427 more jobs in oil and gas extraction in 2018 (17,574 in total) when compared with 2009 (12,147 jobs in total), an increase of nearly 45 per cent.
- California lost oil and gas extraction jobs over the decade—7,068, or a decrease of 21 per cent of the 33,530 jobs that existed in 2009.

Takeaway: U.S. oil and gas jobs increased more than overall U.S. employment, but in Canada it was the opposite
Over the 2009 to 2018 period, while some in Canada predicted the imminent demise of the oil and gas sector—or worked to achieve that end—95,000 more Americans were working in oil and gas extraction. In contrast, Canadian employment in the oil and gas extraction sector stalled with just 1,610 new jobs added by 2018 when compared with 2009. Oil and gas extraction job growth in Canada was anemic relative to both the American increase (2.9 per cent vs. 16.4 per cent) but also relative to the overall rise in employment in Canada (2.9 per cent vs. 11.5 per cent).
The oil and gas job creation record in the United States demonstrates that the claim of a “tectonic” shift in oil and gas consumption and production and thus in jobs did not occur. It is just that the United States carved out an advantage in the sector including in employment creation while Canada’s oil and gas sector and employment mostly stalled.

Notes
This CEC Fact Sheet was compiled by Mark Milke and Lennie Kaplan at the Canadian Energy Centre: www.canadianenergycentre.ca. The authors and the Canadian Energy Centre would like to thank and acknowledge the assistance of Mr. Philip Cross, and an anonymous reviewer for their review of the data and research for this Fact Sheet. Image credits: ‘Canada & US Flag’ by Chapay, ‘Workers on an oil rig’ by Jake Wyman.
Sources (Links live as of April 2, 2020)
Vaclav Smil (2017). Energy Transition: Global and National Perspectives. Praeger, xi; Sources: U S. Bureau of Economic Analysis, Regional Analysis, Employment. <https://bit.ly/2UXNMKL> and <https://bit.ly/2X6awLw> ; Statistics Canada. Table 14-10-0202-01. <https://bit.ly/346ejto> Table 14-10-0023-01 <https://bit.ly/2RAFo2T>.
Creative Commons Copyright
Research and data from the Canadian Energy Centre (CEC) is available for public usage under creative commons copyright terms with attribution to the CEC. Attribution and specific restrictions on usage including non-commercial use only and no changes to material should follow guidelines enunciated by Creative Commons here: Attribution-NonCommercial-NoDerivs CC BY-NC-ND.
