
Social
To sign up to receive the latest Canadian Energy Centre research to your inbox email: research@canadianenergycentre.ca
Download the PDF here
Download the charts here
Overview
The broad oil and gas sector¹ has been and continues to be a significant contributor to Canada’s economy. Compared to the narrower oil and gas extraction sector, which comprised about 3.1 per cent of GDP in 2017, the broad oil and gas sector includes both the direct and indirect impacts of oil and gas extraction and oil and gas investment on the economy.
The impact of the broad oil and gas sector on GDP, jobs, and output (the production of goods and services) on key sectors of the Canadian economy is not well known outside that sector or outside regions and provinces where such resource activity occurs but is relevant to current discussions about the sector’s importance to Canada’s future.
In this Fact Sheet, we examine the impact that the broad oil and gas sector had on the Canadian economy in 2017. We chose the year 2017 due to the availability of Statistics Canada Supply and Use data. The Supply and Use tables provide a detailed accounting of the Canadian economy and give information by industry, products, provinces, sectors, and components of final use.
The analysis presented here includes not only the oil and gas sector’s direct impact on the overall Canadian economy in nominal GDP, jobs, and output, but also the indirect impact that such activities have on other key Canadian industries.
As the data show, despite the severe decline in oil and natural gas prices between 2014 and 2017 and the resulting decline in economic activity, at 6.4 per cent in 2017, the oil and gas sector’s direct and indirect share of Canada’s GDP still produced the following effects on Canada’s economy.
1. See “Definitions” at the end of this Fact Sheet for what is included in this sectoral measurement.
Top line impacts
The Canadian oil and gas sector has both direct and indirect impacts on the national and provincial economies, including on GDP, jobs, and output generated in other key industries.
GDP and output
In 2017, the GDP associated with Canada’s oil and gas sector totaled $128 billion, or 6.4 per cent of the total Canadian economy.
In 2017, the output, or value of goods and services produced by the Canadian oil and gas sector and its supply chain, was $241 billion, representing about 6.4 per cent of Canada’s total output, (see Table 1).
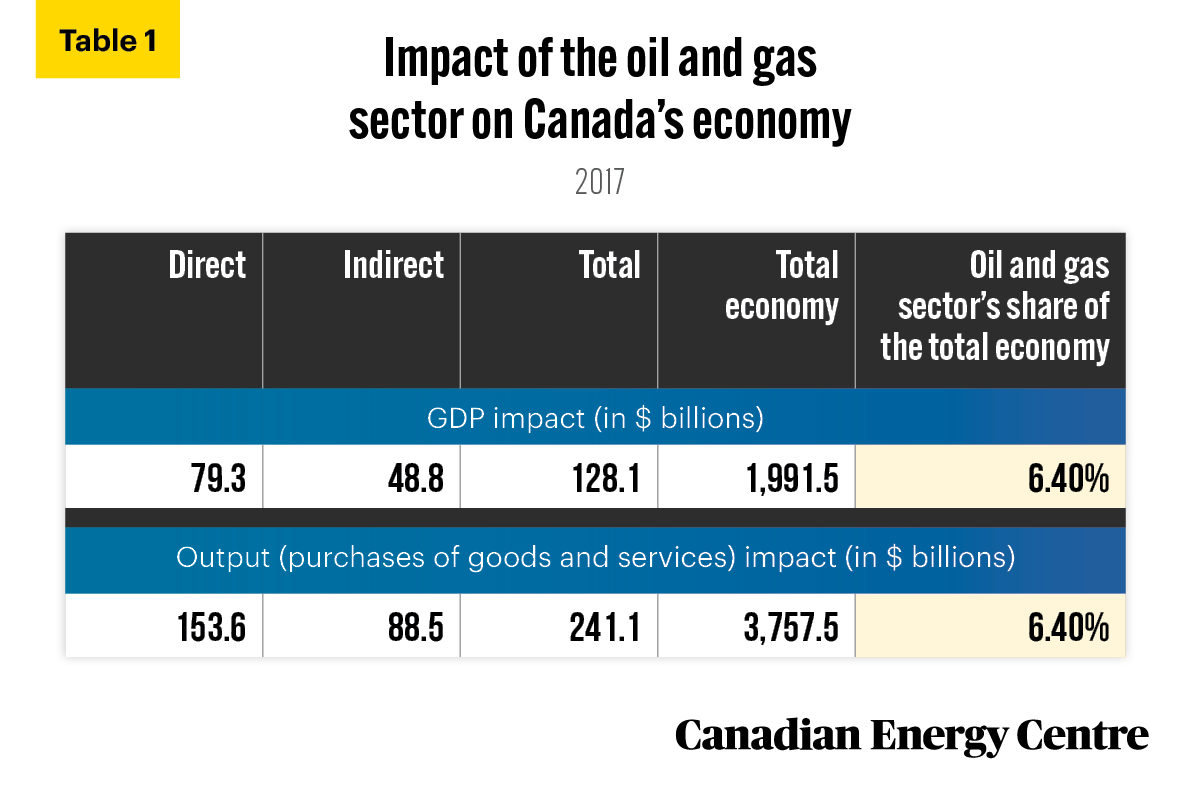
Source: Derived from Statistics Canada, Custom Tabulation of the Supply and Use Tables, 2017
Jobs
In 2017, there was a total of 611,362 jobs associated with the Canadian oil and gas sector – 216,285 direct and 395,077 indirect – representing about 3.2 per cent of all jobs across Canada (see Table 2).
In 2017, the total compensation paid to oil and gas extraction sector workers alone was over $13.3 billion (Statistics Canada, 2021f).
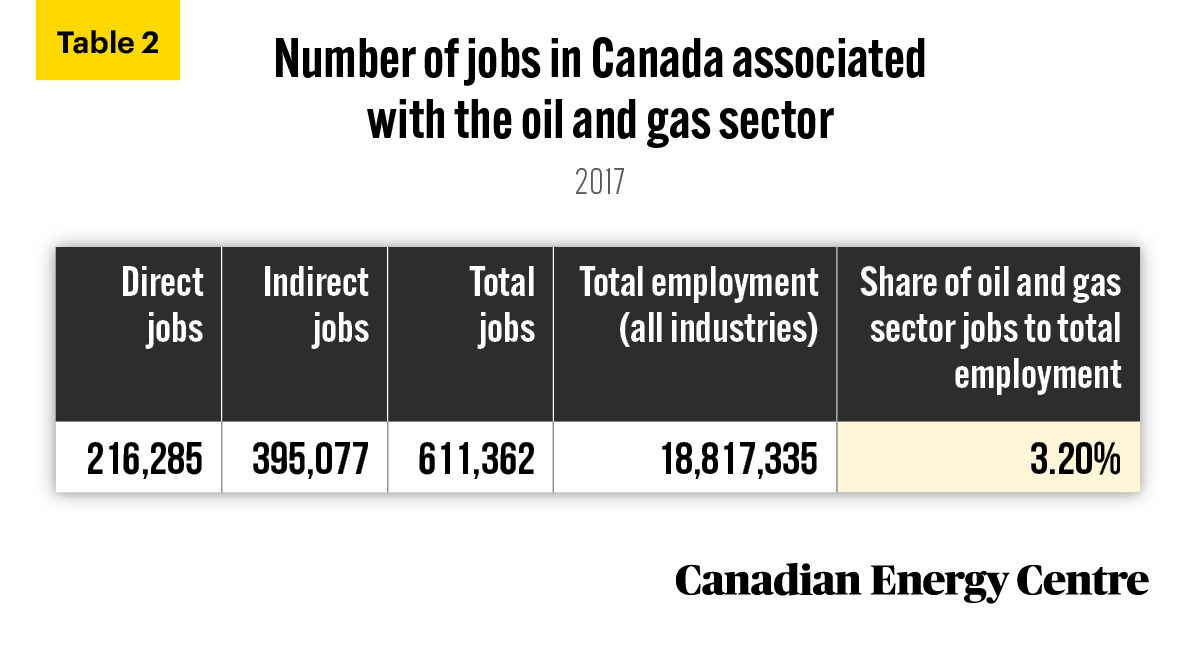
Source: Derived from Statistics Canada, Custom Tabulation of the Supply and Use Tables, 2017.
A detailed breakdown: The oil and gas sector’s impact on key sectors of the Canadian economy
GDP
The activities of the Canadian oil and gas sector are responsible for significant portions of GDP in key industries across Canada. They range from approximately $370 million in GDP in Statistics Canada’s North American Industry Classification System (NAICS) sector categorized as office administrative services, or 4.1 per cent of that sector’s GDP, to nearly $3.2 billion, or 11.4 per cent of GDP for machinery, equipment, and supplies merchant wholesalers (see Table 3).
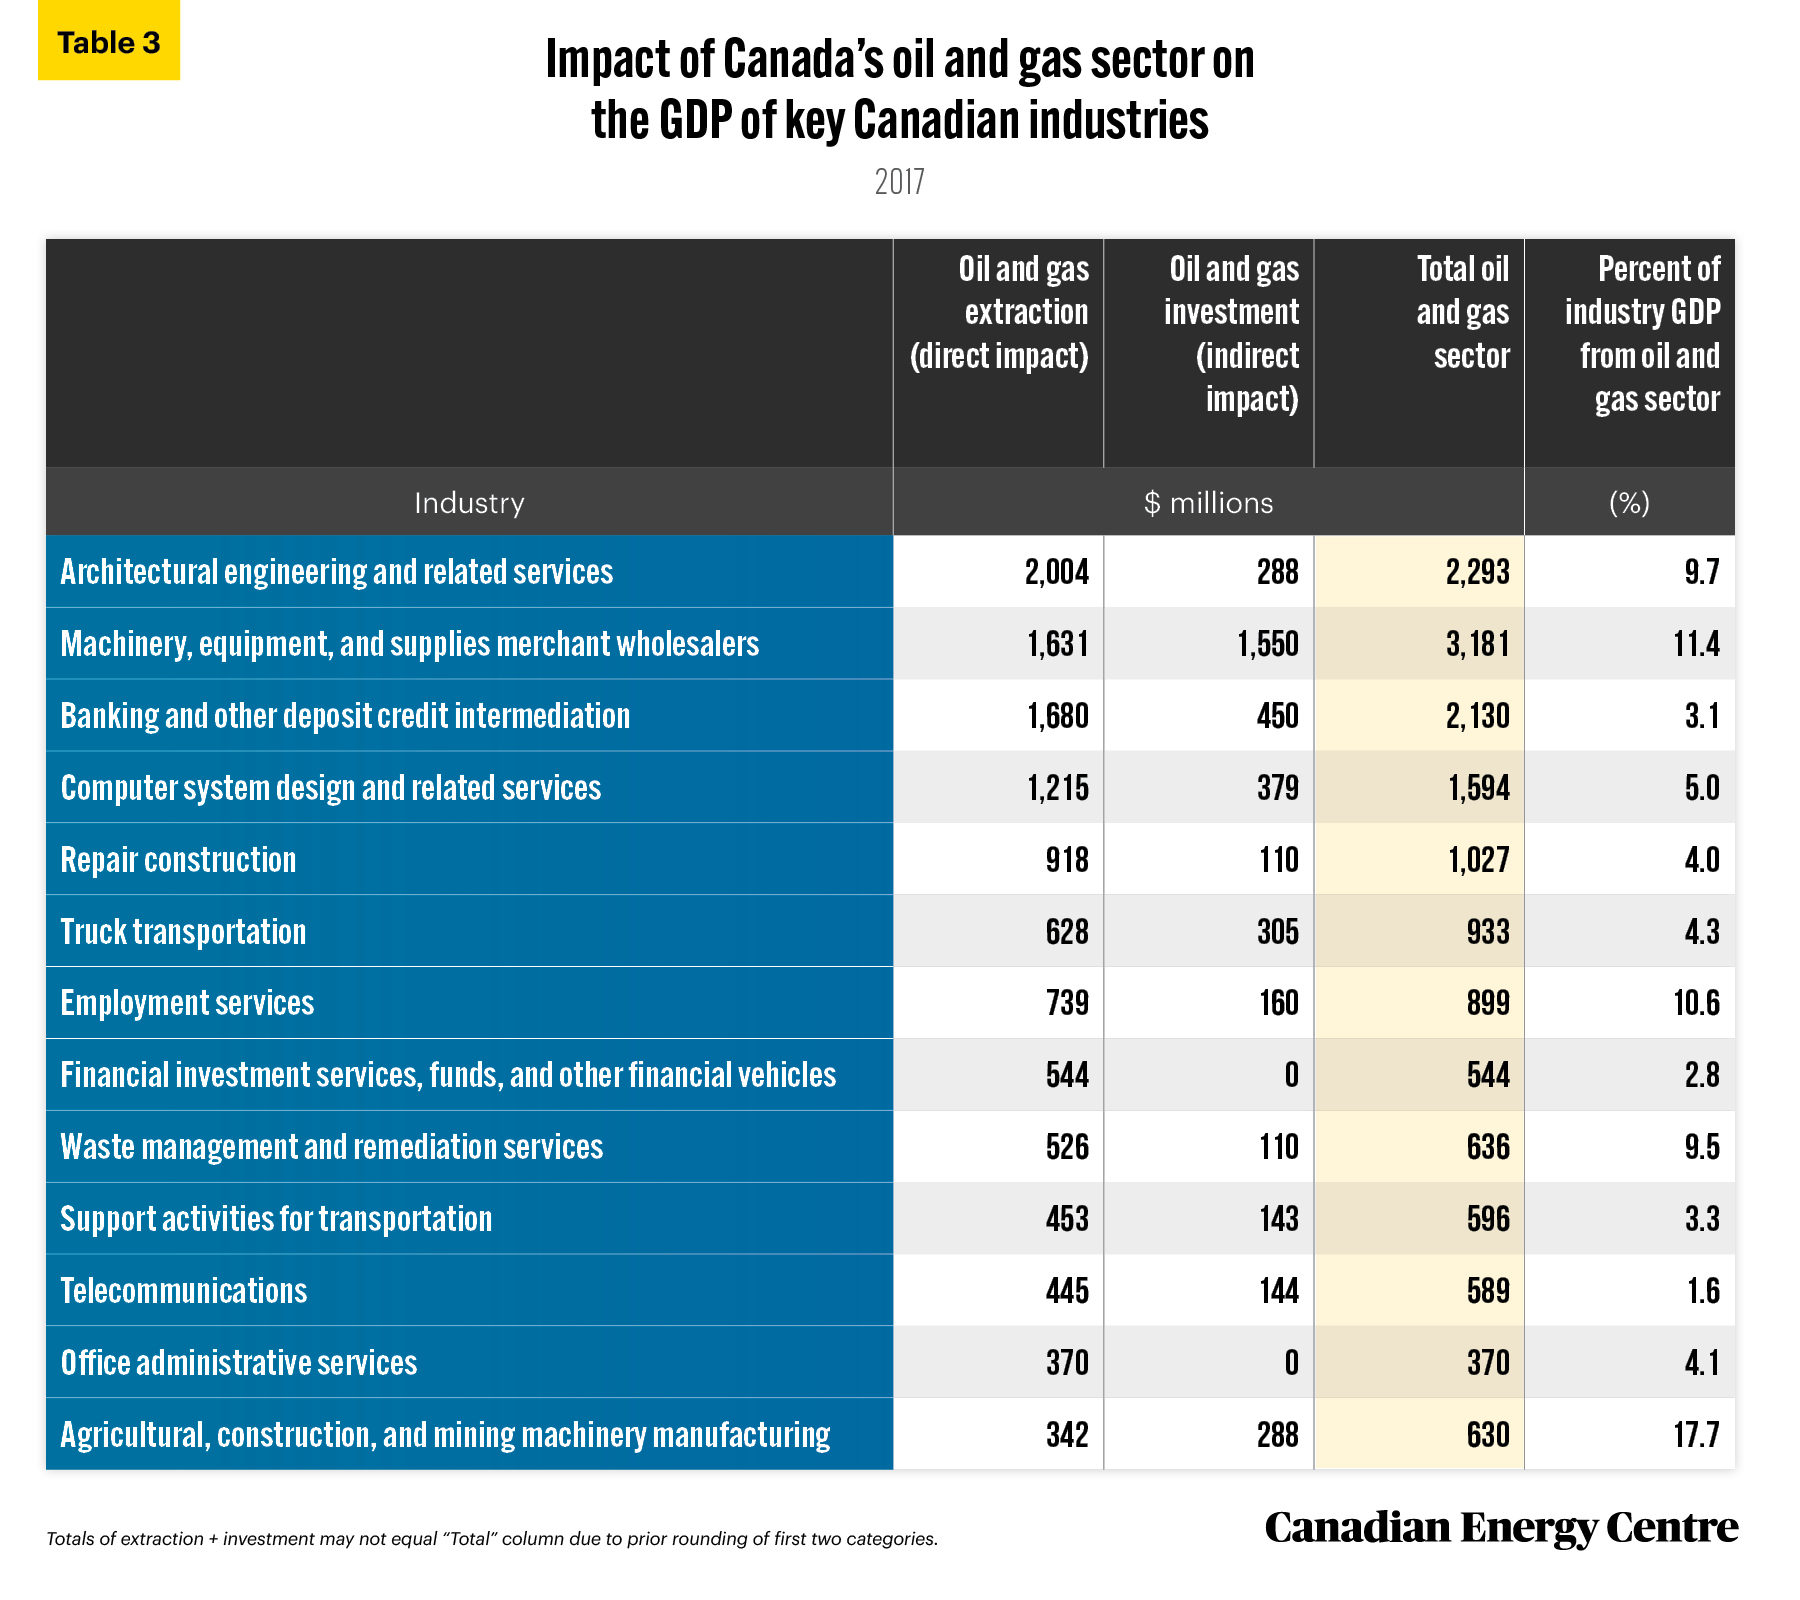
Source: Derived from Statistics Canada Custom Tabulation of the Supply and Use Tables, 2017.
Output (value of goods and services produced)
The oil and gas industry and its supply chain purchased nearly $139 million worth of goods and services from Canada’s NAICS general merchandise stores sector, or 0.8 per cent of that sector’s total output. Oil and gas producers and suppliers also purchased over $7.1 billion of goods and services from the architectural engineering and related services sector in Canada, or 19 per cent of that industry’s total output (see Table 4).
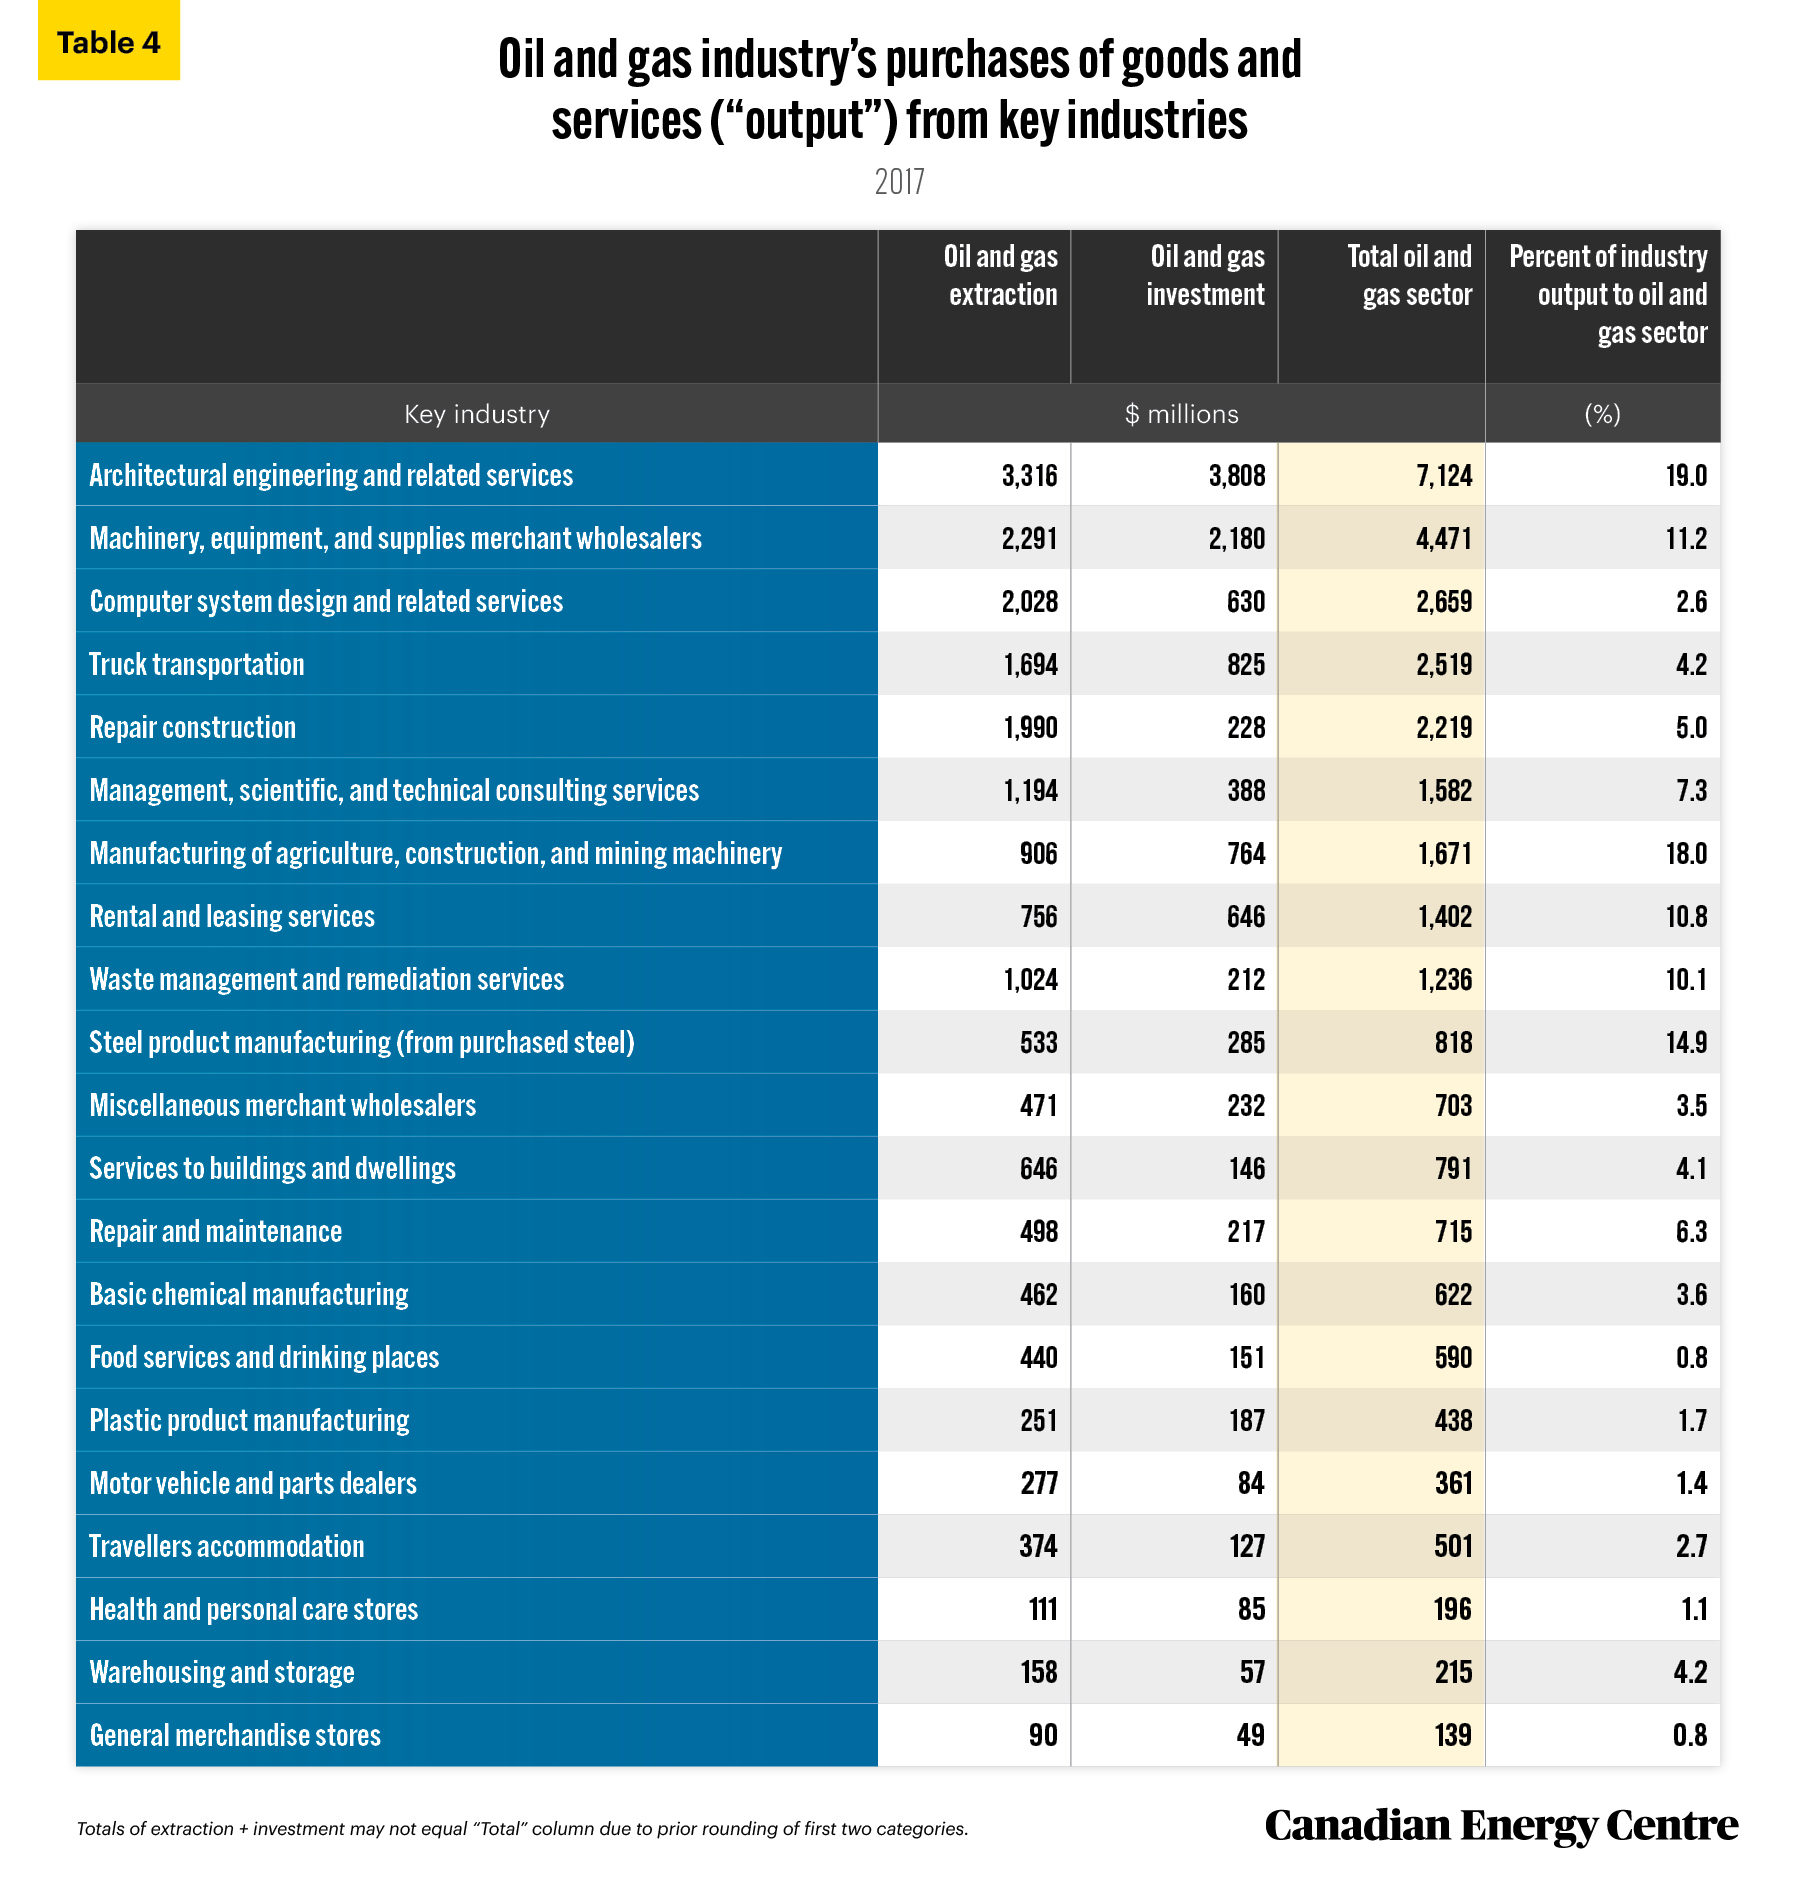
Source: Derived from Statistics Canada Custom Tabulation of the Supply and Use Tables, 2017.
Jobs
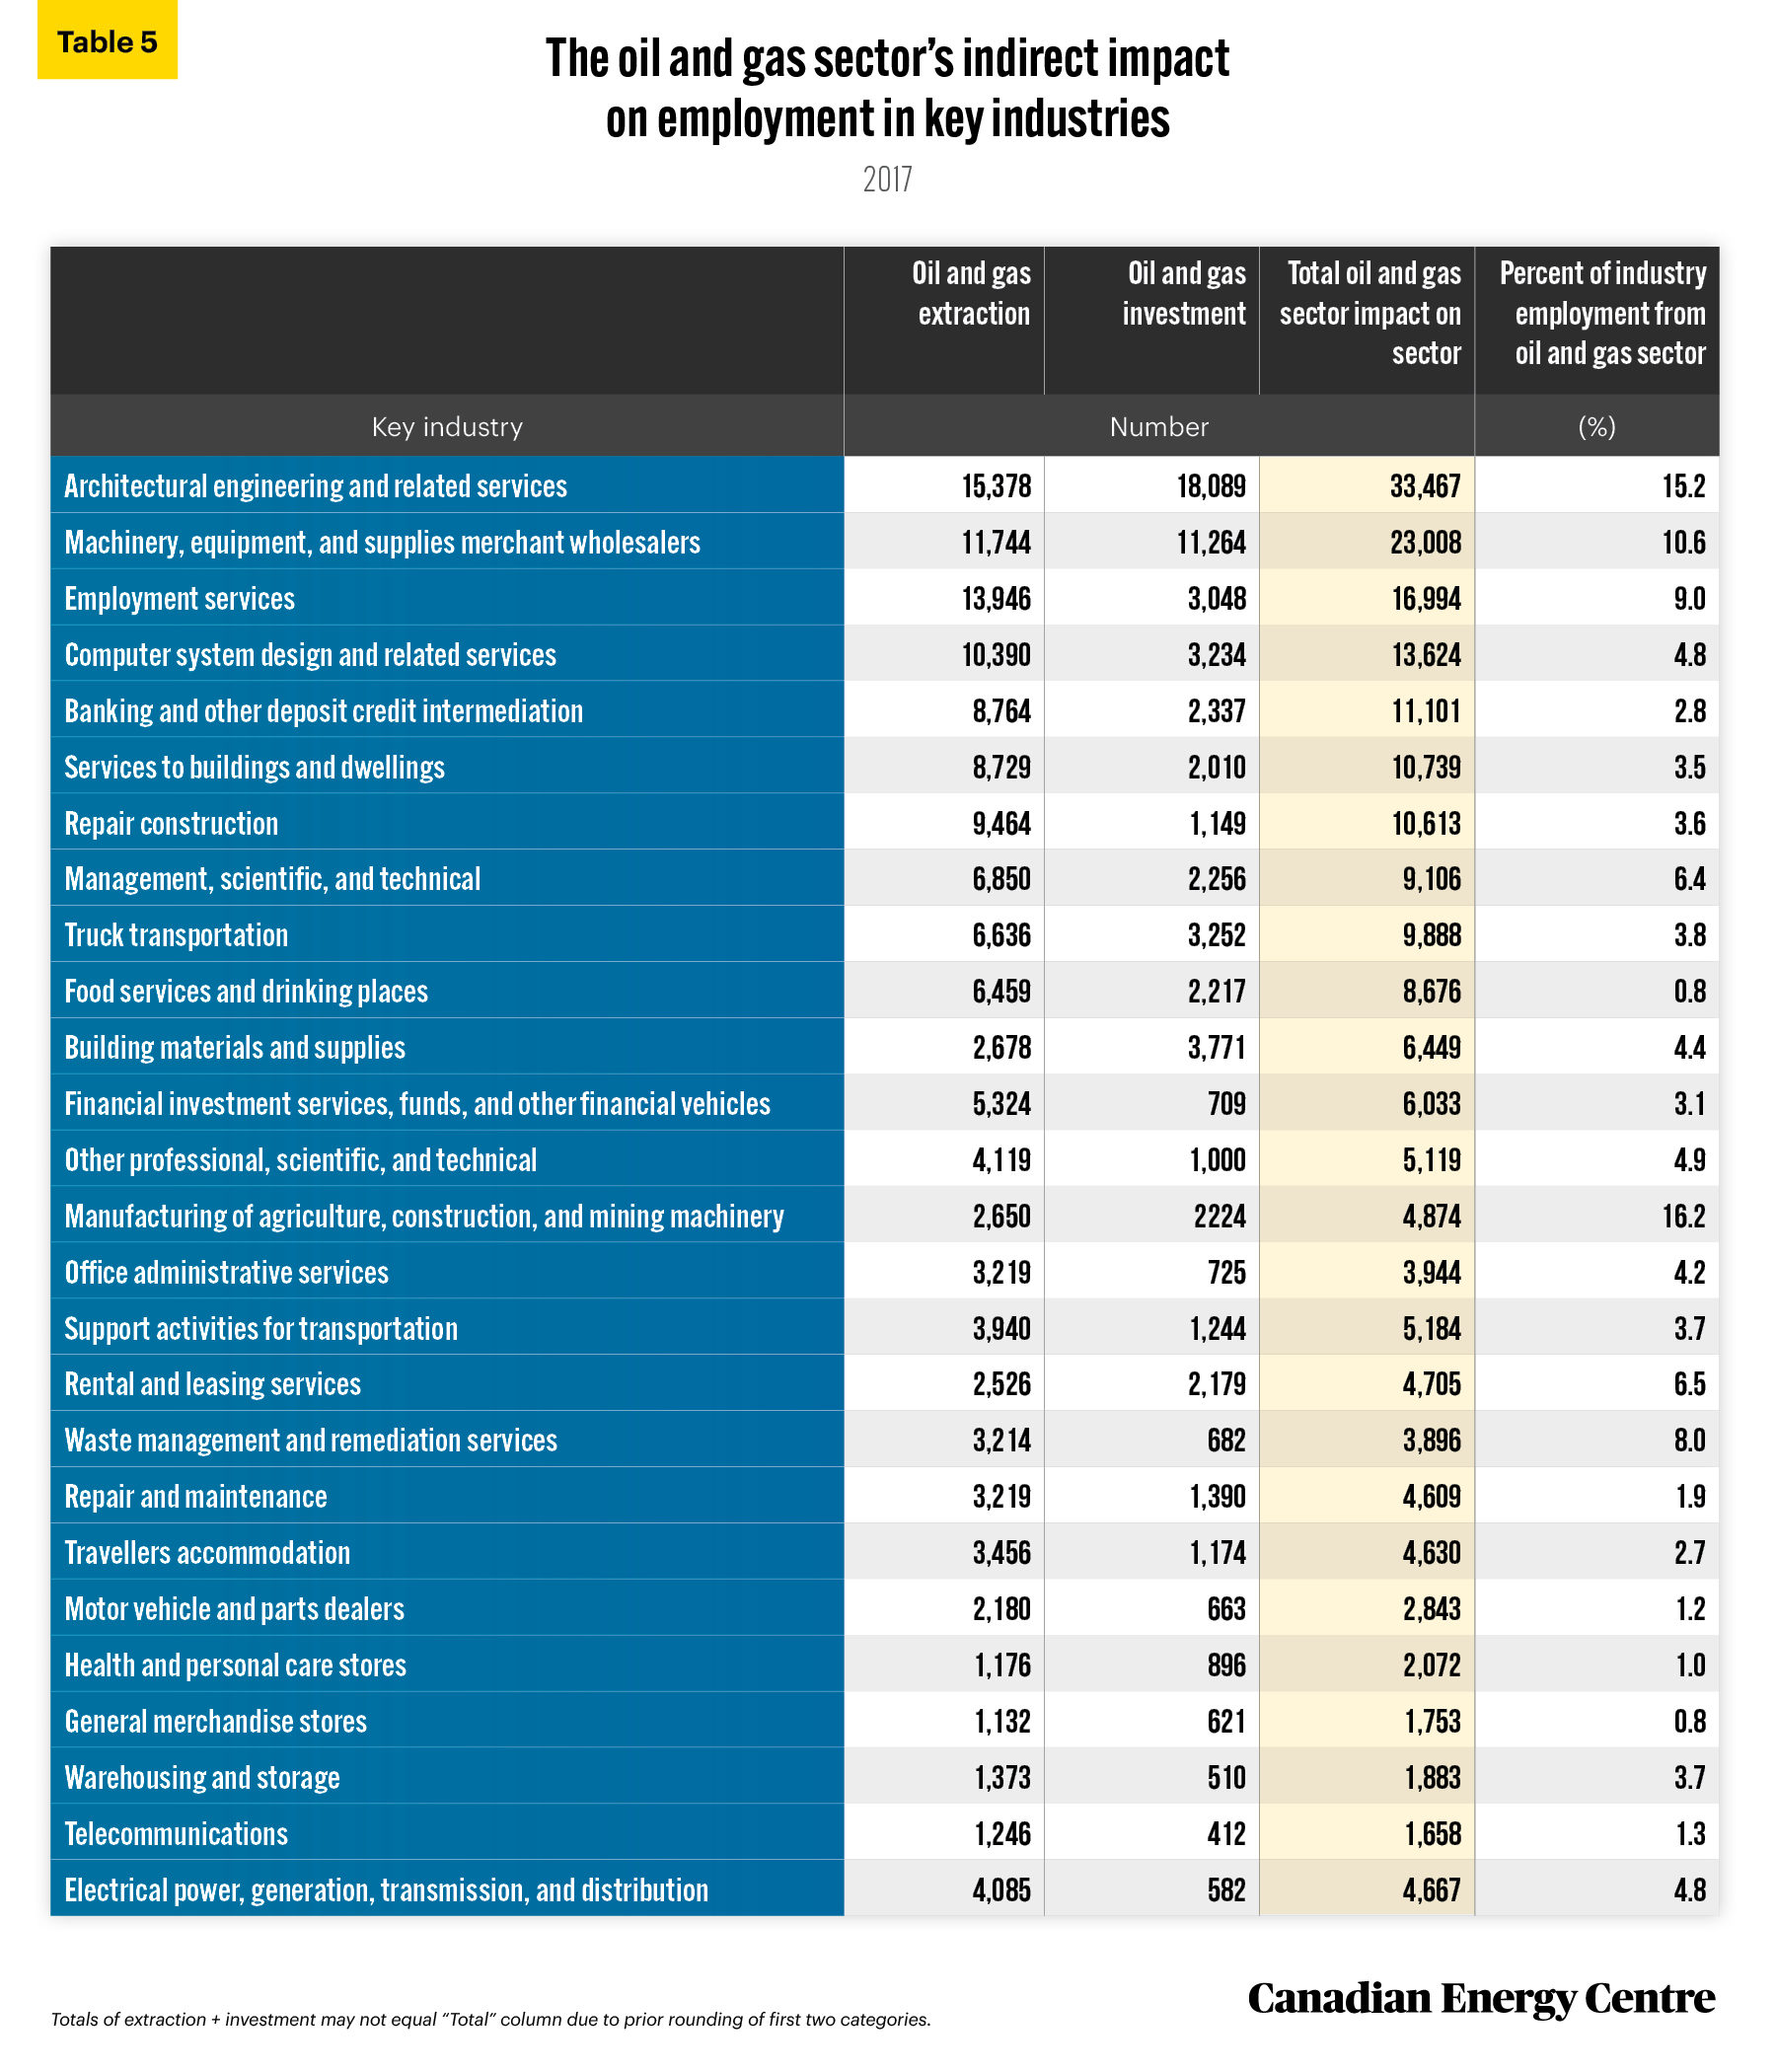
In 2017, the Canadian oil and gas sector was responsible for jobs created in other sectors ranging from just over 1,658 jobs in the telecommunications sector (or 1.3 per cent of all jobs in that industry) to 33,467, or 15.2 per cent of all jobs in the architectural engineering and related services sector (see Table 5).
Source: Derived from Statistics Canada Custom Tabulation of the Supply and Use Tables, 2017.
Conclusion
The activities of the broad Canadian oil and gas sector are indirectly responsible for sizeable portions of GDP, employment, and output in key industries across Canada. The impact on the Canadian economy of the broad Canadian oil and gas sector, which includes both the direct
and indirect impacts of oil and gas extraction and oil and gas investment, is significant — even with the energy price decrease of 2017. The impact of the broad sector amounted to 3.2 per cent of all direct and indirect jobs across Canada that year, and made a direct and indirect contribution of 6.4 per cent to Canada’s total GDP and total output, or purchase of goods and services. The narrower, direct oil and gas extraction sector was responsible for about 3.2 per cent of GDP in 2017.
Notes
This CEC Fact Sheet was compiled by Lennie Kaplan at the Canadian Energy Centre (www.canadianenergycentre.ca). The authors and the Canadian Energy Centre would like to thank and acknowledge the assistance of an anonymous reviewer in reviewing the original data and research for this Fact Sheet. Image credits: Devon MacKay from Unsplash.com
References (All links live as of November 1, 2021)
Fellows, G. Kent and Jennifer Winter (2018), Getting to Know Models: A Primer and Critique on Input-Output and Computable General Equilibrium Models and Their Uses for Policy and Project Analysis, University of Calgary, School of Public Policy <https://bit.ly/3mQ9jSY>; Statistics Canada (2018), National and Provincial Multipliers, Surveys and statistical programs –Documentation: 15F0046X <https://bit.ly/32L4L8q>; Statistics Canada (2020), The Decline in Production and Investment in Canada’s Oil and Gas Sector and its Impact on the Economy, July 2020, Economic Insights, 11-626-X, No. 109 <https://bit.ly/32LbTlb>; Statistics Canada (2021a), Table 34-10-0035-01: Capital and repair expenditures, non-residential tangible assets, by industry and geography <https://bit.ly/3kwcTPW>; Statistics Canada (2021b), Custom tabulation of the oil and gas sector derived from the 2017 Supply and Use Tables; Statistics Canada (2021c), Table 36-10-0400-01: Gross domestic product (GDP) at basic prices, by industry, provinces and territories, percentage share <https://bit.ly/2ZNJAQU>: Statistics Canada (2021d), Table 36-10-0401-01: Gross domestic product (GDP) at basic prices, by industry (x 1,000,000) <https://bit.ly/3kte7LV>; Statistics Canada (2021e), Table 36-10-0402-01: Gross domestic product (GDP) at basic prices, by industry, provinces and territories (x 1,000,000) <https://bit.ly/35MzpQA>; Statistics Canada (2021f), Table 36 10-0480-01: Labour productivity and related measures by business sector industry and by non-commercial activity consistent with the industry accounts <https://bit.ly/3kte82r>; Statistics Canada (2021g), Table 36-10-0488-01: Output, by sector and industry, provincial and territorial (x 1,000,000). <https://bit.ly/31mzCd6>; Statistics Canada (2021h), Table 36-10-0478-01: Supply and use tables, detail level, provincial and territorial (x 1,000) <https://bit.ly/3mCm9nt>; Statistics Canada (2021i), Supply, Use and Input-Output Tables, 2019 <https://bit.ly/2G0S3tk>.
Methodology
The estimates presented in this paper are the result of a Statistics Canada custom tabulation of the Canadian oil and gas sector taken from the Supply and Use Tables (SUTs). The SUTs capture and present the production of products by domestic industries, imports of products as well as their use, either as inputs, final consumption, investment or exports. The latest SUTs are for the 2017 calendar year. The total direct and indirect) impact of the oil and gas industry on the Canadian economy can be quantified using input-output multipliers derived from the SUTs. According to Statistics Canada (2018), these multipliers “provide a measure of the interdependence between an industry and the rest of the economy” (Statistics Canada, 2018, National and Provincial Multipliers, Surveys and statistical programs, Documentation: 15F0046X). As Statistics Canada notes, although there is a lag from the 2017 data, the structure of the Canadian economy evolves slowly, so the lag should have a minimal impact on the estimates of GDP, jobs, and output (Statistics Canada, Economic Insights, 11-626-X, No. 109, The Decline in Production and Investment in Canada’s Oil and Gas Sector and its Impact on the Economy, July 2020. This fact sheet applies the same concepts and definitions of oil and gas extraction activities as used by the North American Industry Classification System (NAICS), Canada 2012. The Canadian SUTs use the Supply and Use Product Classification (SUPC) system, a variant based on the North American Product Classification System (NAPCS), to classify products within the economy.
Definitions
Using Statistics Canada terminology, we define the broad Canadian oil and gas sector as the sum of oil and gas extraction (NAICS 211) and oil and gas investment. For the purposes of NAICS and NAPCS, oil and gas extraction comprise establishments primarily engaged in operating oil and gas field properties. Such activities may include exploration for crude petroleum and natural gas; drilling, completing, and equipping wells; operating separators, emulsion breakers, desilting equipment, and field gathering lines for crude petroleum; and all other activities in the preparation of oil and gas up to the point of shipment from the producing property. This subsector includes the production of oil, the mining and extraction of oil from oil shale and oil sands, and the production of gas and hydrocarbon liquids, through gasification, liquefaction, and pyrolysis of coal at the mine site. Oil and gas investment includes capital expenditures on construction, machinery and equipment, and exploration by the oil and gas extraction industry. GDP is defined as the unduplicated value of the goods and services produced in the economy. Output consists primarily of the value of goods and services produced by an industry. Jobs include employee jobs (full-time, part-time, and seasonal) and self-employed jobs. The direct impact of oil and gas extraction is the effects directly attributed to this industry’s production. The direct impact of oil and gas investment is the deliveries by domestic industries to satisfy capital expenditures by the oil and gas extraction industry. The indirect impact covers upstream economic activities associated with supplying intermediate inputs (the current expenditures on goods and services used up in the production process) to the directly affected industries. (Excerpts taken from Statistics Canada, Contribution of the Oil and Gas Sector to the Canadian Economy in 2016, 2020, custom tabulation.)
Creative Commons Copyright
Research and data from the Canadian Energy Centre (CEC) is available for public usage under creative commons copyright terms with attribution to the CEC. Attribution and specific restrictions on usage including non-commercial use only and no changes to material should follow guidelines enunciated by Creative Commons here: Attribution-NonCommercial-NoDerivs CC BY-NC-ND.