
Social
To sign up to receive the latest Canadian Energy Centre research to your inbox email: research@canadianenergycentre.ca
Download the PDF here
Download the charts here
Overview
The oil and gas extraction sector in Alberta has made a significant and direct contribution to Canada’s GDP, output, and jobs over the past decade. The broader energy sector has also made a significant contribution to federal and provincial government revenues in the form of corporate income taxes and royalties (as noted in a previous research brief).¹
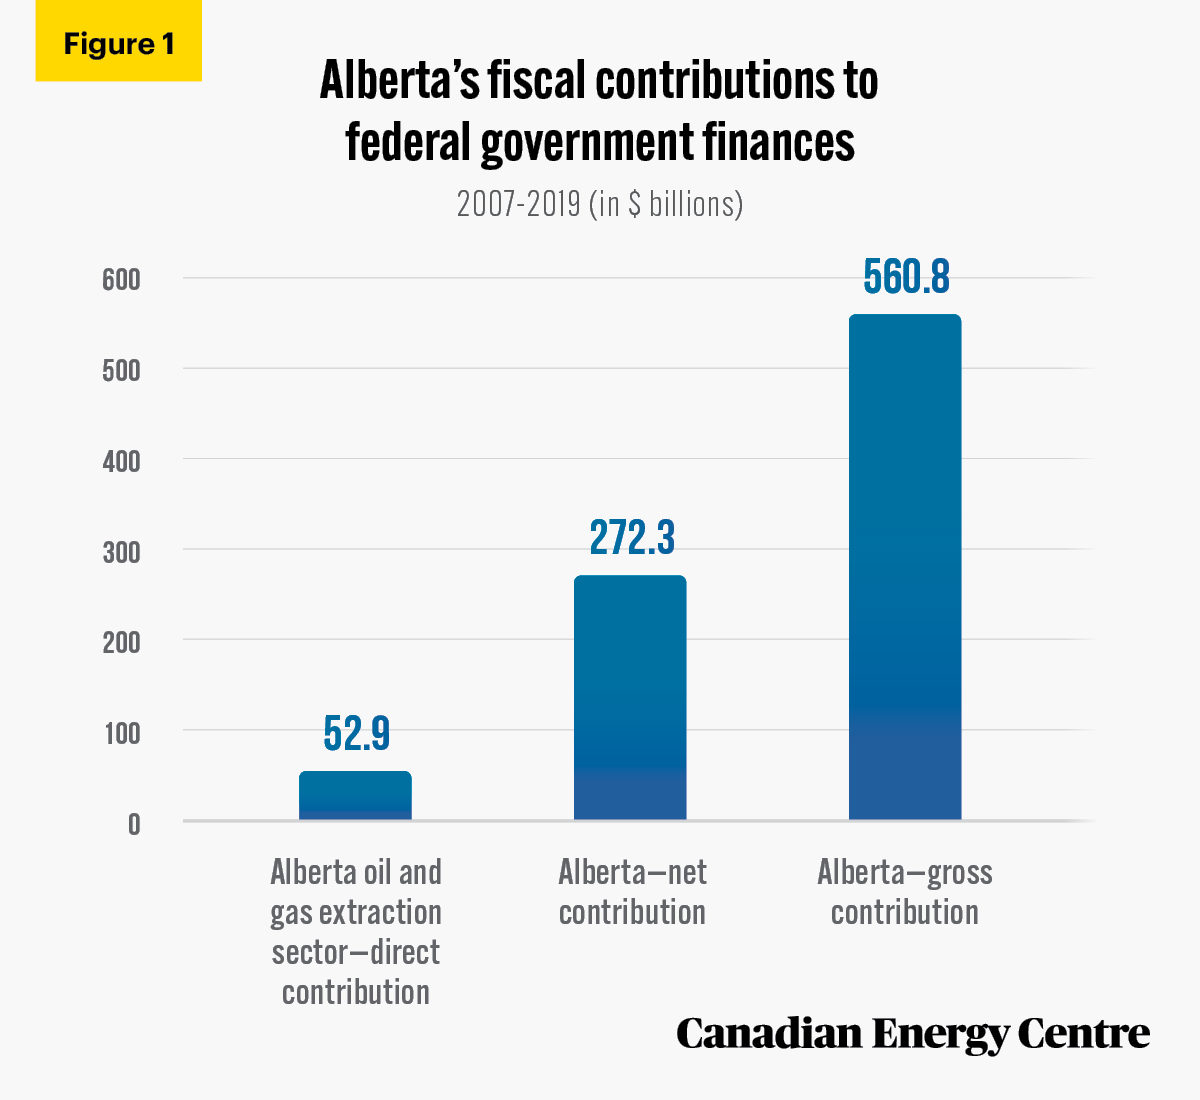
In this Fact Sheet, we narrow our focus to the direct impact of the oil and gas extraction sector on Alberta’s gross and net fiscal contribution to federal government finances between 2007 and 2019 (see Figure 1).²
- In the years examined, Alberta’s taxpayers (individual and corporate) made a $561 billion gross contribution and a $272 billion net contribution to federal government finances;
- The share of that coming from Alberta’s oil and gas extraction sector was, at a minimum, nearly $53 billion, or about 9 per cent of Alberta’s gross contributions and 19 per cent of its total net fiscal contribution over the period;
- On an annual basis, the annual contribution of the oil and gas extraction sector has ranged from $2.7 billion to $6 billion, or about 15 per cent to just under 32 per cent of Alberta’s total net contribution to the federal government’s finances during the period.
- The average annual contribution from oil and gas has been over $4.1 billion per year over the period.
- The $53 billion figure is understated as it does not include indirect federal taxes on production and taxes on products (i.e., GST, excise taxes, duties, import taxes, air transportation tax, gasoline and motive fuel taxes, etc.) paid by the oil and gas extraction sector in Alberta over the period
1. See CEC’s September 2021 Research Brief #17 where we conservatively estimated oil and gas revenues to federal and provincial and municipal governments at $505 billion between 2000 and 2019.
2. In this fact sheet, Alberta’s net annual fiscal contribution refers to the difference between federal revenues raised in Alberta from individuals and businesses and federal expenditures made to Albertans and the provincial government. The Alberta government, as with all provincial governments, does not contribute directly to federal revenues. As with all statistical documents, analysts and commentators will often use “shorthand” language whereby “Alberta’s contributions” means tax and other payments from individuals and corporations from those in Alberta.
Source: Derived from Statistics Canada, Table 36-10-0450-01; Alberta Finance, Albertan’s Net Contribution to Confederation for 2011; and Statistics Canada, Table 17-10-0005-01: Population estimates on July 1st, by age and sex.
Alberta’s net fiscal contribution to federal government finances: A summary
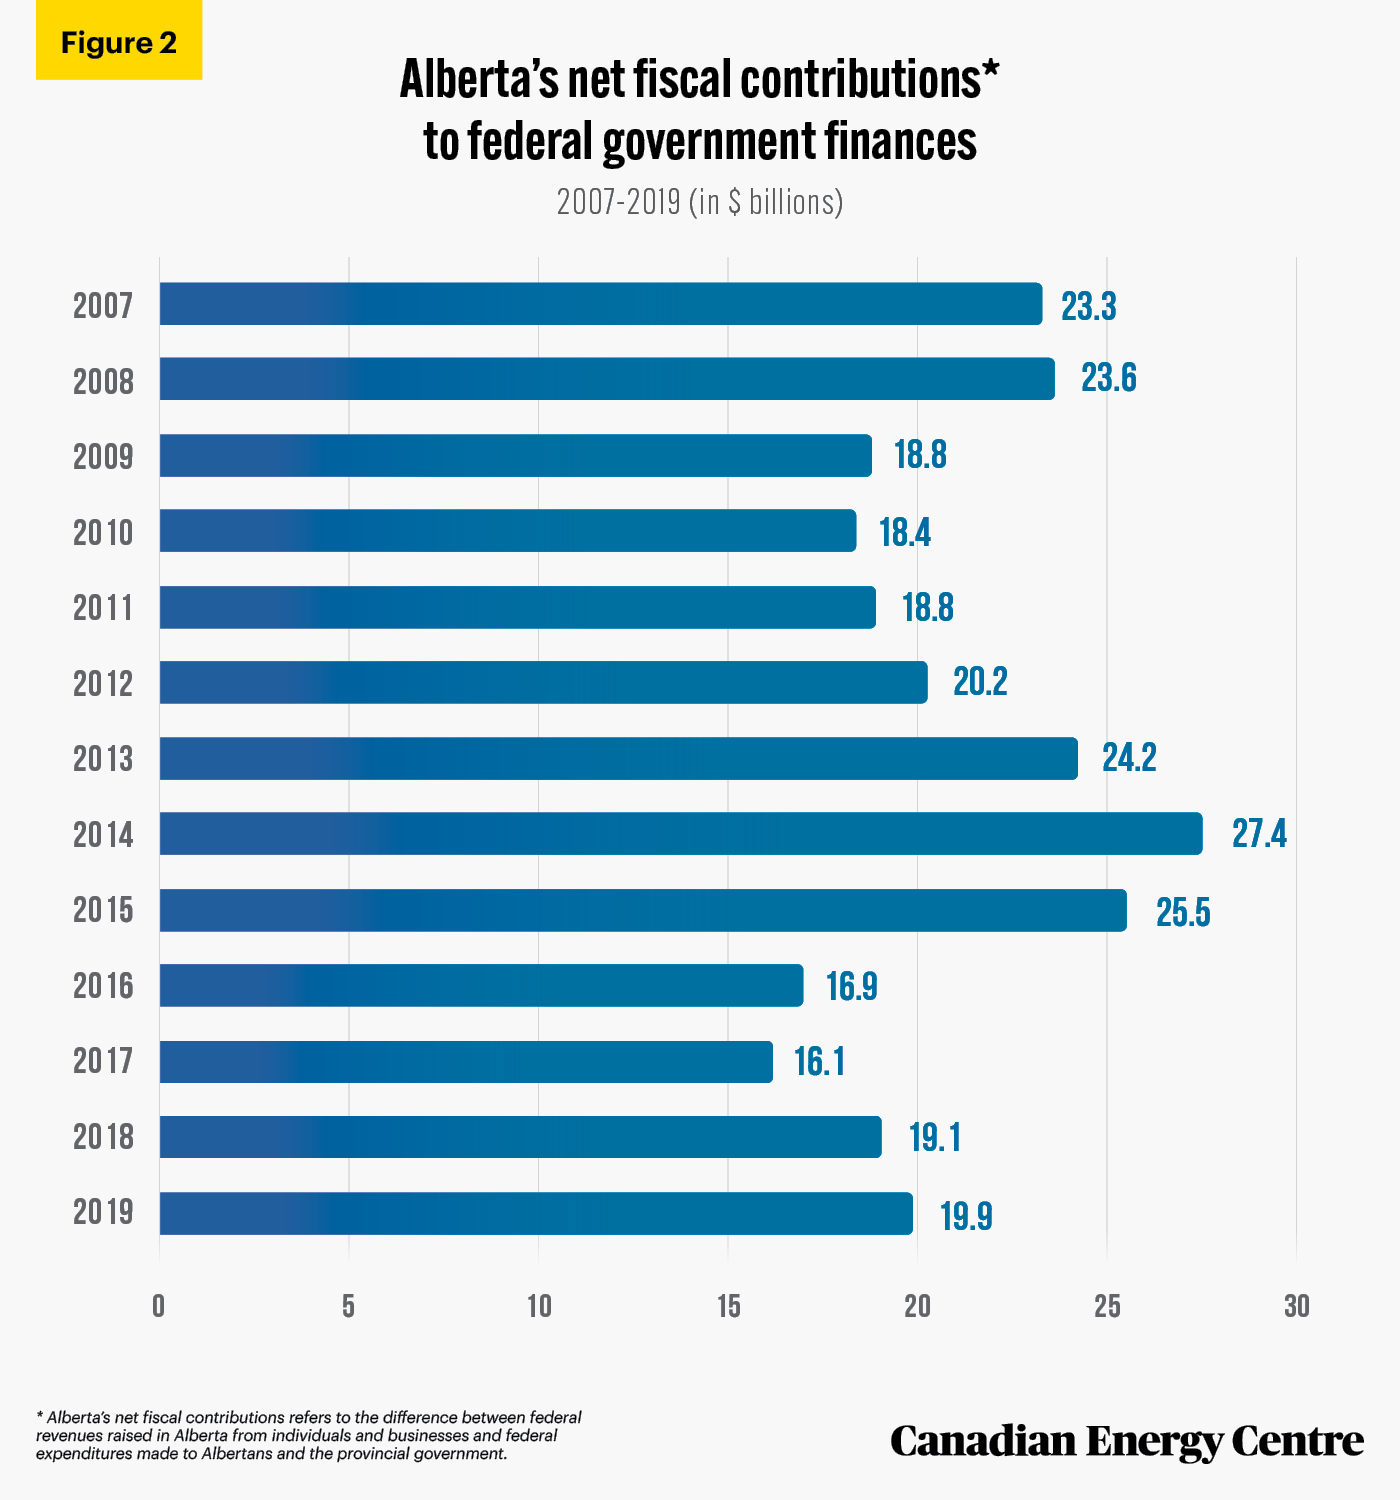
Despite persistently low energy prices, Alberta’s citizens and businesses have continued to make a significant contribution to federal government finances (see Figure 2 and Addendum Table).
Between 2007 and 2019:
- Alberta’s citizens and businesses made $272.3 billion in net contributions to federal government finances, or an average of $20.9 billion per year.³
- Alberta’s net contribution to federal government finances peaked in 2014 at roughly $27.4 billion. Since then, it has declined somewhat, falling to $16.1 billion in 2017, before rebounding to slightly less than $19.9 billion in 2019.
3. Net contributions are calculated by subtracting federal government expenditures in Alberta/to Albertans/to the provincial government from taxes and other revenues paid to the federal government by Albertans and Alberta businesses. Net contribution calculations are based on the methodology and categories established by Alberta Finance (2012).
Source: Derived from Statistics Canada, Table 36-10-0450-01; Alberta Finance, Albertan’s Net Contribution to Confederation for 2011; and Statistics Canada, Table 17-10-0005-01: Population estimates on July 1st, by age and sex.
The impact of Alberta’s oil and gas extraction sector on Alberta’s net fiscal contribution to federal government finances
The impact of the oil and gas extraction sector on Alberta’s net fiscal contribution to federal finances is determined by the direct and indirect taxes that the sector pays to the federal government annually. They include:
1. Federal personal income taxes, or direct taxes from persons, paid by employees who work directly within Alberta’s oil and gas extraction sector;
2. Federal corporate taxes, or direct taxes from corporations, paid by corporations and business enterprises in Alberta’s oil and gas extraction sector;
3. Federal taxes on production and taxes on products (i.e., GST, excise taxes, duties, import taxes, air transportation tax, gasoline and motive fuel taxes, etc.), or indirect taxes paid by the oil and gas extraction sector in Alberta.
Direct federal personal income taxes from persons
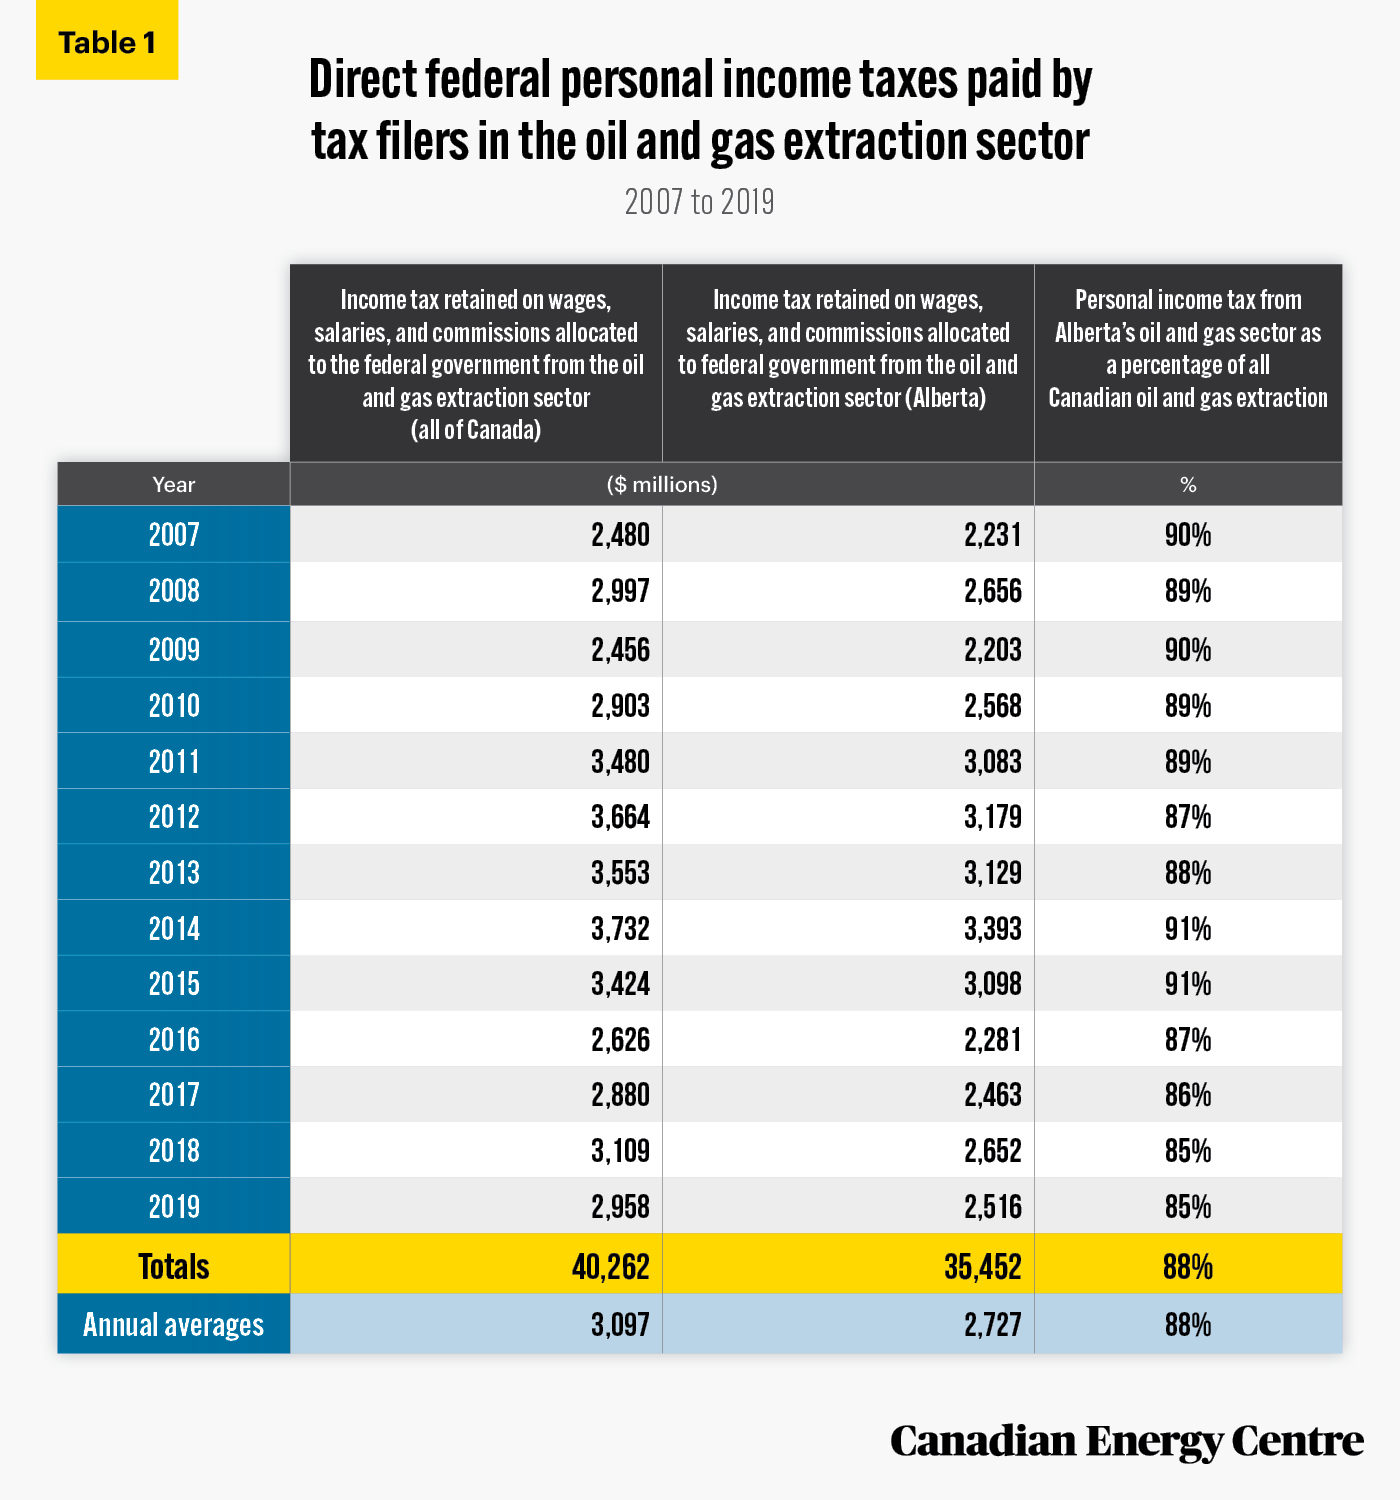
Between 2007 and 2019, total federal personal income taxes or direct taxes from tax filers employed in the oil and gas extraction sector in Canada ranged from about $2.5 billion to $3.7 billion (see Table 1).
Derived from Statistics Canada, Table 11-10-0073-01; and Statistics Canada, T1 Family File (custom tabulation)
To determine the share of federal taxes raised directly in Alberta from the oil and gas extraction sector, we examine the federal income tax retained on wages, salaries, and commissions in Alberta from the oil and gas extraction sector as derived from a custom tabulation drawn from the Statistics Canada T1 Family File.
Between 2007 and 2019, federal personal income taxes paid by tax filers employed in the oil and gas extraction sector in Alberta has ranged from $2.2 billion to $3.4 billion or an annual average of over $2.7 billion per year over the period. This represents about 88 per cent, on average, of federal income taxes retained on wages, salaries, and commissions from tax filers in Canada employed in the oil and gas extraction sector over the period.
The high variability of income tax collected likely reflects, in part, the changing fortunes of the sector and the consequent change in the federal government’s personal income tax base in Alberta. Those changing fortunes include the impact of the Great Recession that began in 2009 and the energy price decline that began in 2014.
Direct federal corporate income taxes from corporations
Federal corporate income taxes from corporations and business enterprises in the oil and gas extraction sector ranged from $525 million to $3.9 billion between 2007 and 2019 (see Table 2).
Based on a custom tabulation from Statistics Canada, between 2007 and 2019 an annual average of between 79 per cent and 96 per cent of federal corporate taxes from corporations and business enterprises in the oil and gas extraction sector were collected from oil and gas extraction businesses and enterprises in Alberta.
Corporations and business enterprises in the oil and gas extraction sector in Alberta paid yearly federal corporate taxes ranging from $413 million to nearly $3.8 billion between 2007 and 2019, or an annual average of $1.3 billion per year over the period.
The high variability of income tax collected likely reflects, in part, the changing fortunes of the oil and gas extraction sector and the consequent change in the federal government’s corporate income tax base in Alberta. Those changing fortunes include the impact of the Great Recession that began in 2009 and the energy price decline that began in 2014.

Derived from Statistics Canada, Table 33-10-0006-01; Statistics Canada, Financial and taxation statistics for enterprises, by industry type; and Statistics Canada, Financial and taxation statistics for enterprises, by industry type, custom tabulation.
Putting it all together
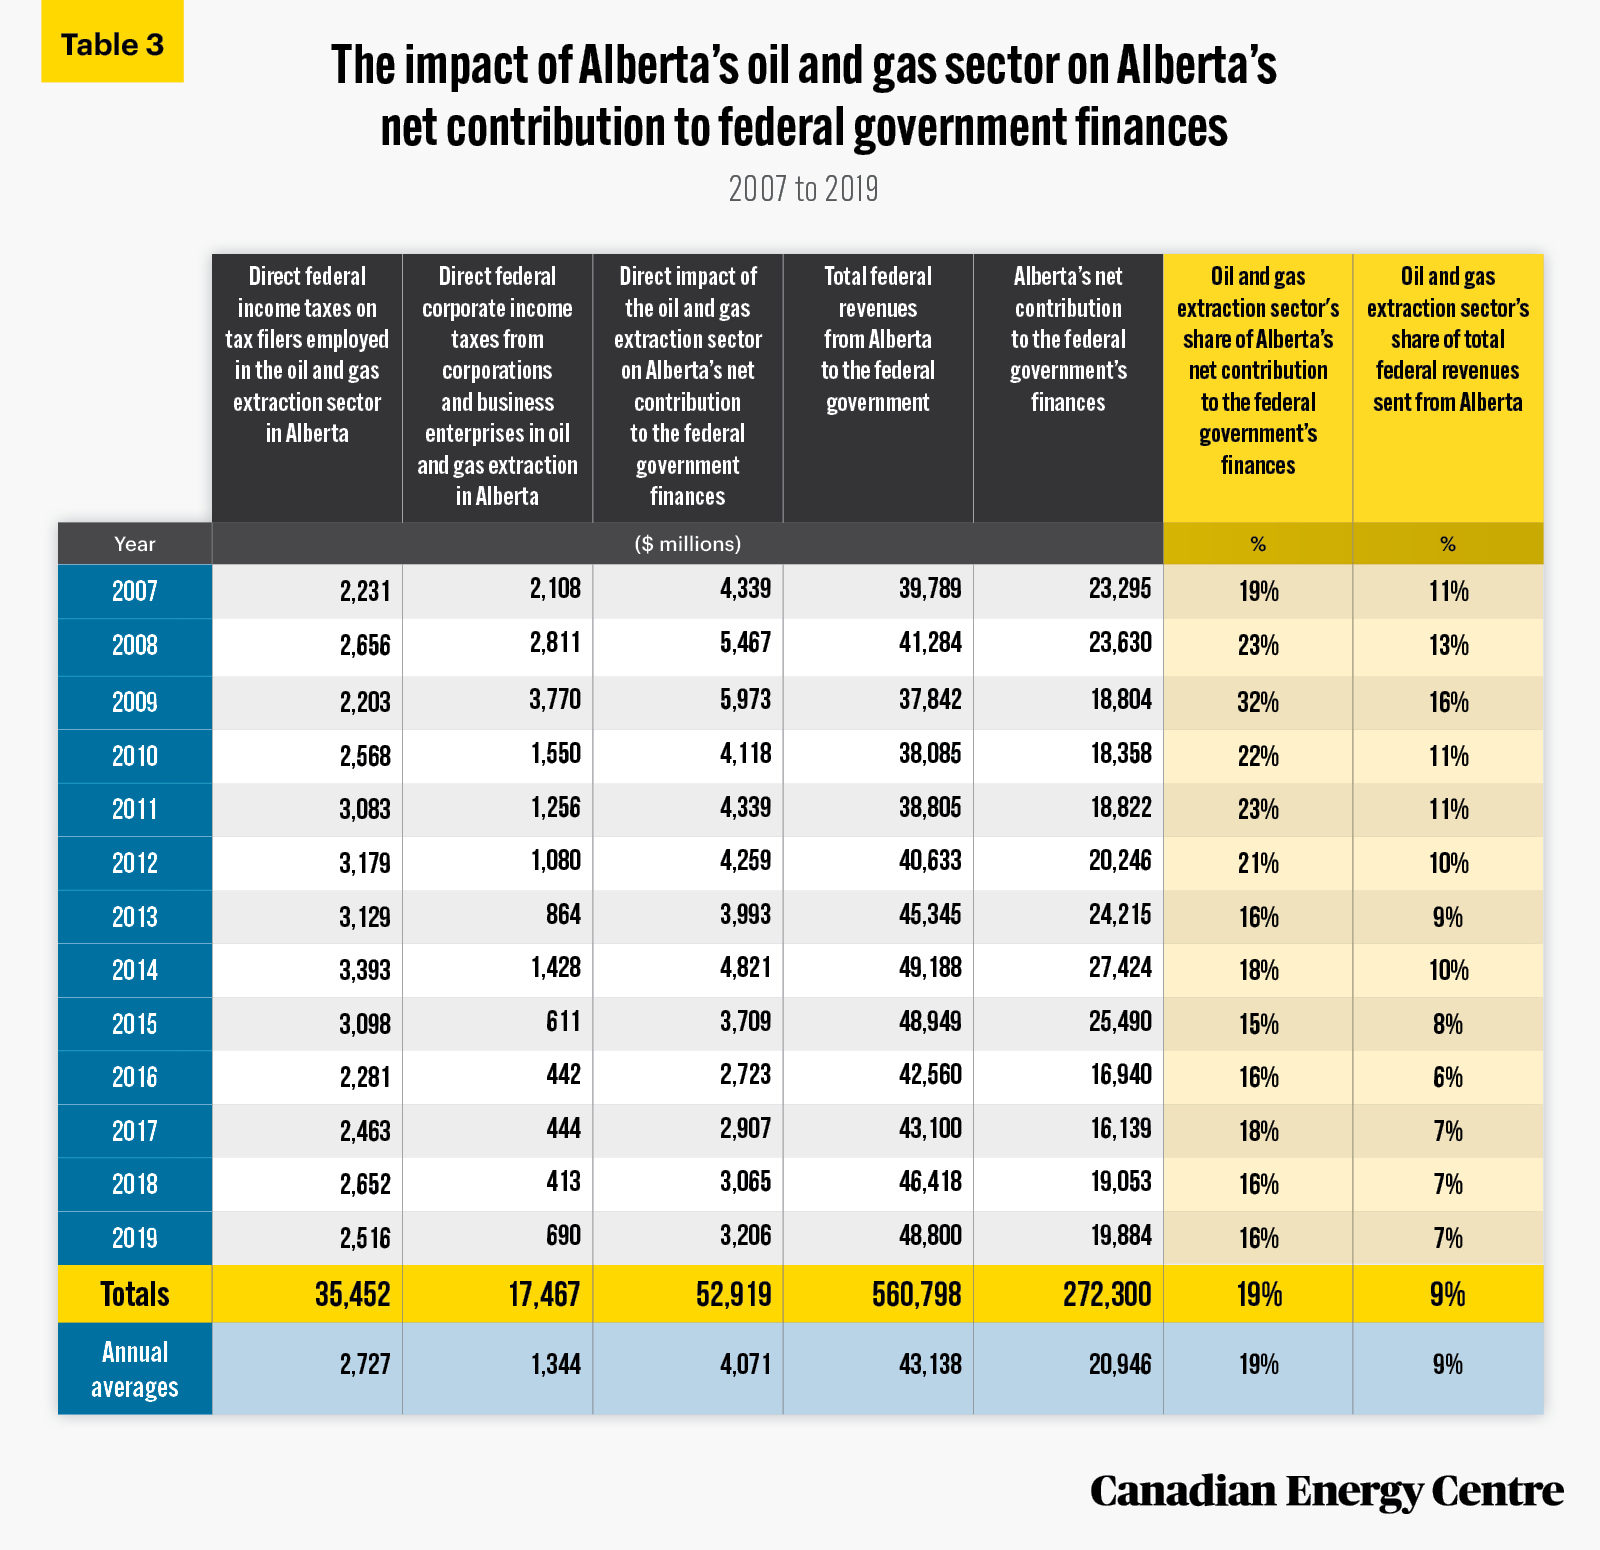
The direct impact of the oil and gas sector on Alberta’s gross and net contribution to federal government finances is significant. Between 2007 and 2019, the contribution from the sector in Alberta was as follows (see Table 3):
- In total, the sector contributed a minimum of nearly $53 billion of Alberta’s $561 billion total revenue contribution to federal finances (an average of nearly $4.1 billion per year) or 9 per cent of Alberta’s gross revenue contribution over the period;
- The $53 billion was 19 per cent of Alberta’s total net fiscal contribution over the period;
- The $53 billion figure is understated as it does not include indirect federal taxes on production and taxes on products (i.e., GST, excise taxes, duties, import taxes, air transportation tax, gasoline and motive fuel taxes, etc.) that the oil and gas extraction sector in Alberta paid over the period.
Source: Derived from Statistics Canada, Table 36-10-0450-01; Table 11-10-0073-01; Table 33-10-0006-01; T1 Family File (custom tabulation); and Financial and taxation statistics for enterprises, by industry type (custom tabulation).
Addendum
Net contribution calculations in the Addendum Table are based on the methodology and categories established by Alberta Finance (2012).

Source: Derived from Statistics Canada, Table 36-10-0450-01.
Addendum and a caveat on net fiscal contributions to federal government finances
This use of Statistics Canada data to calculate net flows between federal government expenditures in provinces and revenues from the same has limitations. Readers should be aware that while the data can be used to show flows in general—Albertans through their federal personal and corporate taxes and other payments contribute in far higher proportions than their share of the national population— there are criticisms of more specific calculations. In a 2007 Statistics Canada article, analyst Steve West noted how federal transfer money sent to Atlantic Canada but which is then used to purchase medical equipment in Ontario makes the question of which province benefits more complicated. Also, as one of us has written in the past, it is unrealistic to expect that federal flows into provinces (spending on individuals, businesses, and others or federal transfers to provincial governments), will exactly replicate “outflows” from the same provinces. One reason for that is the example just noted, but another is how Albertans, for example, when unemployment was lower than the national average, would have contributed more in employment insurance premiums to the federal government than were paid out in return, in the form of EI premiums, to unemployed Albertans. That scenario creates an obvious but entirely understandable imbalance between the two flows.
However, as one of us has also noted in a past study (Milke 2013), on the first example, “such different assignments are routine and expected and thus do not negate the possibility of using such data as a proxy in the absence of more detailed and precise data.” Relevant to both examples, though, is a follow-up point from the same study, “Moreover, such assignment of spending does not detract from how larger and more prosperous economies such as Alberta have economies that are significantly larger as a percentage of the national economy vis-à-vis their population (and thus are proportionately higher contributors to federal tax coffers when compared to say, Quebec).”
For our purposes, despite the limitations in the data—readers should think of the available data as a proxy and as indicative of trends—what is clear is that tax and other payments from the Alberta oil and gas sector (and from other Alberta businesses and individuals) are substantial. Measured on both a net basis and on a net per capita basis (and with comparisons to net contributions from other provinces’ individuals and corporations profiled in studies noted in the above paragraph and later in this one), the flows demonstrate the significance and importance of both the oil and gas sector and Alberta to the national economy and federal revenues. This is an observation that has also been made by others. They include Ben Eisen et al. in a 2019 study, and Robert Mansell et al. in a 2020 study.
Notes
This CEC Fact Sheet was compiled by Lennie Kaplan and Mark Milke at the Canadian Energy Centre (www.canadianenergycentre.ca). The authors and the Canadian Energy Centre would like to thank and acknowledge the assistance of an anonymous reviewer in reviewing the original data and research for this Fact Sheet. Image credit: Igor Kyryliuk from Unsplash.com
References (All links live as of Oct 11, 2021)
Alberta (undated), Oil [and natural gas] prices [downloaded CVS file] <https://bit.ly/2FK1Cg7>; Alberta Finance (2012), Albertan’s Net Contribution to Confederation for 2011 <https://bit.ly/3mypYej>; Eisen, Ben, Steve Lafleur, and Milagros Palacios (2019), How Albertans Continue to Keep Federal Finance Afloat <https://bit.ly/34dXIo9>; Eisen, Ben, Steve Lafleur, and Milagros Palacios (2020), A Friend in Need: How Albertans Continue to Keep Federal Finances Afloat, 2020 <https://bit.ly/3lkGpeX>; Mansell, Robert, Mukesh Khanal, and Trevor Tombe (2020), The Regional Distribution of Federal Fiscal Balances: Who Gets, Who Pays, and Why It Matters <https://bit.ly/3l3YpHj>; Milke, Mark (2013), Super-Sized Fiscal Federalism <https://bit.ly/2HOeYc4>; Statistics Canada, Table 11-10-0073-01: Wages, salaries and commissions of tax filers aged 15 years and over by main industry sector and sex <https://bit.ly/2ZZpQtP>; Statistics Canada, Table 33-10-0006-01: Financial and taxation statistics for enterprises, by industry type <https://bit.ly/2HkMztY>; Statistics Canada, Table 36-10-0450-01: Revenue, expenditure and budgetary balance – General governments, provincial and territorial economic accounts <https://bit.ly/33InsZy>; Statistics Canada (2020), Supply and Use Tables [data from 2017] <https://bit.ly/32NnIau>; Statistics Canada, Financial and taxation statistics for enterprises, by industry type, custom tabulation; Statistics Canada, T1 Family File of the Centre for Income and Socio-Economic Well-Being, Annual Income Estimates for Census Families and Individuals (T1 Family File), custom tabulation; West, Steve (2007), Federal Government Revenue and Spending by Province: A Scorecard of Winners and Losers in Confederation? Canadian Economic Observer (February): 3.1, Statistics Canada <https://bit.ly/33hv9qD>; Statistics Canada (2021), Table 17-10-0005-01: Population estimates on July 1st, by age and sex. <https://bit.ly/3iQO0Aj>.
Creative Commons Copyright
Research and data from the Canadian Energy Centre (CEC) is available for public usage under creative commons copyright terms with attribution to the CEC. Attribution and specific restrictions on usage including non-commercial use only and no changes to material should follow guidelines enunciated by Creative Commons here: Attribution-NonCommercial-NoDerivs CC BY-NC-ND.