
Social
Big gaps in plans to achieve Canada’s Paris climate change commitment will mean 300,000 fewer jobs and $54 billion in GDP sacrificed by 2030, according to research brief by the Canadian Energy Centre.
The findings are based on data commissioned by the CEC from Navius Research and outlines the potential impacts of Canada’s commitments under the Paris Agreement on the economy, jobs, and investment in Canada in general and on the Canadian oil and gas sector in particular.
The analysis shows that there is a significant gap between GHG reductions expected from existing promised policy and the GHG reductions required to meet Canada’s Paris targets. The analysis shows that addressing this gap will come at a significant cost to the Canadian economy, and the Canadian oil and gas sector in particular.
Highlights of the Research Brief include:
- There is a 112-megatonne (MT) gap between what existing climate change policy will deliver in terms of GHG reductions and what will be necessary to achieve Canada’s Paris target of reducing GHGs 30 per cent from 2005 levels by 2030.
- Almost half that gap (54 MT) will fall on Alberta to achieve, including a massive reduction required by the oil and gas sector.
- The federal carbon tax will more than double between 2025 and 2030.
- Investment in Canada will be $19.5 billion less than assumed under what the Research Brief refers to as “Promised Policy”.
- National Gross Domestic Product will be $54 billion less than it would otherwise be.
- Reduction in GDP and investment as a result of addressing the gap will mean 300,000 fewer jobs as of 2030 than would otherwise be the case.
- The foregone jobs are akin to all the jobs (in 2019) in Newfoundland and Prince Edward Island combined. They are also equivalent to all the jobs in British Columbia’s forestry, construction, transportation and warehousing sectors.
Summary
———————————
Governments around the world have committed to reducing greenhouse gas emissions, most notably by committing to Paris COP 21.¹ Canada has committed to cut greenhouse gas emissions by 30 percent from 2005 levels by 2030 (the “Paris 2030 commitment”). That will require reductions to a level of 511 megatonnes (Mt) annually as of 2030. To achieve that emission reduction goal, the federal government has implemented or proposed a number of policies from carbon taxes to regulations. However, comprehensive analyses of the costs of the country’s commitment — including whether policy intentions may translate to promised reductions and the economic costs of such efforts—have been lacking.
This Research Brief (which can be downloaded here as a pdf), based on data from Navius Research, aims to fill the void by measuring the impact of meeting the Paris commitment on the economy, jobs, and investment in the Canadian oil and gas sector. It does so by pointing out the gap that exists between what the existing and intended policies may accomplish versus what meeting the Paris target would entail.
Throughout this report we label the existing policies and intended commitments as “Promised Policy.” As we will show,more government policy — be it higher carbon taxes or more regulations — will be inevitable if governments intend to reach their promised targets and will lead to higher costs on the economy and employment losses. As of late spring 2020, the federal government has not said what policies and taxes it plans to implement to reach the Paris target, but it insists that that target will be reached. As this analysis shows, however, the federal government has offered no details as to how it will bridge what we call the “Paris Gap,” nor what it will cost Canadians and the oil and gas industry, which employs many Canadians.
Key findings from the Navius data
———————————
The “Promised Policy” scenario will not come close to achieving the Paris 2030 commitment
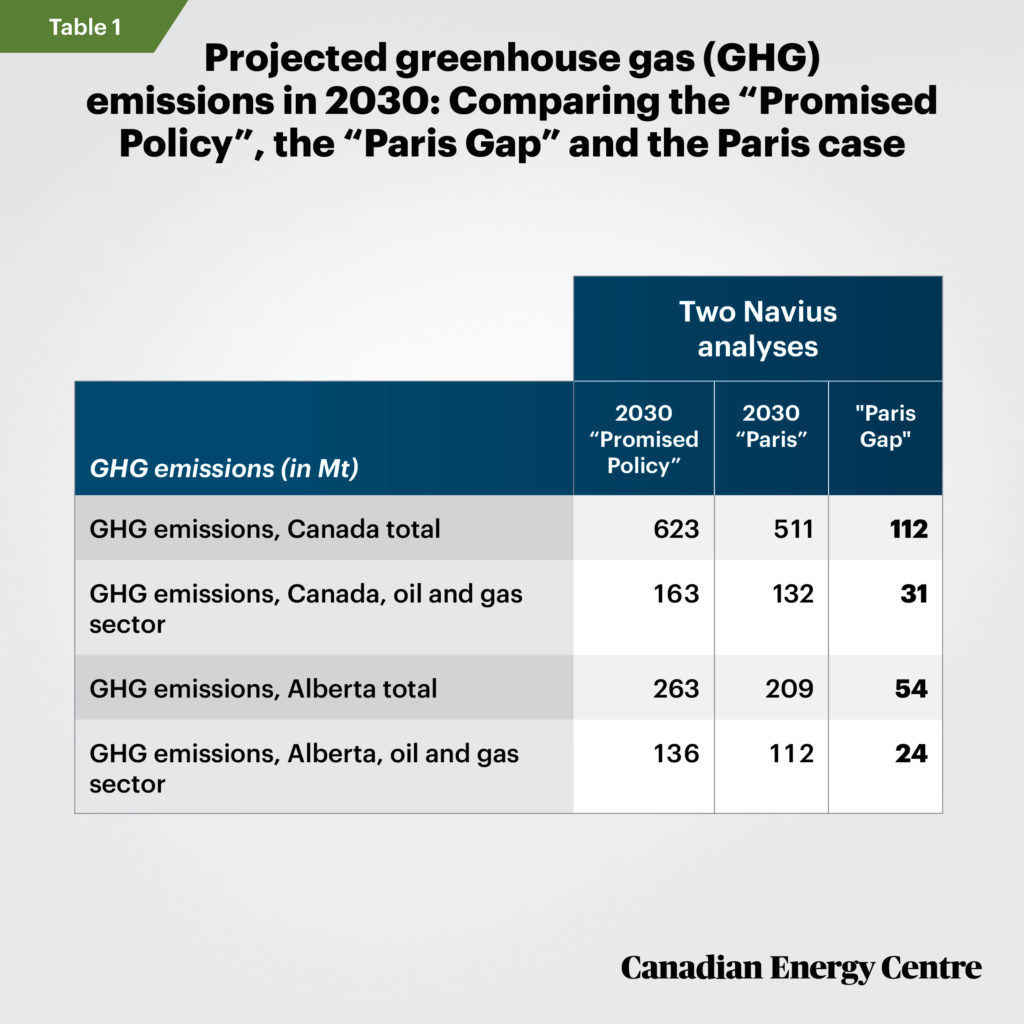
• Promised Policy is insufficient to achieve Canada’s emissions target in 2030. Even with all those policies in place, there is still a gap of 112 megatonnes (Mt) of greenhouse gas emissions relative to the 2030 Paris targets.²
• This 112 Mt gap will lead to additional economic impacts for Canadian GDP, investment, and employment, and in particular for Alberta’s GDP, investment, and employment given that it is at the heart of oil and gas production in Canada.
• In Alberta specifically, resolving the “Paris Gap” would mean that in 2030, Alberta’s emissions would need to fall from 263 Mt under the “Promised Policy” case to 209 Mt under the “Paris” scenario, a reduction of 54 Mt.
• In other words, Alberta would be responsible for nearly half of the 112 Mt gap between emissions under “Promised Policy” and those necessary to meet the Paris commitment.
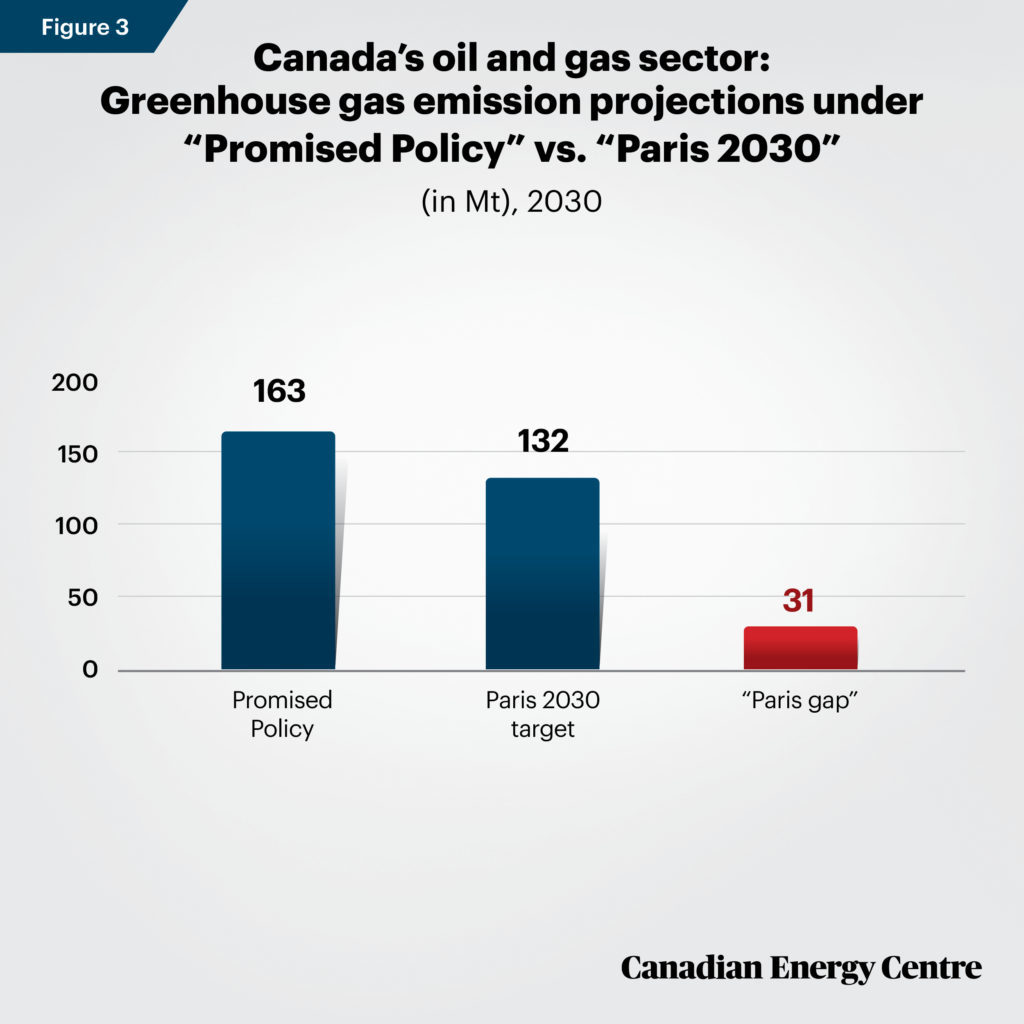
• To bridge the “Paris Gap,” Canadian oil and gas sector emissions would need to fall from 163 Mt under the “Promised Policy” case to 132 Mt under the “Paris” scenario, an additional reduction of 31 Mt by 2030. By way of perspective, this would be equivalent to eliminating emissions from Canada’s entire chemical manufacturing sector (28 Mt of emissions in 2020).
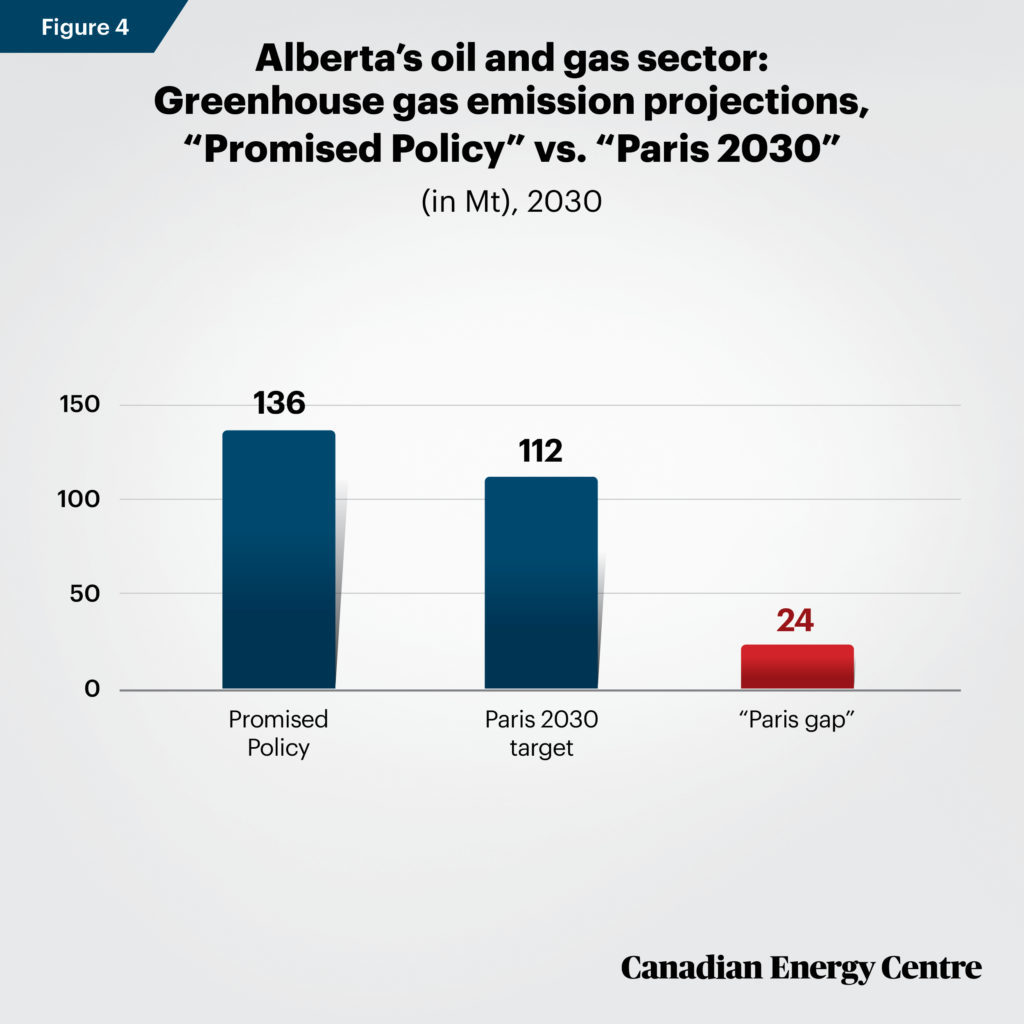
• For Alberta, bridging the “Paris Gap” would mean that oil and gas sector emissions in the province would need to fall from 136 Mt under the “Promised Policy” case to 112 Mt by 2030 under the “Paris” scenario, an additional reduction of 24 Mt. By way of perspective, this would be equivalent to eliminating emissions from Alberta’s entire agriculture sector (20 Mt of emissions in 2020), and then some.
The federal carbon tax will more than double between 2025 and 2030
• In our conservative scenario, the government would rely only on the carbon price to bridge the “Paris Gap.” For Canada to meet its Paris commitment, the federal carbon price would need to increase from $49.15 per tonne in 2025 under the “Promised Policy” scenario to $116.02 per tonne by 2030.
There are, of course, a variety of different policy approaches that the government could use to achieve its emissions reduction goals, including economy-wide regulations and Sector-specific regulations, either of which may have more significant impacts on the economy than the carbon tax alone. While the government is far more likely to combine a carbon tax with an increase in other regulations and
standards, the carbon tax approach provides a lower bound range on the potential costs of reaching the Paris target.
GDP will be significantly lower than under Promised Policy case
- Navius data indicate that if a carbon tax is implemented at a rate assumed sufficient for Canada to reach its Paris target, Canadian GDP will be $54 billion less and Alberta GDP will be $13.5 billion less compared to what it would otherwise be in 2030 under the Promised Policy scenario.
- To reach the Paris target, in 2030 Canada’s oil and gas industry GDP will be $6.6 billion smaller nationally, and $4.5 billion smaller in Alberta, than the decline imposed in the “Promised Policy” case.
There will be 300,000 fewer jobs
- The lower bound policy scenario of bridging the “Paris Gap” will result in 300,000 fewer full-time equivalent (FTE) jobs
in 2030 than under the “Promised Policy” case. - Using 2019 data, this would be akin to:
° Eliminating all of British Columbia’s forestry sector (16,653 jobs), construction sector (166,426 jobs), and transportation and warehousing sector (116,289 jobs) in 2019, or 299,368 jobs in total.
° More than the total number of people employed in Newfoundland & Labrador (216,485) and PEI (69,315) in 2019, or 285,800 jobs in total.
1. Paris COP 21 was the 21st meeting in December 2015 of the Conference of the Parties where
the final wording of the Paris Agreement was adopted by all 195 participating member states.
2. In contrast to Environment and Climate Change Canada’s (ECCC’s) projected 77 Mt gap, the
112 Mt “Paris Gap” in 2030 that this Research Brief details includes 30 Mt of projected
emission reductions from the federal Clean Fuel Standard (CFS) as there is uncertainty as
to the level of emissions reductions that the federal CFS will achieve given existing
provincial policies. In addition, the “Paris Gap” also includes initiatives announced in
the electricity sector where there is no specific policy in place, such as the proposed
shutdown of coal-fired plants in Nova Scotia, along with lower estimates than ECCC
projections of the uptake of renewables.
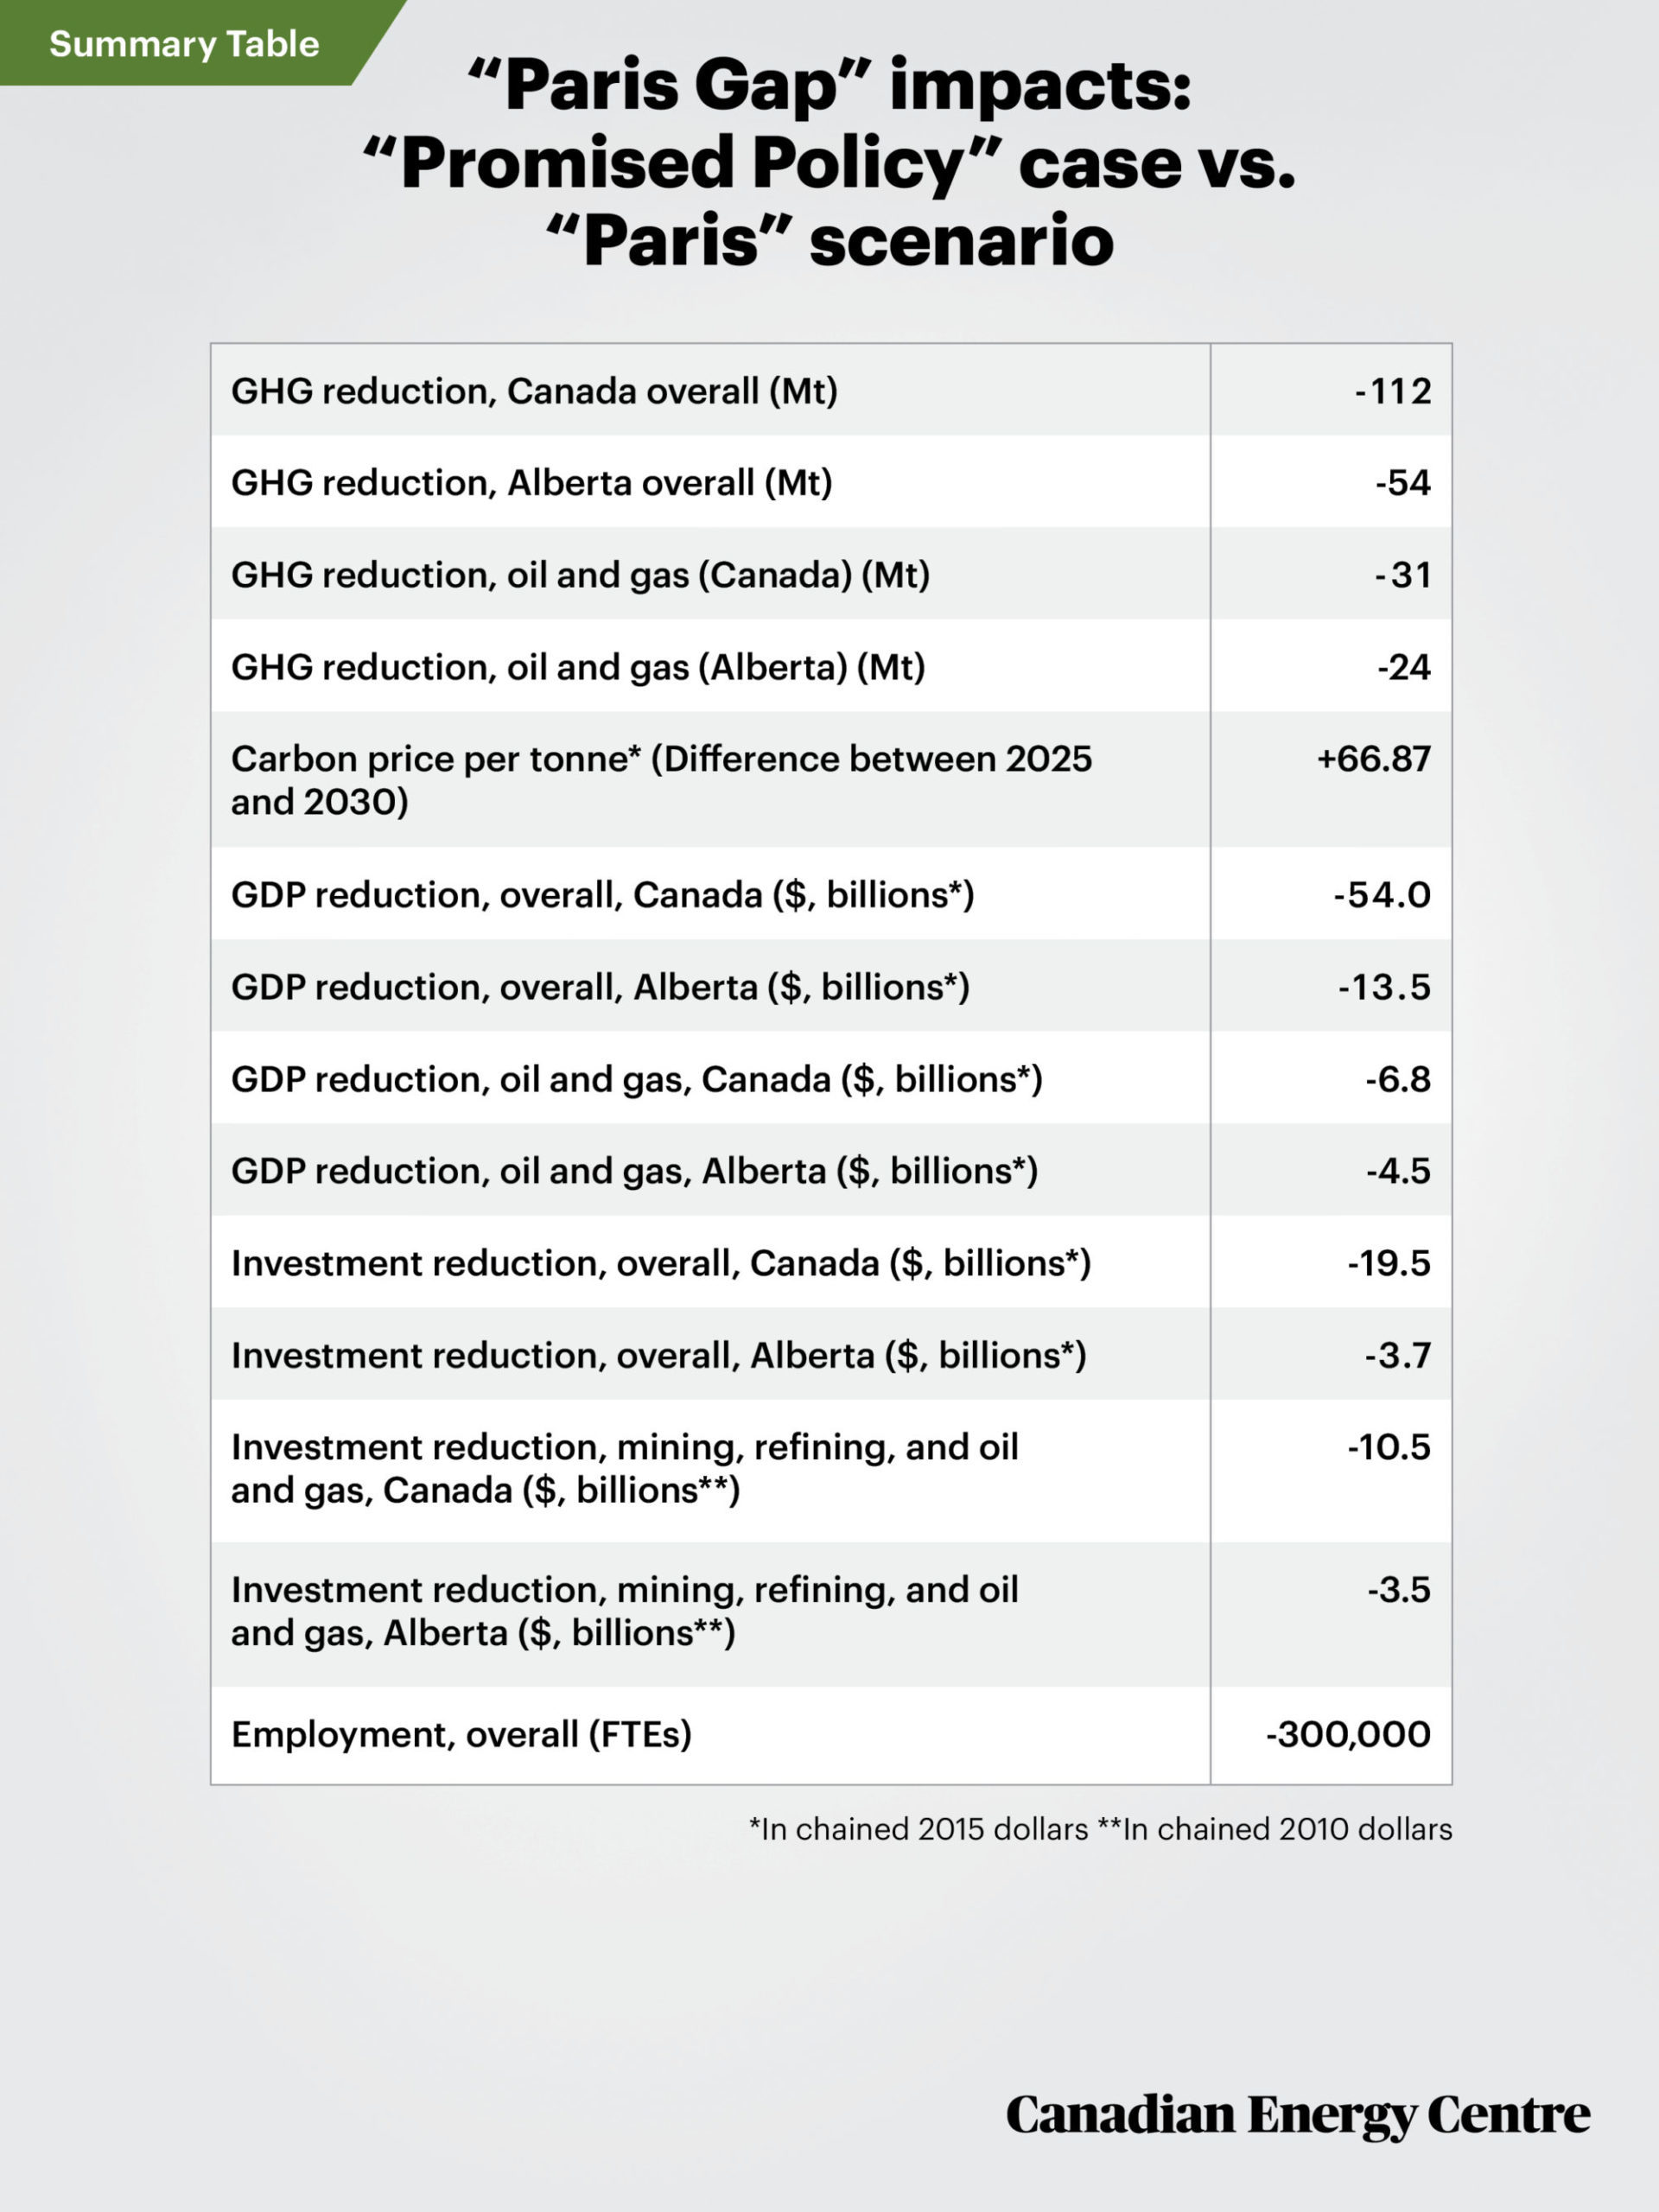
*In chained 2015 dollars **In chained 2010 dollars
Introduction: Paris 2030 and the Gap between Promises and Reality
———————————
Although there has been a great deal of discussion about Canada’s Paris COP 21 pledge to reduce its greenhouse gas emissions at least 30 percent below 2005 levels by 2030, there has been little detailed public analysis of the economic and fiscal impacts on Canada’s oil and gas sector of complying with the Paris agreement.
The Canadian Energy Centre (CEC) asked Navius Research to examine the economic and greenhouse gas impacts on the Canadian oil and gas sector from meeting the Paris target. As part of its engagement with the CEC, the Navius gTech model was used to forecast a “Promised Policy” case, which is based on currently implemented and planned policies that have been announced publicly.
The model also forecasts a “Paris” scenario that looks at Canada’s future if the country achieves its 2030 emission reduction targets — 511 Mt in emissions. It then measures the difference in the greenhouse gas emissions targets and economic impacts on the Canadian oil and gas sector between the “Promised Policy” case and the case where Canada meets the Paris target.³
The “Paris” policy scenario is based on households and businesses receiving a full rebate of the carbon tax. This is only one possible policy path, however. There are other policy paths that could involve diverse levels of rebates to households and businesses, coverage for trade-exposed sectors, as well as regulations and standards on the overall economy and on particular economic sectors that would all have different economic impacts on the overall Canadian economy and the Canadian oil and gas sector.
The “Paris Gap” impacts are conservative estimates; actual impacts and costs could well be higher
The estimated greenhouse gas (GHG) and economic impacts (i.e., on GDP, employment, and investment) are conservative because they assume that the federal government will confine itself to what it considers the most efficient policy option, and that the “Promised Policy” will be fully effective. There is considerable uncertainty that this will occur based on previous policy initiatives in the areas of carbon pricing and revenue recycling, energy efficiency, and renewable energy programs.
3. In contrast to Environment and Climate Change Canada’s (ECCC’s) projected 77 Mt gap, Navius
Research, through its energy-economy model gTech, is capable of conducting a detailed economic
impact analysis of the effect of Canada meeting its Paris target. gTech can examine the impact
of virtually any type of policy, from technology-specific regulations to market-based policies
such as carbon pricing or hybrid flexible regulations. For the purposes of this Research Brief,
Canadian and provincial GDP and labour force growth forecasts are calibrated to the
Parliamentary Budget Office (PBO) Fiscal Sustainability Report, 2020. Historical greenhouse
gas emissions are calibrated to ECCC’s National Inventory Report. Modeled GHG emissions are
calibrated to align with historical trends. gTech’s ability to replicate historical trends
improves confidence in the projections. Global oil and gas prices and production estimates
are derived from Canada Energy Regulator, Canada’s Energy Future 2019. For more information,
see the Technical Appendix at the end of this Research Brief.
Sources: Derived from United Nations (2020); Canada (2015); Canada (2019); Alberta (2017);
and Navius Research (2020).
Part I: Paris 2030 and the Megatonnes Gap
———————————
Canada’s “Paris Gap” is 112 megatonnes
At the Paris COP 21 meeting, Canada pledged to reduce its greenhouse gas emissions by a minimum of 30 percent below the 2005 level of 730 megatonnes (Mt) of CO2 equivalent — a drop to approximately 511 Mt by 2030.
Under current policies and measures that have been announced publicly, i.e., the “Promised Policy” case, Navius estimates that Canada’s greenhouse gas emissions will decrease from 714 Mt in 2015 to 657 Mt in 2030.
The 657 Mt in projected GHG emissions in 2030 does not include what the United Nations calls Land Use, Land Use Change and Forestry (LULUCF), that is, forestry and land-use activities including sustainable forest management and the conservation of natural areas. Under LULUCF, the federal government and various provinces have committed to reducing emissions by 24 Mt by 2030 through various land
management schemes. LULUCF scenarios will have their own assumptions and impacts, which have the potential to
be adverse and significant for investment, the economy, and employment. A further 10 Mt reduction in projected emissions, which is also uncertain, is associated with the Western Climate Initiative (WCI) of which Quebec and Nova Scotia are members, reducing projected base case GHG emissions to 623 Mt in 2030.
Announced policies and measures — “Promised Policy”— are therefore insufficient to achieve Canada’s emissions target by 2030. Canada still faces a 112 Mt greenhouse gas emissions gap relative to the 2030 Paris target (see figure 1).
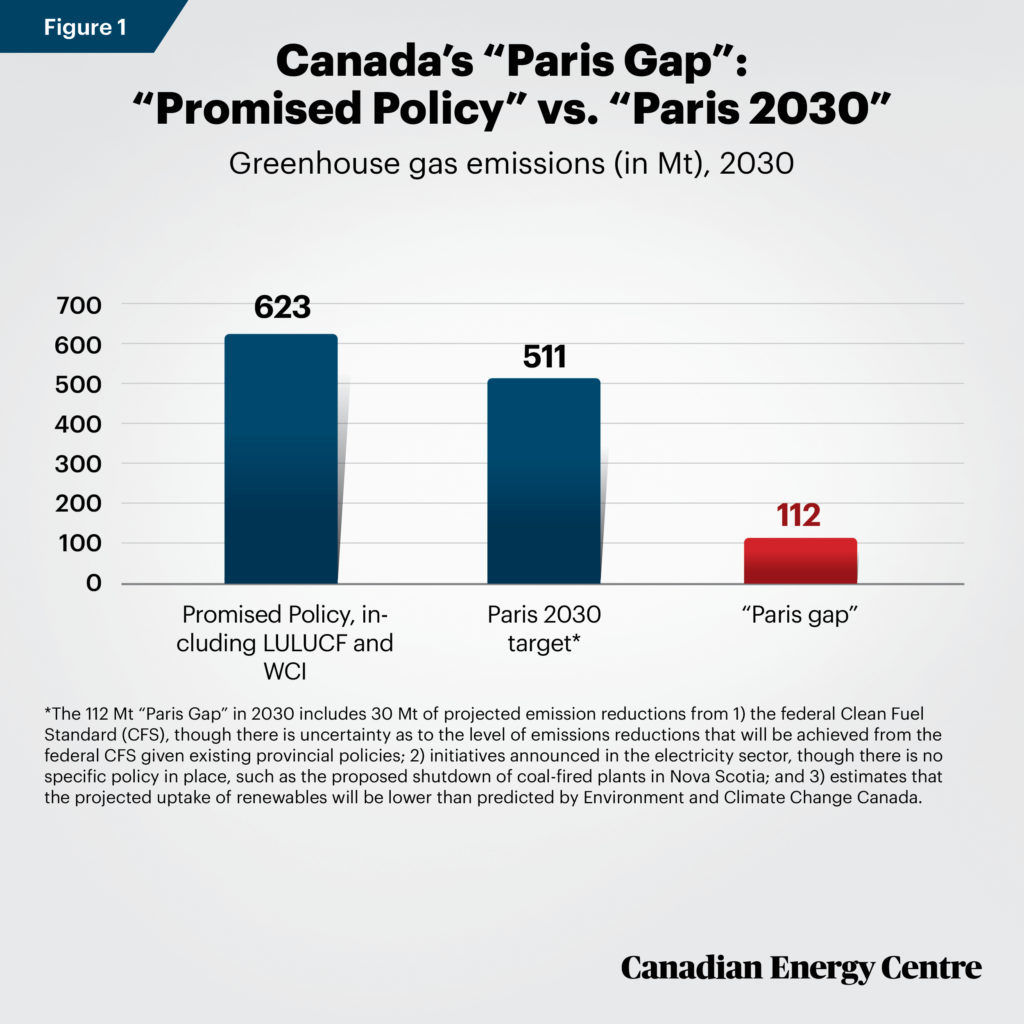
Source: Derived from Navius Research and authors’ calculations.
*The 112 Mt “Paris Gap” in 2030 includes 30 Mt of projected emission reductions from
1) the federal Clean Fuel Standard (CFS), though there is uncertainty as to the level of
emissions reductions that will be achieved from the federal CFS given existing provincial
policies; 2) initiatives announced in the electricity sector, though there is no specific
policy in place, such as the proposed shutdown of coal-fired plants in Nova Scotia; and 3)
estimates that the projected uptake of renewables will be lower than predicted by Environment
and Climate Change Canada.
Nearly half the “Paris Gap,” 54 megatonnes, will fall on Alberta
Nearly half the “Paris Gap” will fall on Alberta’s emissions because the province has the highest absolute emissions in Canada. Under the “Promised Policy” case, greenhouse gas emissions in Alberta are expected to fall from 272 Mt in 2015 to 263 Mt in 2030.
However, after incorporating the “Paris Gap,” Alberta’s emissions will need to fall from 263 Mt under the “Promised Policy” case to 209 Mt in 2030 under the “Paris” scenario, a further reduction of 54 Mt (see figure 2).
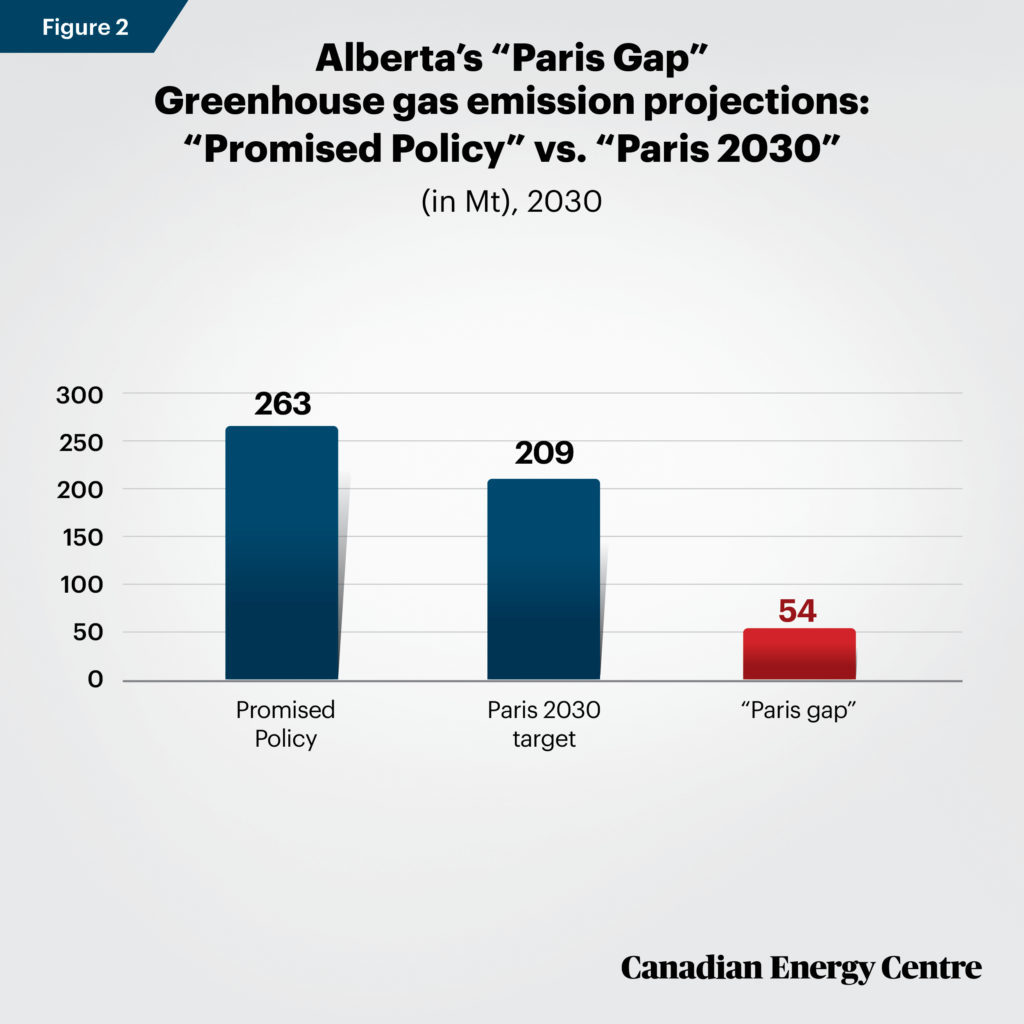
Source: Derived from Navius Research and authors’ calculations.
The oil and gas sector “Paris Gap” is 31 megatonnes, or nearly 28 percent of the total gap.
According to the “Promised Policy” case, Canada’s greenhouse gas emissions from the oil and gas sector are projected to grow from 157 Mt in 2015 to 163 Mt in 2030.
However, this target does not include the oil and gas sector’s additional share from the 112 Mt “Paris Gap.” Bridging the “Paris Gap” would require Canadian oil and gas sector emissions to fall from 163 Mt under the “Promised Policy” case to 132 Mt under the “Paris” scenario, an additional reduction of 31 Mt by 2030 (see figure 3).
By way of comparison, this 31 Mt gap is equivalent to all emissions from Canada’s $58 billion chemicals industry (28 Mt), which employed 92,590 Canadians in 2019 (Chemistry Industry Association of Canada, undated).
Source: Derived from Navius Research and authors’ calculations.
Alberta oil and gas sector “Paris Gap” is 24 megatonnes, over 21 percent of the total gap
Under the “Promised Policy” case, oil and gas sector emissions in Alberta were estimated to grow from 122 Mt in 2015 to 136 Mt in 2030.
To bridge the “Paris Gap,” oil and gas sector emissions in Alberta would need to fall from 136 Mt under the “Promised Policy” case to 112 Mt by 2030 under the Paris scenario, a reduction of an additional 24 Mt (see figure 4).
• Achieving this level of greenhouse gas reduction (24 Mt in 2030) would be equivalent to all the emissions in Alberta’s agriculture sector (20 Mt of emissions in 2020), and then some. In 2019, primary agriculture in Alberta contributed $5.2 billion to the province’s GDP and generated $13.5 billion in total farm cash receipts, representing over 20 percent of total Canadian farm cash receipts. The sector also employed about 49,300 Albertans (Alberta, 2020a).
Source: Derived from Navius Research and authors’ calculations.
Part II: Paris 2030 and Investment Impacts
———————————
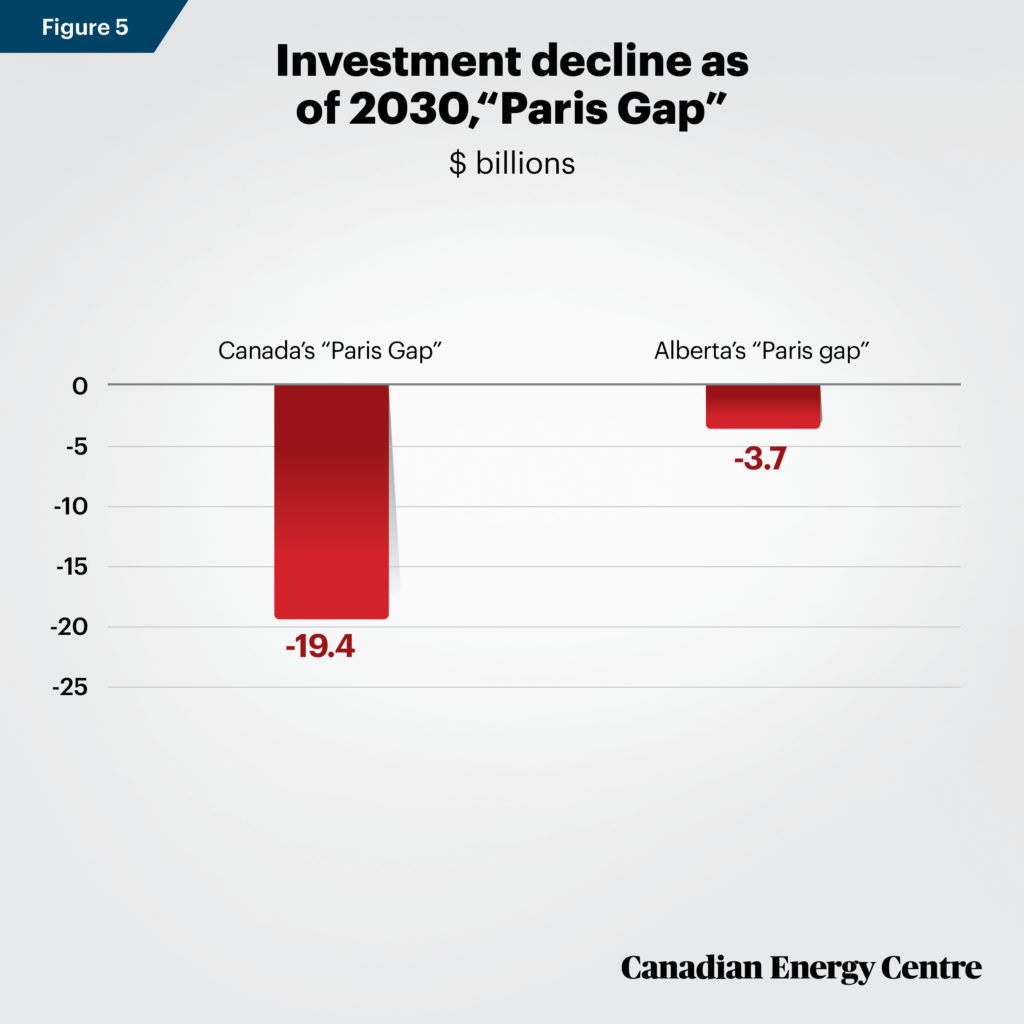
Investment impacts for Canada and Alberta: a drop of $19.4 billion and $3.7 billion⁴, respectively
Total real investment in Canada in 2030 will be $375.1 billion under the “Promised Policy” case, while under the “Paris” scenario it will be about $355.7 billion in 2030.
• Thus, bridging the “Paris Gap” will mean real investment in Canada in 2030 is about $19.4 billion, or 5.2 percent less than its expected level under the “Promised Policy” scenario.
• Total real investment in Alberta in 2030 will be $95 billion under the “Promised Policy” case, whereas under the “Paris” scenario it will be about $91.3 billion.
• Thus, bridging the “Paris Gap” will cut real investment in Alberta in 2030 by $3.7 billion, or 3.9 percent from its anticipated level under the “Promised Policy” scenario (figure 5).
Source: Derived from Navius Research and authors’ calculations.
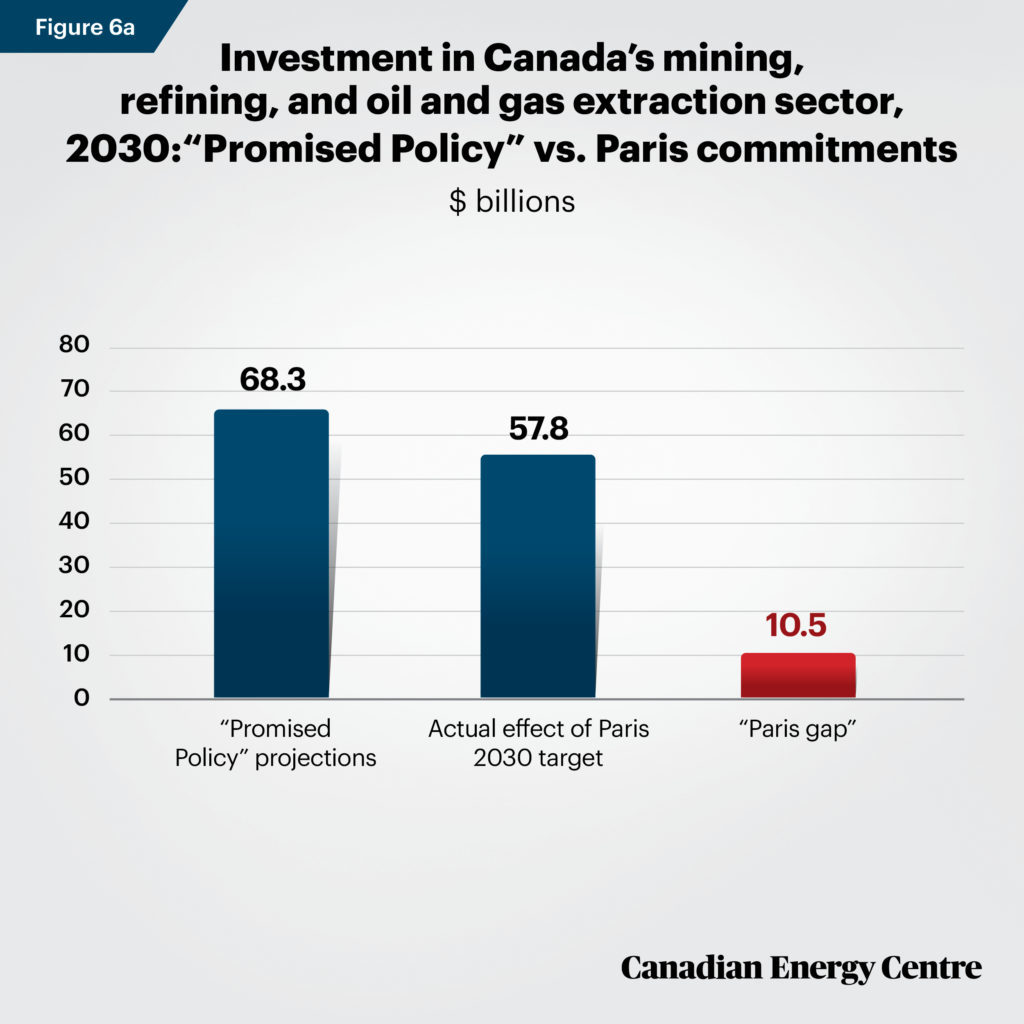
Investment impacts for the oil and gas sector in Canada and Alberta: $10.5 billion and $3.5 billion less, respectively
Real investment⁵ in the mining, refining, and oil extraction sector in Canada will be $68.3 billion in 2030 in the “Promised Policy” case versus $57.8 billion under the “Paris” scenario, a gap of $10.5 billion or 15.4 percent (figure 6a).
• This level of investment decline is equivalent to the total planned capital expenditures in Canada’s construction industry in 2020 ($8.1 billion) (Statistics Canada, undated a).
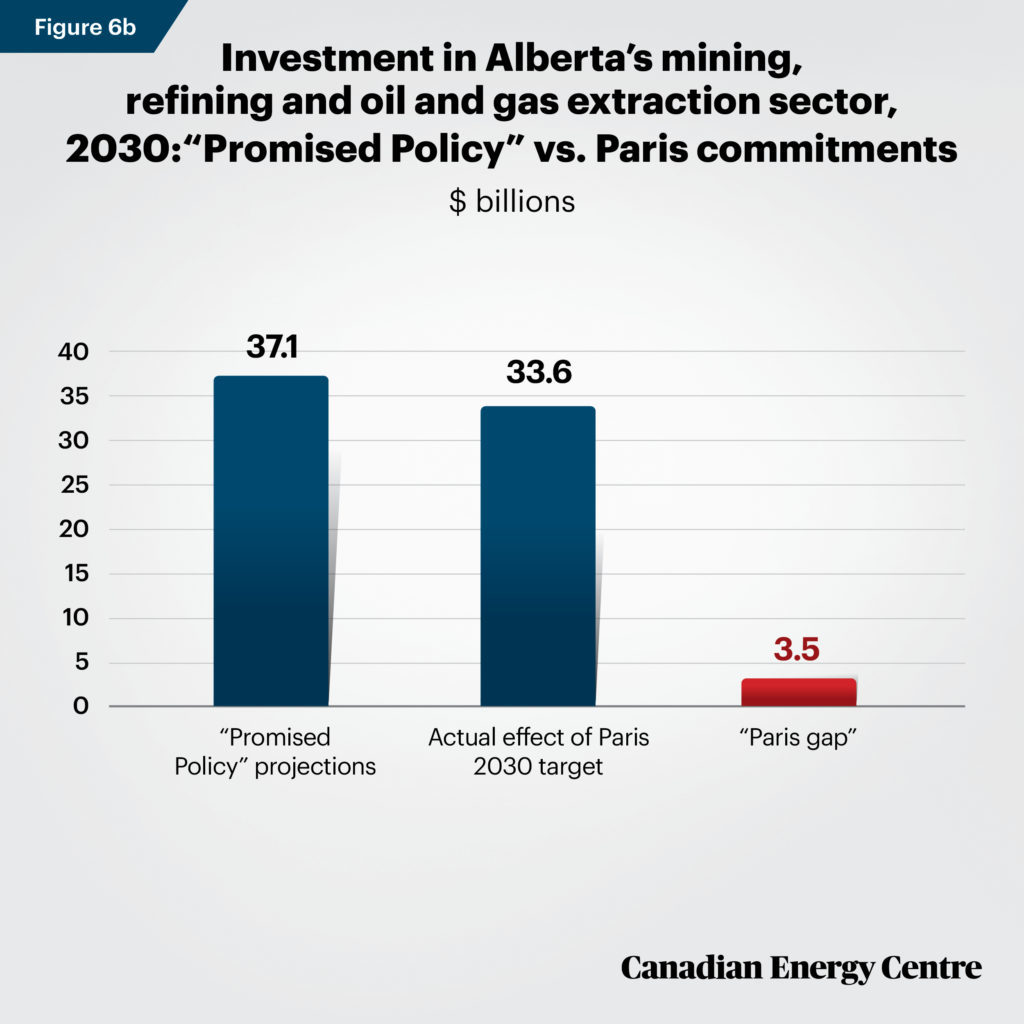
Real investment in the mining, refining and oil extraction sector in Alberta in 2030 will be $37.1 billion in the “Promised Policy” case versus $33.6 billion under the “Paris” scenario, a gap of $3.5 billion⁶ or 9.4 percent (figure 6b).
• The $3.5 billion investment decline in 2030 (Alberta) is equivalent to the total planned capital expenditures in Ontario’s transportation equipment manufacturing sector in 2020 ($2.3 billion in 2020) (Statistics Canada, undated a).
4. In chained 2015 dollars.
5. In billions of 2010 dollars.
6. In billions of 2010 dollars.
Source: Derived from Navius Research and authors’ calculations.
Source: Derived from Navius Research and authors’ calculations.
Part III: Paris 2030 and Other Economic and Carbon Price Impacts
———————————
The impacts on the Canadian economy of meeting the Paris target are significant. As noted earlier, based on all currently implemented policies and planned policies that have been announced publicly, as well as the Land Use, Land Use Change and Forestry (LULUCF) and Western Climate Initiative (WCI) contributions, under the “Promised Policy” case, Canada will still fall 112 Mt short of reaching its Paris target in 2030.
Below, we explore the GDP impacts on the overall Canadian economy and the oil and gas sector between the “Promised Policy” and the situation were we to meet the Paris target.
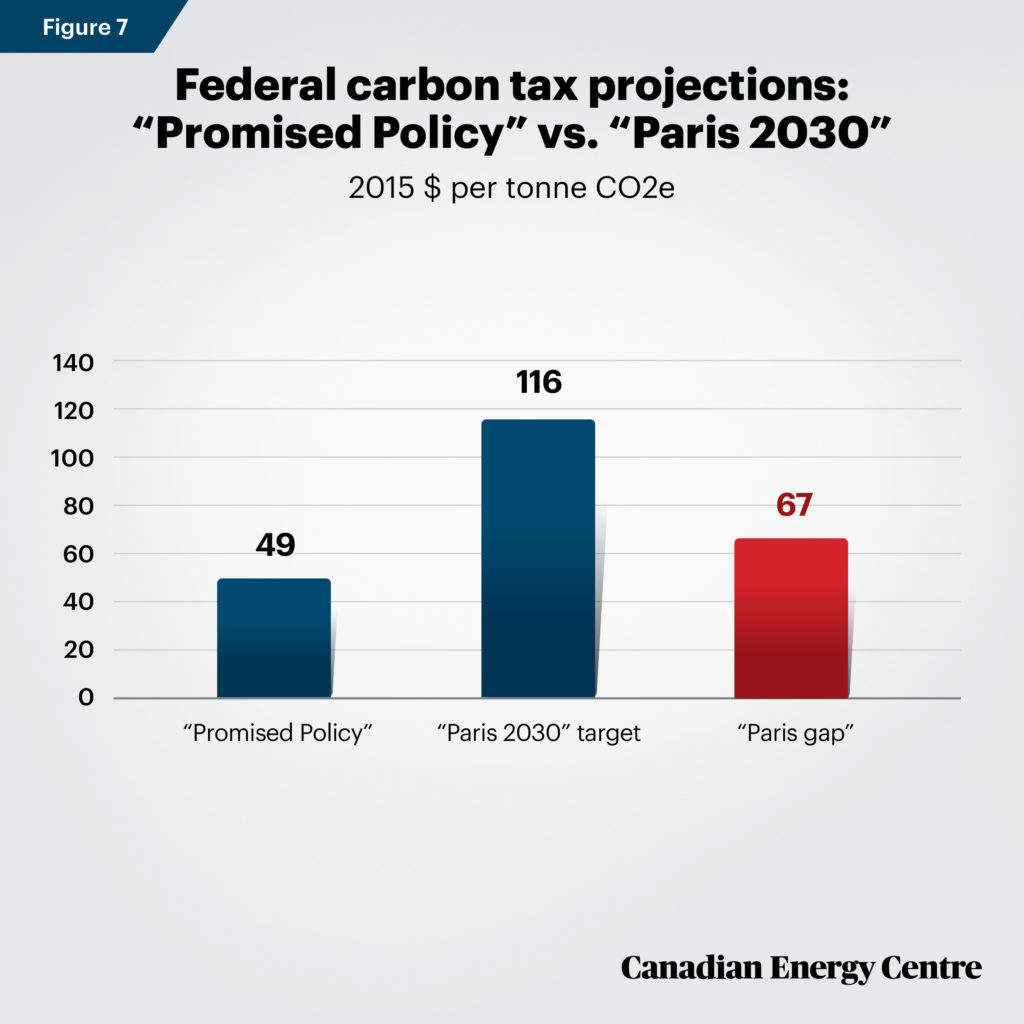
Carbon taxes could more than double
In the absence of any additional policy measures, the federal carbon tax would need to increase from $49.15⁷ per tonne in
2025 under the “Promised Policy” case to $116.02 per tonne by 2030 for Canada to meet its Paris commitment.
This carbon tax trajectory does not include the existing output-based pricing system for industrial emitters. It assumes instead that the carbon tax would cover almost all sectors of the economy. Heavy emitters currently pay only a portion of the carbon tax imposed on industrial emissions to try and ensure that trade-exposed sectors can maintain their competitiveness. Were Canada to leave that system in place, the carbon tax on the rest of the economy would have to be higher than $116.02 per tonne in 2030.
Source: Derived from Navius Research and authors’ calculations.
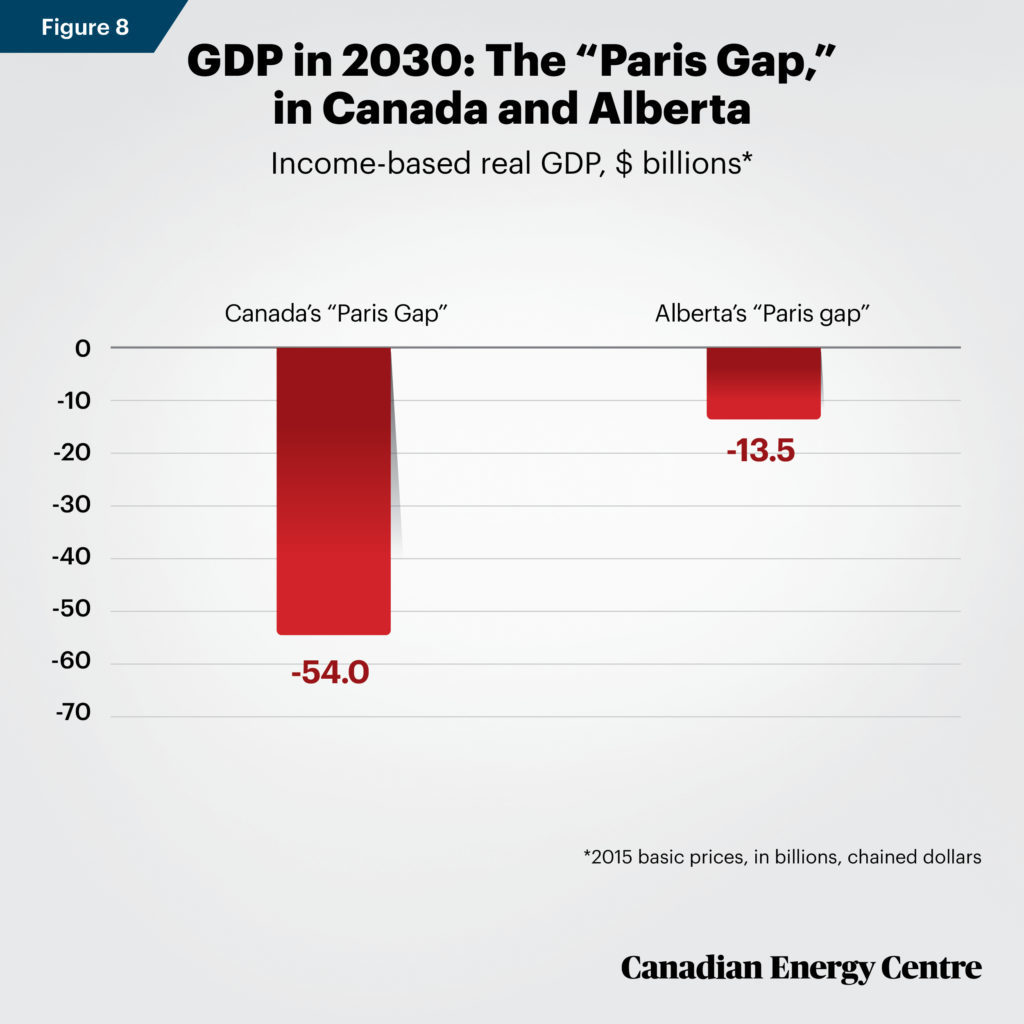
GDP $54.0 billion less in Canada and $13.5 billion less in Alberta⁸
Under the “Promised Policy” case, real GDP in Canada in 2030 will be $2.446 trillion⁹, while under the “Paris” scenario it will be about $2.392 trillion. Real Canadian GDP due to Paris 2030 will thus be about $54.0 billion or 2.2 percent lower vis-à-vis the “Promised Policy” case (figure 8).
• Under the “Promised Policy” case, real GDP in Alberta will be $428.5 billion in 2030, while under the “Paris” scenario it will be about $415 billion. Real Alberta GDP due to Paris 2030 will thus be about $13.5 billion or 3.2 percent lower “Promised Policy” case (figure 8).
7. In chained 2012 dollars.
8. In chained 2015 dollars.
9. In chained 2012 dollars.
Source: Derived from Navius Research and authors’ calculations.
*2015 basic prices, in billions, chained dollars
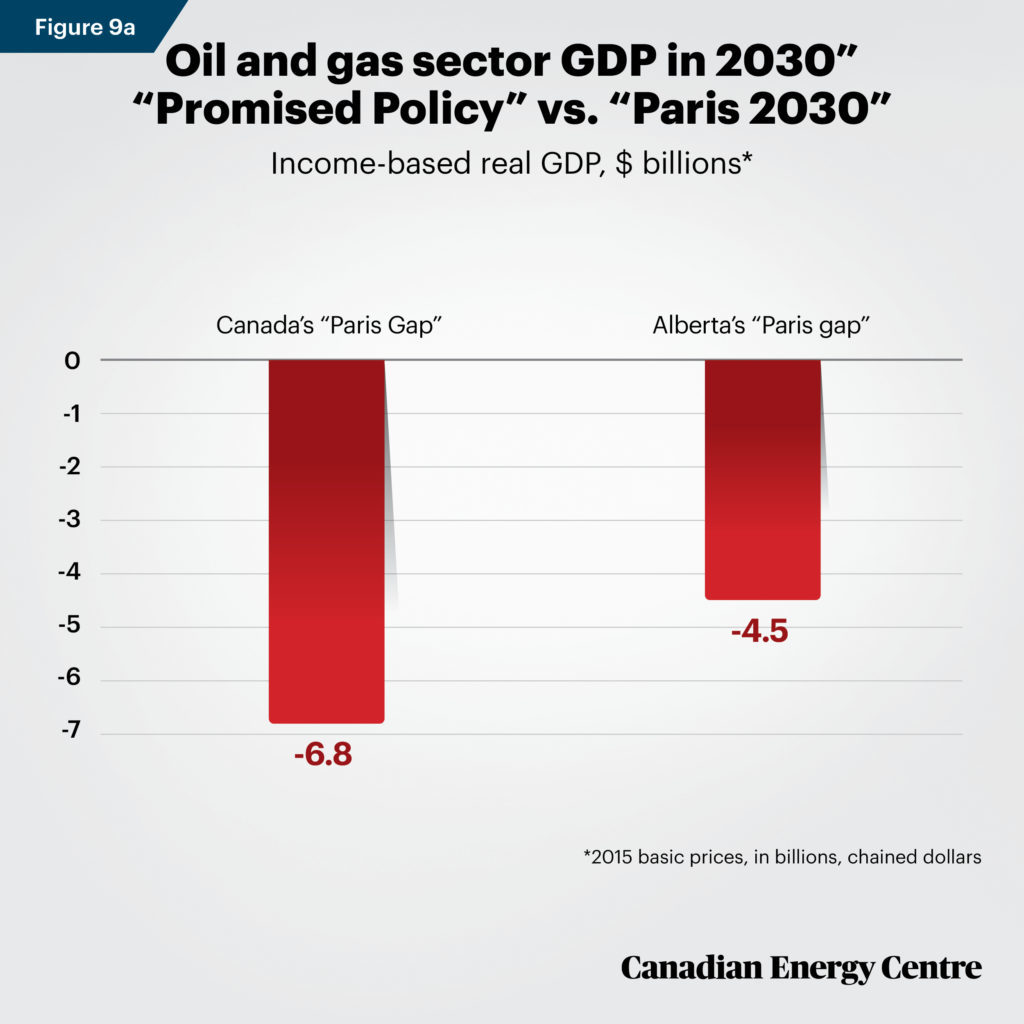
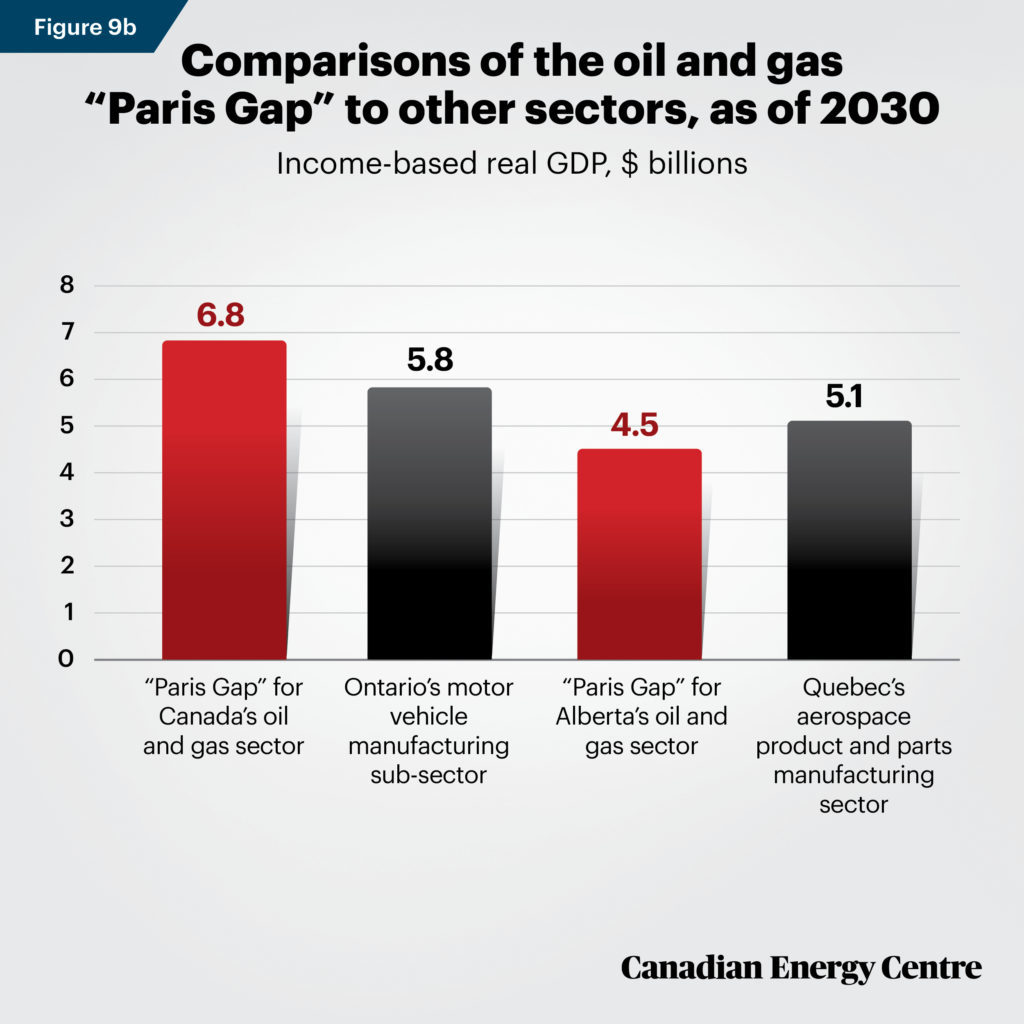
Oil and gas industry GDP: A $6.8 billion reduction across Canada, $4.5 billion of it in Alberta
• Under the “Promised Policy” case, real GDP¹⁰ for the Canadian oil and gas sector in 2030 will be $87.1 billion, while under the “Paris” scenario it will be about $80.3 billion. In 2030, real Canadian oil and gas sector GDP will thus be about $6.8 billion, or 7.8 percent less relative to the “Promised Policy” case. (Figure 9a)
This $6.6 billion GDP gap in 2030 is equivalent to Ontario’s motor vehicle manufacturing sub-sector (nearly $5.8 billion GDP in 2019)¹¹ which employed 37,658 Ontarians that year (Statistics Canada, undated b and undated c).
• Under the “Promised Policy” case, real GDP for Alberta’s oil and gas sector in 2030 will be $64 billion, while under the “Paris” scenario it will be about $59.5 billion. Real Alberta oil and gas sector GDP in 2030 will thus be about $4.5 billion, or seven percent less, vis-à-vis the “Promised Policy” case (figure 9a).
This $4.5 billion GDP gap in 2030 is nearly equivalent to the size of Quebec’s aerospace product and parts manufacturing sector (over $5.1 billion GDP in 2019¹²) which employed 28,722 Quebecers that year (figure 9b) (Statistics Canada, undated b and undated c).
10. In chained 2015 dollars.
11. In chained 2012 dollars.
12. In chained 2012 dollars
Source: Derived from Navius Research and authors’ calculations.
*2015 basic prices, in billions, chained dollars.
Source: Derived from Navius Research and authors’ calculations.
Part IV: Paris 2030 and Job Impacts
———————————
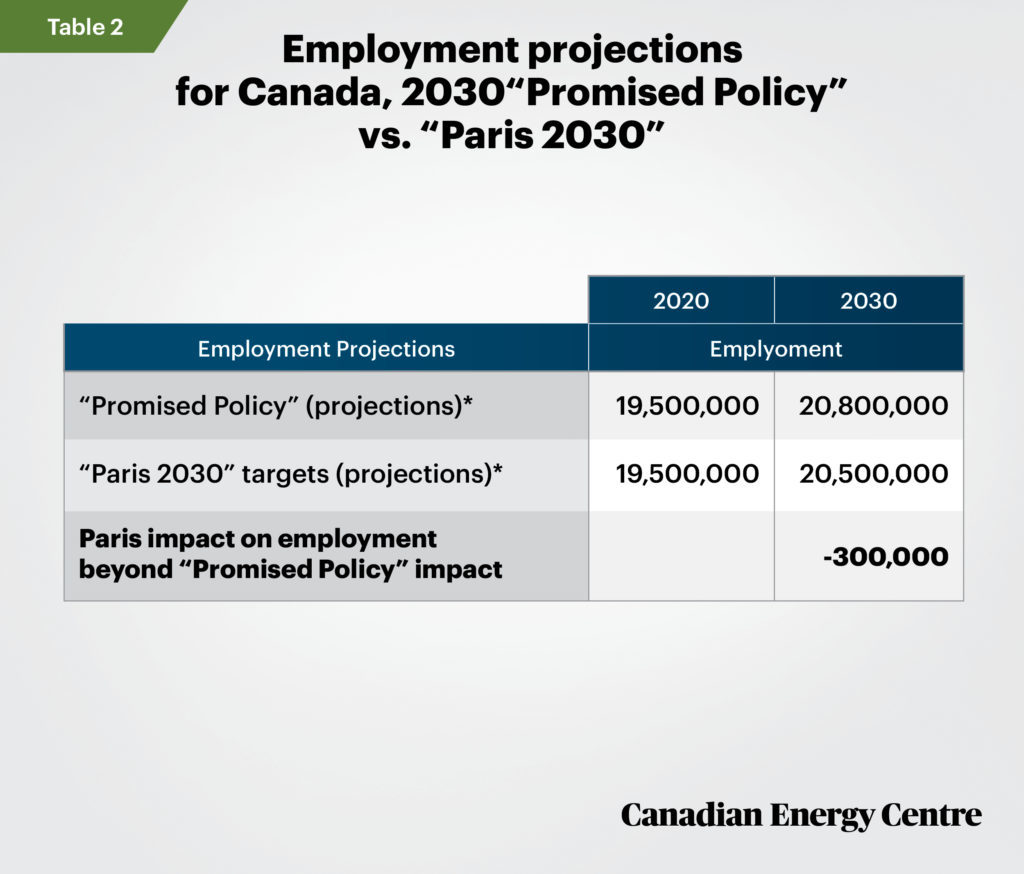
Employment impacts: 300,000 fewer jobs in 2030
There will be 20.8 million full-time equivalent (FTE) jobs in Canada in 2030 under the “Promised Policy” case compared with 20.5 million FTE jobs under the “Paris” scenario, or 300,000 fewer jobs.
The estimated 300,000 job losses are revealed when comparing “Promised Policy” case scenario, that is, announced policies, with the policies that are actually needed to achieve the Paris targets for greenhouse gas emission reductions.
Source: Derived from Navius Research and authors’ calculations.
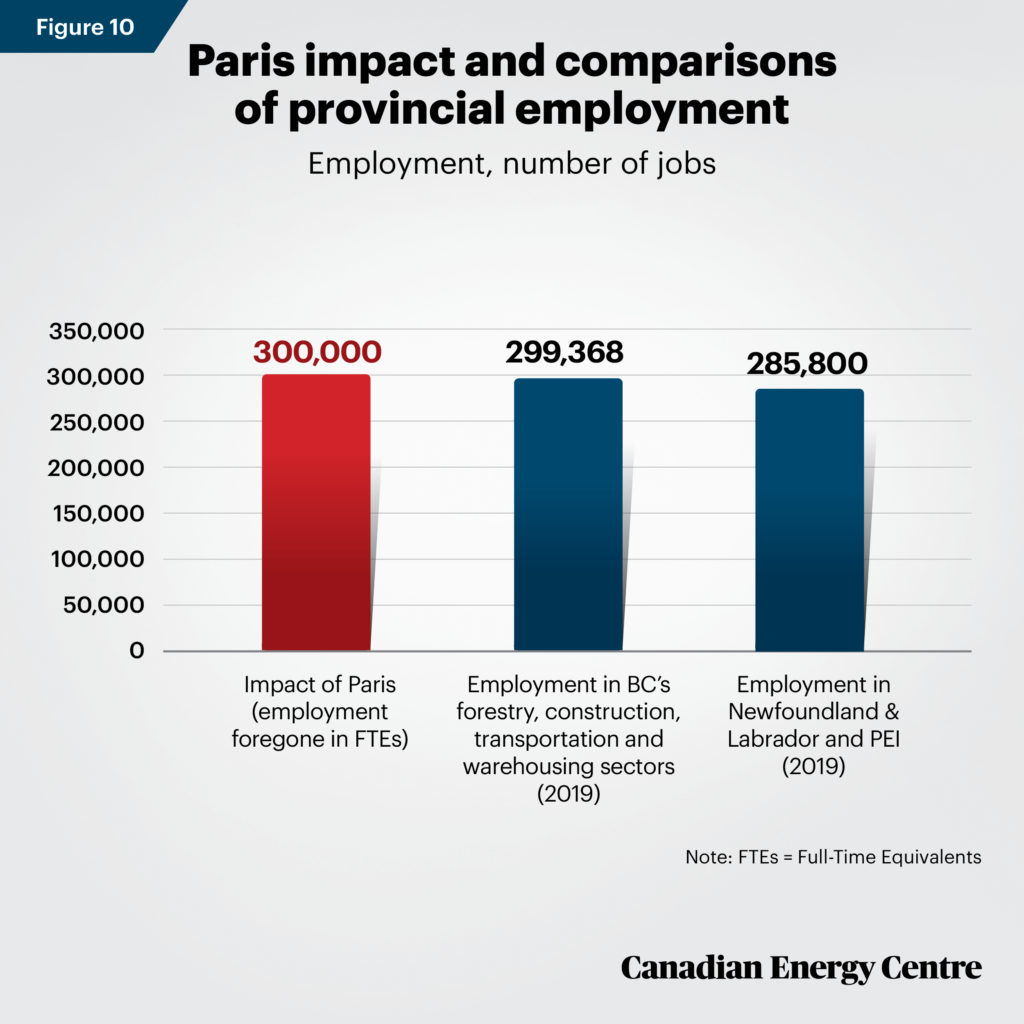
Jobs foregone akin to eliminating all the jobs in BC’s forestry, construction, transportation, and warehousing sectors combined
To conceptualize the scope of the foregone jobs, consider two examples as comparisons, one from British Columbia and one
from Atlantic Canada. The overall employment sacrificed is equivalent to:
• Eliminating British Columbia’s forestry sector (16,653 jobs), construction sector (166,426 jobs), and transportation and warehousing sector (116,289 jobs) in 2019, or 299,368 jobs in total (Statistics Canada, undated c).
• More than the total number of people employed in Newfoundland & Labrador (216,485) and PEI (69,315) in 2019, or 285,500 jobs in total (figure 10) (Statistics Canada, undated c).
Source: Derived from Navius Research and authors’ calculations and Statistics Canada, Table
14-10-0202-01.
Note: FTEs = Full-Time Equivalents
Conclusion: The Paris Gap
———————————
Achieving the Paris greenhouse gas emissions target by 2030 will come at a significant cost to the Canadian economy and the Canadian oil and gas sector in particular.
It is important that governments in Canada and the provinces make these impacts clear to Canadians.
We have found that, based on all currently publicly announced implemented and planned policies, under the “Promised Policy” case, Canada will fall 112 Mt short of reaching its Paris target in 2030. This estimate takes into account uncertainties about the emissions reduction impacts of the federal clean fuel standard, the coal phase-out in the electricity sector, and the uptake of renewable energy sources.
In the absence of any additional policy measures, for Canada to meet its COP 21 commitment, the federal carbon tax would need to increase from $49.15 per tonne (in 2015$) in 2025 to $116.02 per tonne (in 2015$) by 2030 under the “Paris” scenario.
The “Paris” scenario also shows a negative gap in GDP and investment in the Canadian oil and gas sector in 2030 when compared to the “Promised Policy” case, along with 300,000 jobs sacrificed in the Canadian economy as a whole.
Technical Appendix: The Navius gTech Model and This Report’s Policy Approach
———————————
The Navius gTech model is the most comprehensive model available for forecasting the greenhouse gas and economic impacts of climate policy in Canada. Its inclusion of technological change, macroeconomic dynamics, and fuels markets mean that it is ideally positioned to forecast how the broad range of policies implemented in Canada will affect energy consumption, greenhouse gas emissions, the economy, and a large array of other indicators, such as GDP, industrial competitiveness, and household welfare. This contrasts with other models, which include either an explicit technology focus or a simulation of full economic impacts, but not both.
Governments can use various policy approaches to reduce greenhouse gas emissions including carbon pricing, economywide regulations, and industry-focused regulations, or a combination thereof. gTech provides a detailed accounting of the types of energy-related technologies available to households and businesses to reduce emissions. In total, gTech includes 200 technologies across more than 50 end uses.
This Research Brief focuses on the use of carbon pricing as the government’s prime policy approach for reducing emissions. We apply an economy-wide carbon price, through the use of a carbon tax or cap-and-trade system, across all major sources of greenhouse gas emissions in Canada. Carbon price revenue is returned to households in lump-sum payments via dividend cheques. The use of carbon pricing provides a lower bound, conservative approach to assessing the impact of meeting Canada’s Paris commitment. Other policies, such as sectoral specific regulations, for example, could have higher economic costs.
The federal and provincial governments have implemented numerous policies designed to encourage or require businesses and consumers to reduce their greenhouse gas emissions. Table 2.3.8 of Canada’s Fourth Biennial Report on Climate Change to the UNFCCC outlines these policies in detail. They include such measures as carbon pricing, federal and provincial clean fuel standards (CFS), energy efficiency regulations, renewable fuels regulations, and renewable energy portfolios, among many others. For the purposes of this Research Brief, these are classified as “Promised Policy”
Current emissions in Canada remain at same level as 2005 despite policy initiatives
It appears that the climate change policies implemented to date have not significantly reduced Canada’s greenhouse gas emissions.
• In 2005, Canada’s greenhouse gas emissions were 730 Mt. They fell to 691 Mt in 2010, before rising again to 721 Mt by 2014.
• With the drop in oil prices in 2014, emissions fell further to 706 Mt in 2016, but increased again to 714 Mt in 2017 and to 729 Mt in 2018, the latest year for which actual emissions are available (Canada, 2020).
In effect, by 2018, Canada’s emissions have nearly returned to 2005 levels, despite various climate change policies that the federal government and the provinces enacted. Canada’s emissions trends over the past 15 years illustrate the difficulty of permanently reducing emissions and foreshadow the significant impact trying to do so will have on our energybased economy. This is an important issue to highlight to Canadians.
Clearly, the “Promised Policy” scenario will not meet Canada’s Paris commitment to reduce its greenhouse gas emissions to 511 megatonnes by 2030. The approach taken in this Research Brief is to quantify the “Paris Gap” based on the best available information, and to use the capabilities of the Navius gTech model to simulate the economic impacts on the Canadian and Alberta economies, and in particular Canada’s oil and gas sector, of bridging the “Paris Gap” through an implicit price on carbon imposed on business and households.
Using gTech provides insight about how an economy-wide carbon price affects the national and regional economies and regional sectors and sectors at large. gTech accounts for all economic activity in Canada as measured by StatisticsCanada’s national accounts. It forecasts how government policies affect many different economic indicators, including gross domestic product, investment, employment, and household income. The gTech model also simulates the economies of each of the Canadian provinces and more than 80 sectors of the economy.
Estimating energy prices, crude oil and natural gas prices, and GHG reference case emissions out through 2030 is inherently uncertain. The COVID-19 lockdown is a recent example of how world events can disrupt even the most rigorously developed forecasts.
For the purposes of this Research Brief, Canadian and provincial GDP and labour force growth forecasts are calibrated to the Parliamentary Budget Office (2020) Fiscal Sustainability Report, 2020. Historical greenhouse gas emissions are calibrated to Environment and Climate Change Canada’s National Inventory Report (ECCC 2020). Global oil and gas prices and production estimates are derived from Canada Energy Regulator (2019). Modeled GHG emissions for future years are calibrated to align with historical trends.
References
———————————
Alberta (2017). Climate Leadership Plan: Progress Report 2016-17. Government of Alberta <https://bit.ly/2z3Kz5r>.
Alberta (2020a). Agriculture Sector. Government of Alberta <https://bit.ly/2Np4CyN>.
Alberta (2020b). Budget 2020. Government of Alberta <https://bit.ly/2Z6UXCE>.
Canada (2015). Canada’s Second Biennial Report on Climate Change. Government of Canada <https://bit.ly/2Ua5KdD>.
Canada (2019). Canada’s Fourth Biennial Report on Climate Change. Government of Canada <https://bit.ly/2NwWHj7>.
Canada Energy Regulator (2019). Canada’s Energy Future 2019. Government of Canada <https://bit.ly/2A2oMM8>.
Chemistry Industry Association of Canada [CIAC] (undated). About the Chemistry Industry. CIAC <https://bit.ly/2XvHvs8>.
Environment and Climate Change Canada (2020). Greenhouse Gas Sources and Sinks: Executive Summary 2020. Government of Canada <https://bit.ly/2CB1lKH>.
Navius Research (2020), Custom modeling for the Canadian Energy Centre(May 2020).
Parliamentary Budget Office [PBO] (2019). Closing the Gap: Carbon Pricing for the Paris Target (Revised June 20, 2019). PBO <https://bit.ly/3h0mEoT>.
Parliamentary Budget Office [PBO] (2020). Fiscal Sustainability Report 2020. PBO <https://bit.ly/2Vfb146>.
Statistics Canada (undated a). Table 34-10-0035-01: Capital and Repair Expenditures, Non-residential Tangible Assets, by Industry and Geography. Statistics Canada <https://bit.ly/3eTEEiu>.
Statistics Canada (undated b). Table 36-10-0434-03: Gross Domestic Product (GDP) at Basic Prices, by Industry, Annual Average (x 1,000,000). Statistics Canada <https://bit.ly/2AEjfLG>.
Statistics Canada (undated c). Table 14-10-0202-01: Employment by Industry, Annual. Statistics Canada <https://bit.ly/3czMRqO>.
United Nations [UN] (2020). What Is the United Nations Framework Convention on Climate Change? UN <https://bit.ly/2XFbyhl>.
——————————————————————
About the Canadian Energy Centre
The Canadian Energy Centre’s mandate is to promote Canada as the supplier of choice for the world’s growing demand for responsibly produced energy. It is an independent provincial corporation that is primarily supported by the Government of Alberta’s industry-funded Technology, Innovation and Emissions Reduction (TIER) fund. www.canadianenergycentre.ca.
CEC Research Briefs
Canadian Energy Centre (CEC) Research Briefs are contextual explanations of data as they relate to Canadian energy. They are statistical analyses released periodically to provide context on energy issues for investors, policymakers, and the public. The source of profiled data depends on the specific issue, necessary context, and each brief.
About the authors
This CEC Research Brief was compiled by Lennie Kaplan, Chief Research Analyst at the Canadian Energy Centre and Mark Milke, Executive Director of Research for the Canadian Energy Centre. The data and assumptions are taken from Navius Research gTech modelling. gTEch is one of the most comprehensive models available for forecasting the impacts of climate policy in Canada on greenhouse gas emissions and the economy.
Acknowledgements
The authors and the Canadian Energy Centre would like to thank and acknowledge the assistance of Navius Research Inc., Dr. Ross McKitrick, and an anonymous reviewer.
Creative Commons Copyright
Research and data from the Canadian Energy Centre (CEC) is available for public usage under creative commons copyright terms with attribution to the CEC. Attribution and specific restrictions on usage including non-commercial use only and no changes to material should follow guidelines enunciated by Creative Commons here: Attribution-NonCommercial-NoDerivs CC BY-NC-ND.