Social
To sign up to receive the latest Canadian Energy Centre research to your inbox email: research@canadianenergycentre.ca
Download the PDF here
Download the charts here
Overview
There has been considerable discussion about Canadian upstream oil and gas CO2 emissions intensity but little attempt to benchmark intensity versus other peer oil and as producing countries. This is a crucial element towards evaluating the Canadian upstream oil and gas sector emissions intensity performance.
In this CEC Fact Sheet, we use custom data obtained from the Rystad Energy EmissionsCube to compare the average CO2 emissions intensity of the Canadian upstream oil and gas industry versus 29 other peer countries between 2010 and 2020.
The views expressed in this Fact Sheet do not represent those of Rystad Energy.
Background on the Rystad Energy EmissionsCube
Rystad Energy is an independent energy research company providing data, analytics, and consultancy services to clients around the globe.
Rystad’s EmissionsCube enables the study of CO2 emissions from upstream activity down to the asset level. Through the EmissionsCube, countries, companies, assets, basins and fields can be benchmarked when it comes to upstream emissions and emissions intensity.
Benchmarking CO2 emissions intensity
Upstream activities include exploration, drilling, and extraction. Upstream oil and gas CO2 emissions are defined as those originating from oil and gas combustion, which includes both extraction and flaring emissions.
CO2 emissions intensity is defined in this Fact Sheet as the amount of CO2 emitted (expressed in kilograms) per barrel of oil equivalent (boe) produced (i.e., kg CO2 per boe produced). A declining CO2 emission intensity figure means that less CO2 is being created per boe produced.
Focusing on emissions per boe produced is a realistic means of establishing a meaningful target for the upstream oil and gas industry in Canada. And benchmarking emissions intensity of the Canadian upstream oil and gas sector versus peer countries is a valuable tool for valuating and comparing performance over time.
Canadian average upstream oil and gas (including oil sands) CO2 emissions intensity remains steady over the past decade
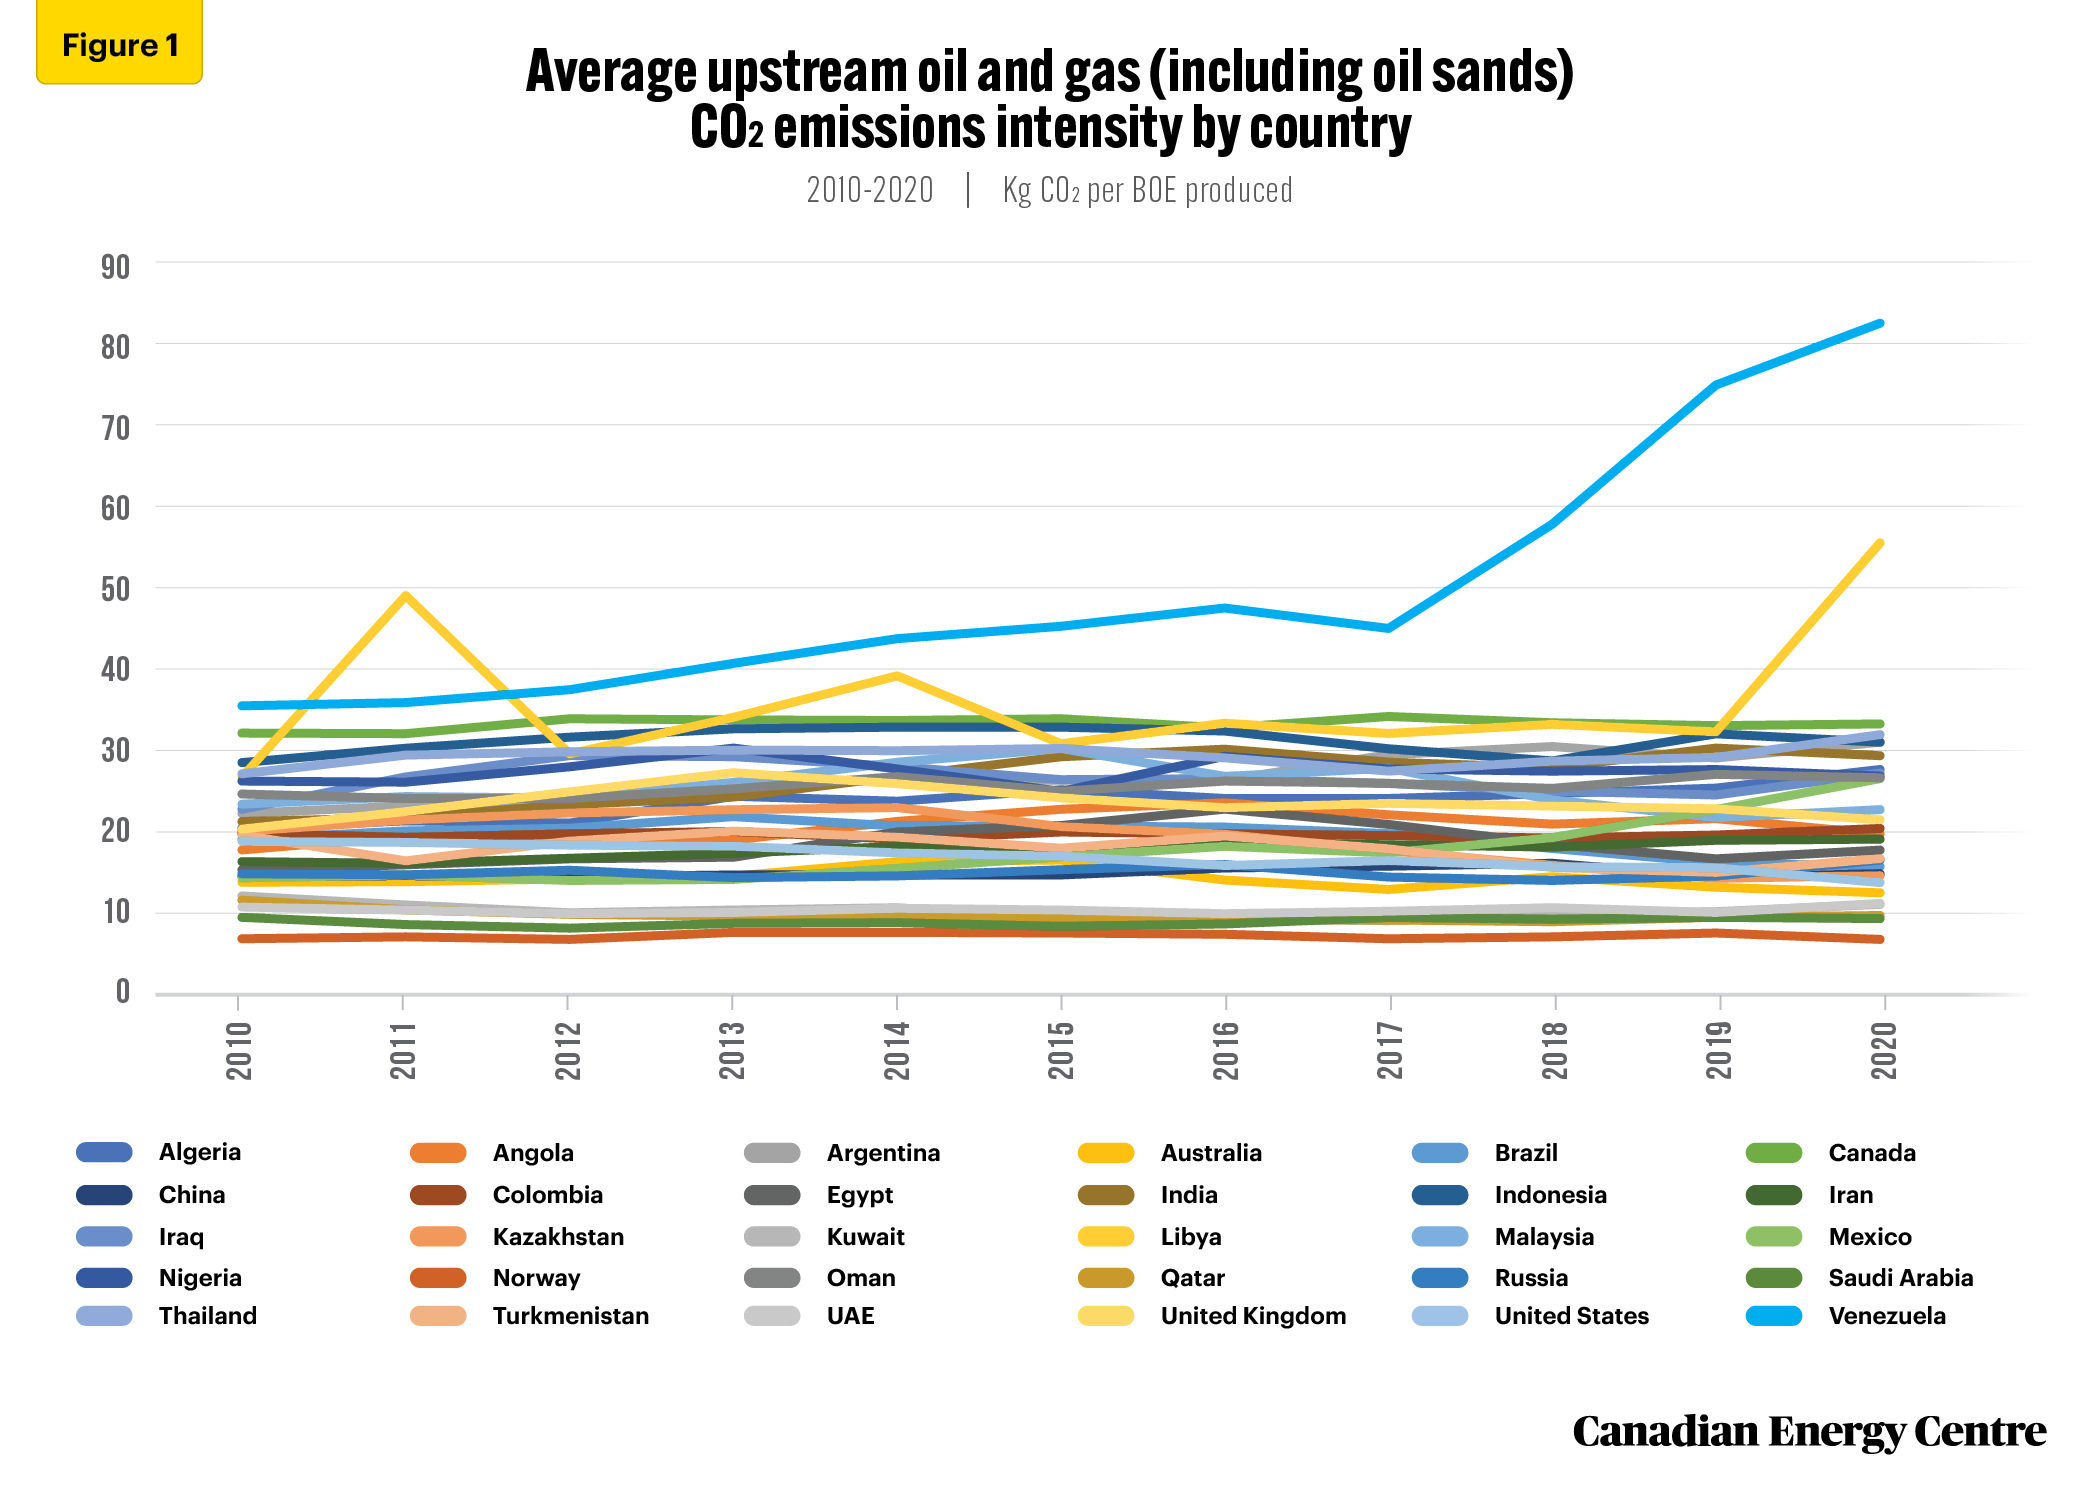
Among the 30 major oil and gas producing countries examined, in 2020, the Canadian upstream oil and gas sector recorded a CO2 emissions intensity of 33 kg per boe produced.
Canada was closely followed by Thailand (32 kg per boe produced), Indonesia (31 kg per boe produced), Argentina (31 kg per boe produced), India (29 kg per boe produced), Algeria (28 kg per boe produced), Nigeria (27 kg per boe produced), Iraq (27 kg per boe produced), Oman (27 kg per boe produced), and Mexico (27 kg per boe produced). Meanwhile, Australia had an emissions intensity of 13 kg per boe produced, while the United States was at 14 kg per boe produced, both lower than Canada (see Figure 1).
Canada’s high CO2 emissions intensity among its peers is the result of a significant share of its upstream oil and gas production (an estimated 35 per cent in 2020) coming from the energy-intensive oil sands sector. Canada’s oil and gas production, with its high oil sands content, is therefore unique among peer countries. As we shall see, Canada’s oil sands sector has made considerable progress in reducing its CO2 emissions intensity over the past decade.
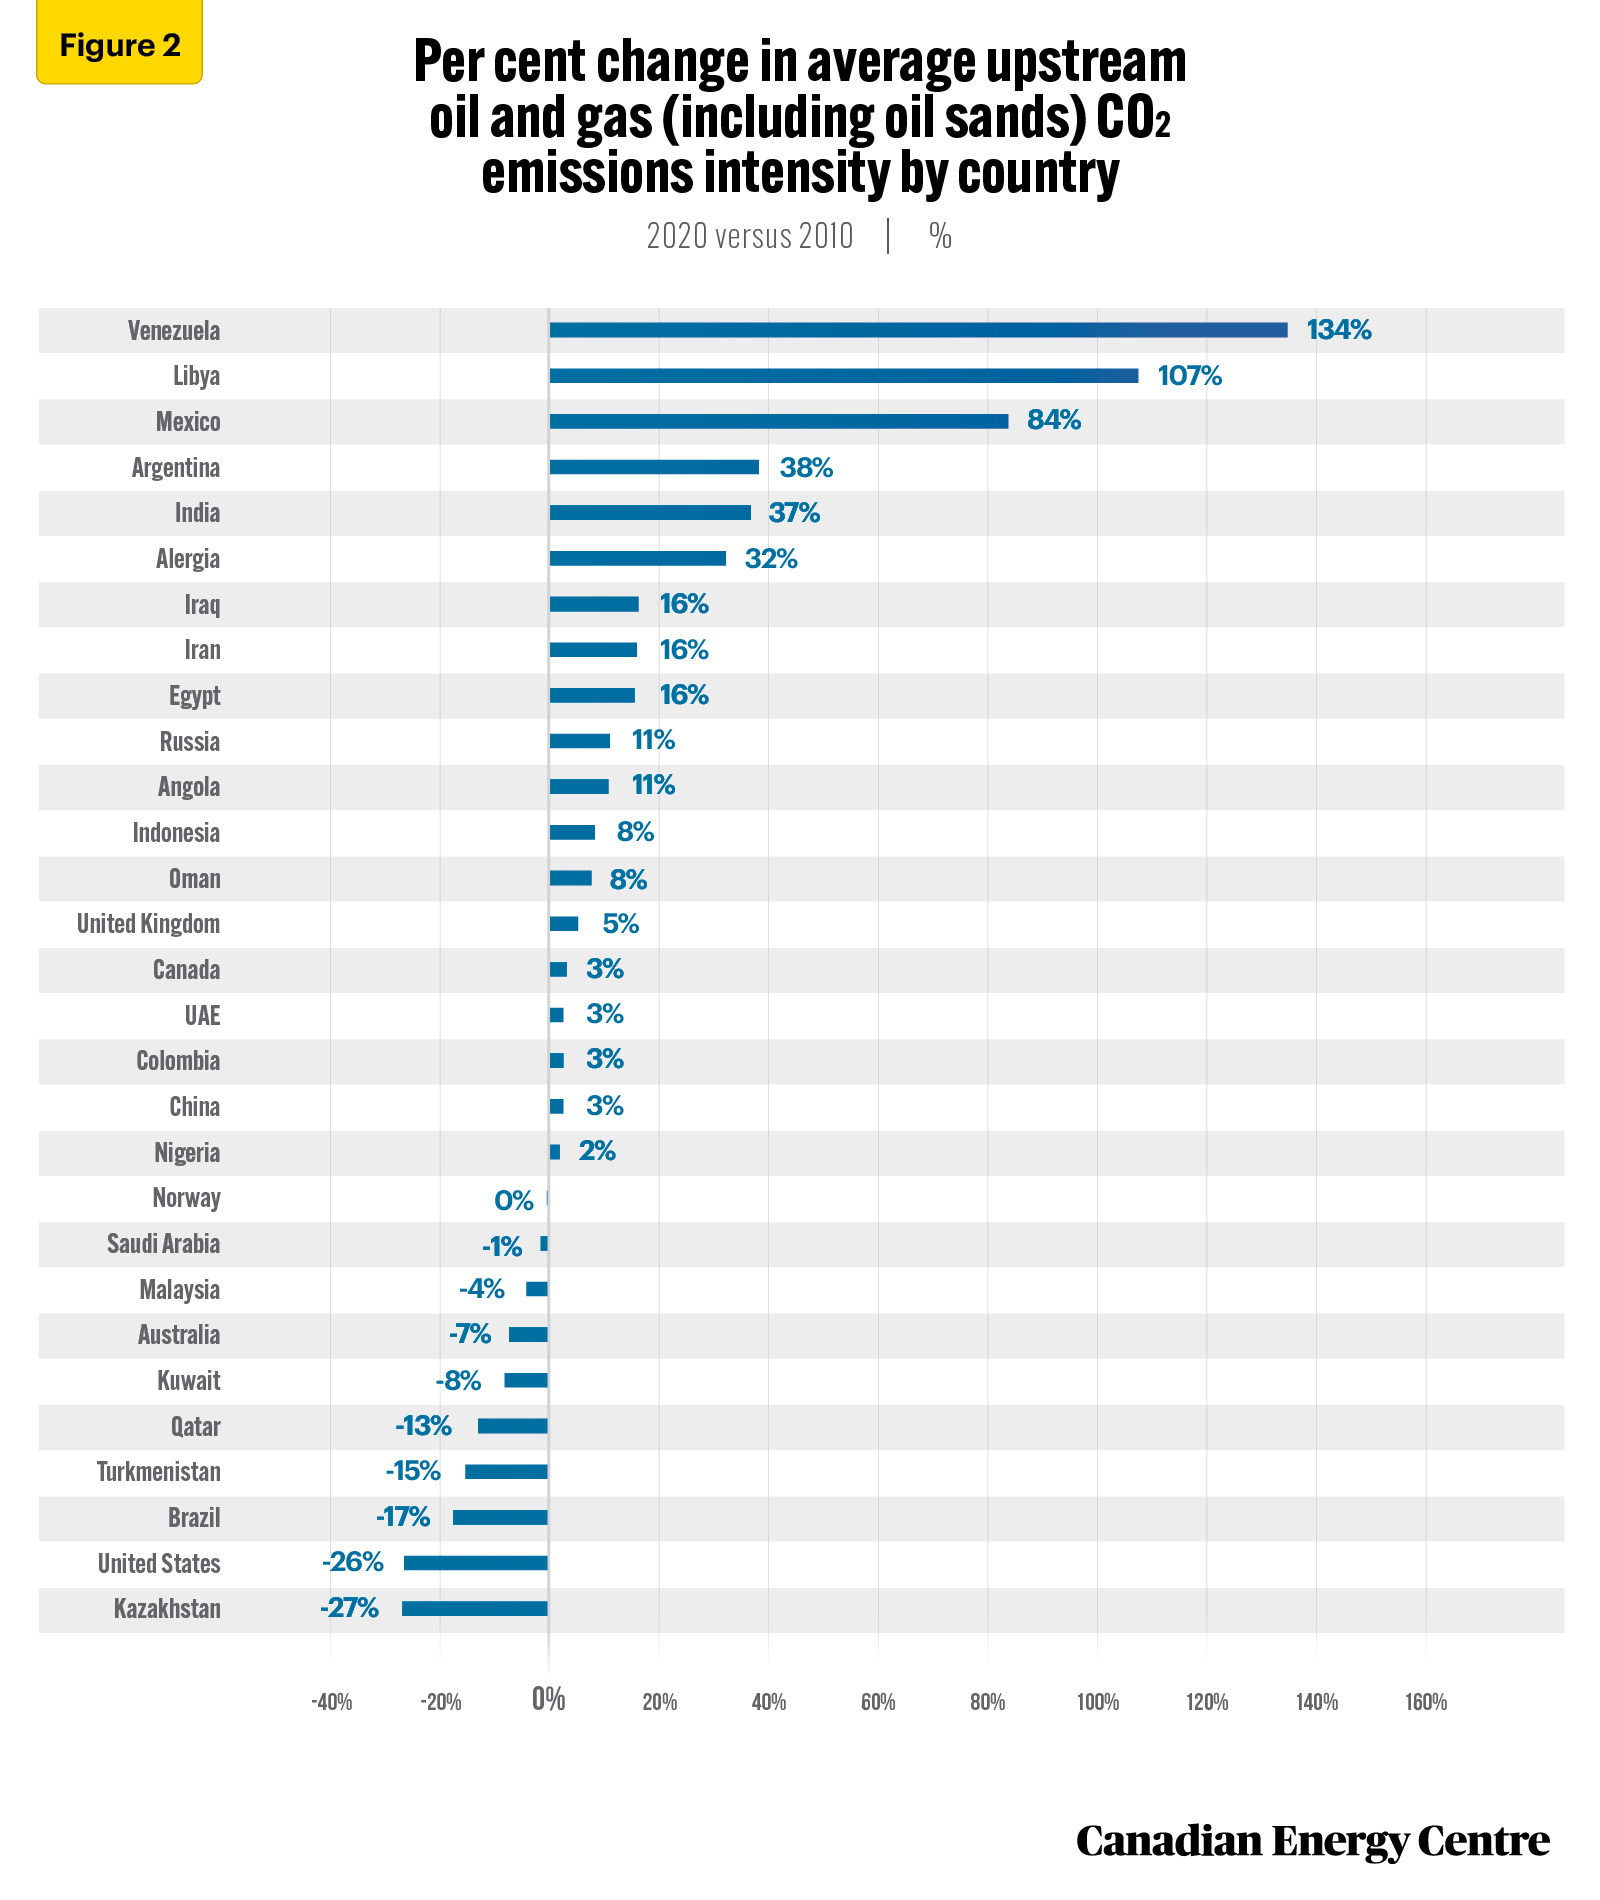
A key measure for benchmarking countries on upstream oil and gas emissions intensity is to focus on the rate of change, on a historical basis, in this case between 2010 and 2020. The rate of change measure tracks country performance in lowering emissions per boe produced over time.
During the period between 2010 and 2020, Canadian upstream oil and gas (including oil sands) kg CO2 emissions per boe produced increased by just 3 per cent. At the same time, Canadian upstream oil and gas production increased by 41 per cent, according to Rystad Energy data.
Source: Derived from Rystad Energy EmissionsCube
Canada’s rate of change in average upstream oil and gas kg CO2 per boe produced at 3 per cent was better than a number of peer countries, including Algeria (32 per cent), Angola (11 per cent), India (37 per cent), Iran (16 per cent), Iraq (16 per cent), Mexico (84 per cent), Oman (8 per cent), Russia (11 per cent), and the United Kingdom (5 per cent).
Peer countries that performed better than Canada on the rate of change in average upstream oil and gas kg CO2 per boe produced, included the United States (-26 per cent), Brazil (-17 per cent), Kazakhstan (-27 per cent), Kuwait (-8 per cent), Australia (-7 per cent), Saudi Arabia (-1 per cent), Turkmenistan (-15 per cent) and Norway (-0.4 per cent) (see Figure 2).
Source: Derived from Rystad Energy EmissionsCube
Canadian average upstream oil and gas (not including oil sands) CO2 emissions per barrel produced declined by nearly 12 per cent over the past decade
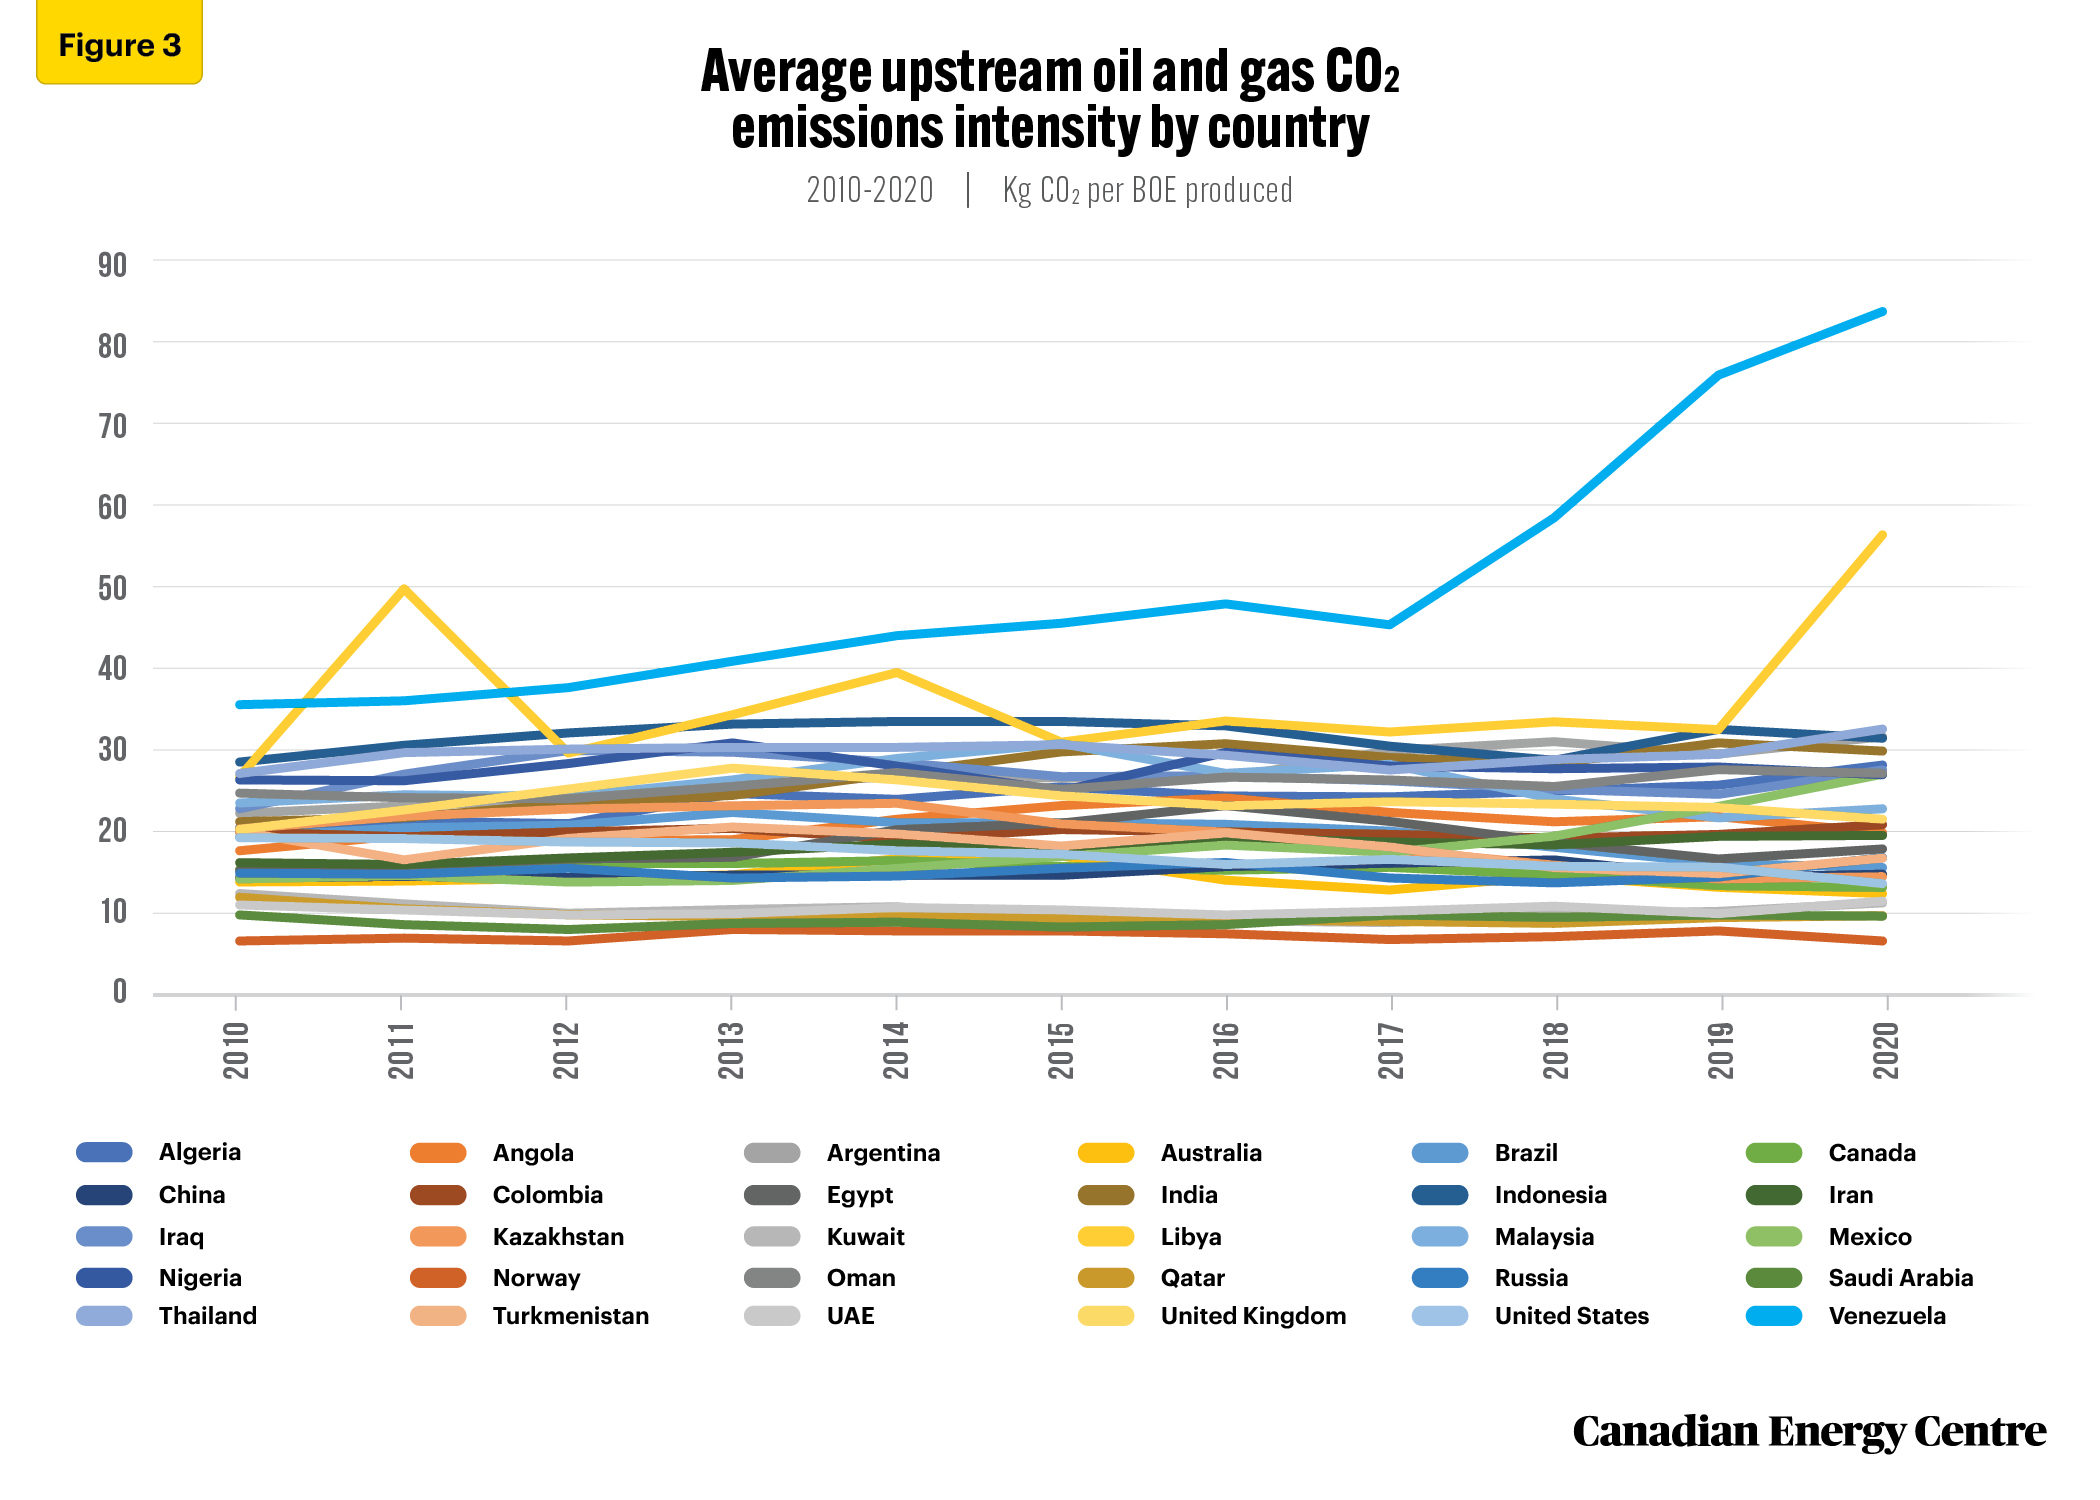
When we separate out the oil sands sub-sector and look at average upstream oil and gas emissions intensity performance, Canada’s CO2 emissions intensity was just 13 kg per boe produced in 2020.
This is lower than many peer countries, including Indonesia (31 kg per boe produced), Algeria (27 kg per boe produced), India (29 kg per boe produced), Nigeria (27 kg per boe produced), Mexico (27 kg per boe produced), Oman (27 kg per boe produced), the United Kingdom (22 kg per boe produced), and Iran (19 kg per boe produced). The United States was at 14 kg CO2 of boe produced, while Australia was at 13 kg CO2 per boe produced, better than Canada (see Figure 3).
Source: Derived from Rystad Energy EmissionsCube
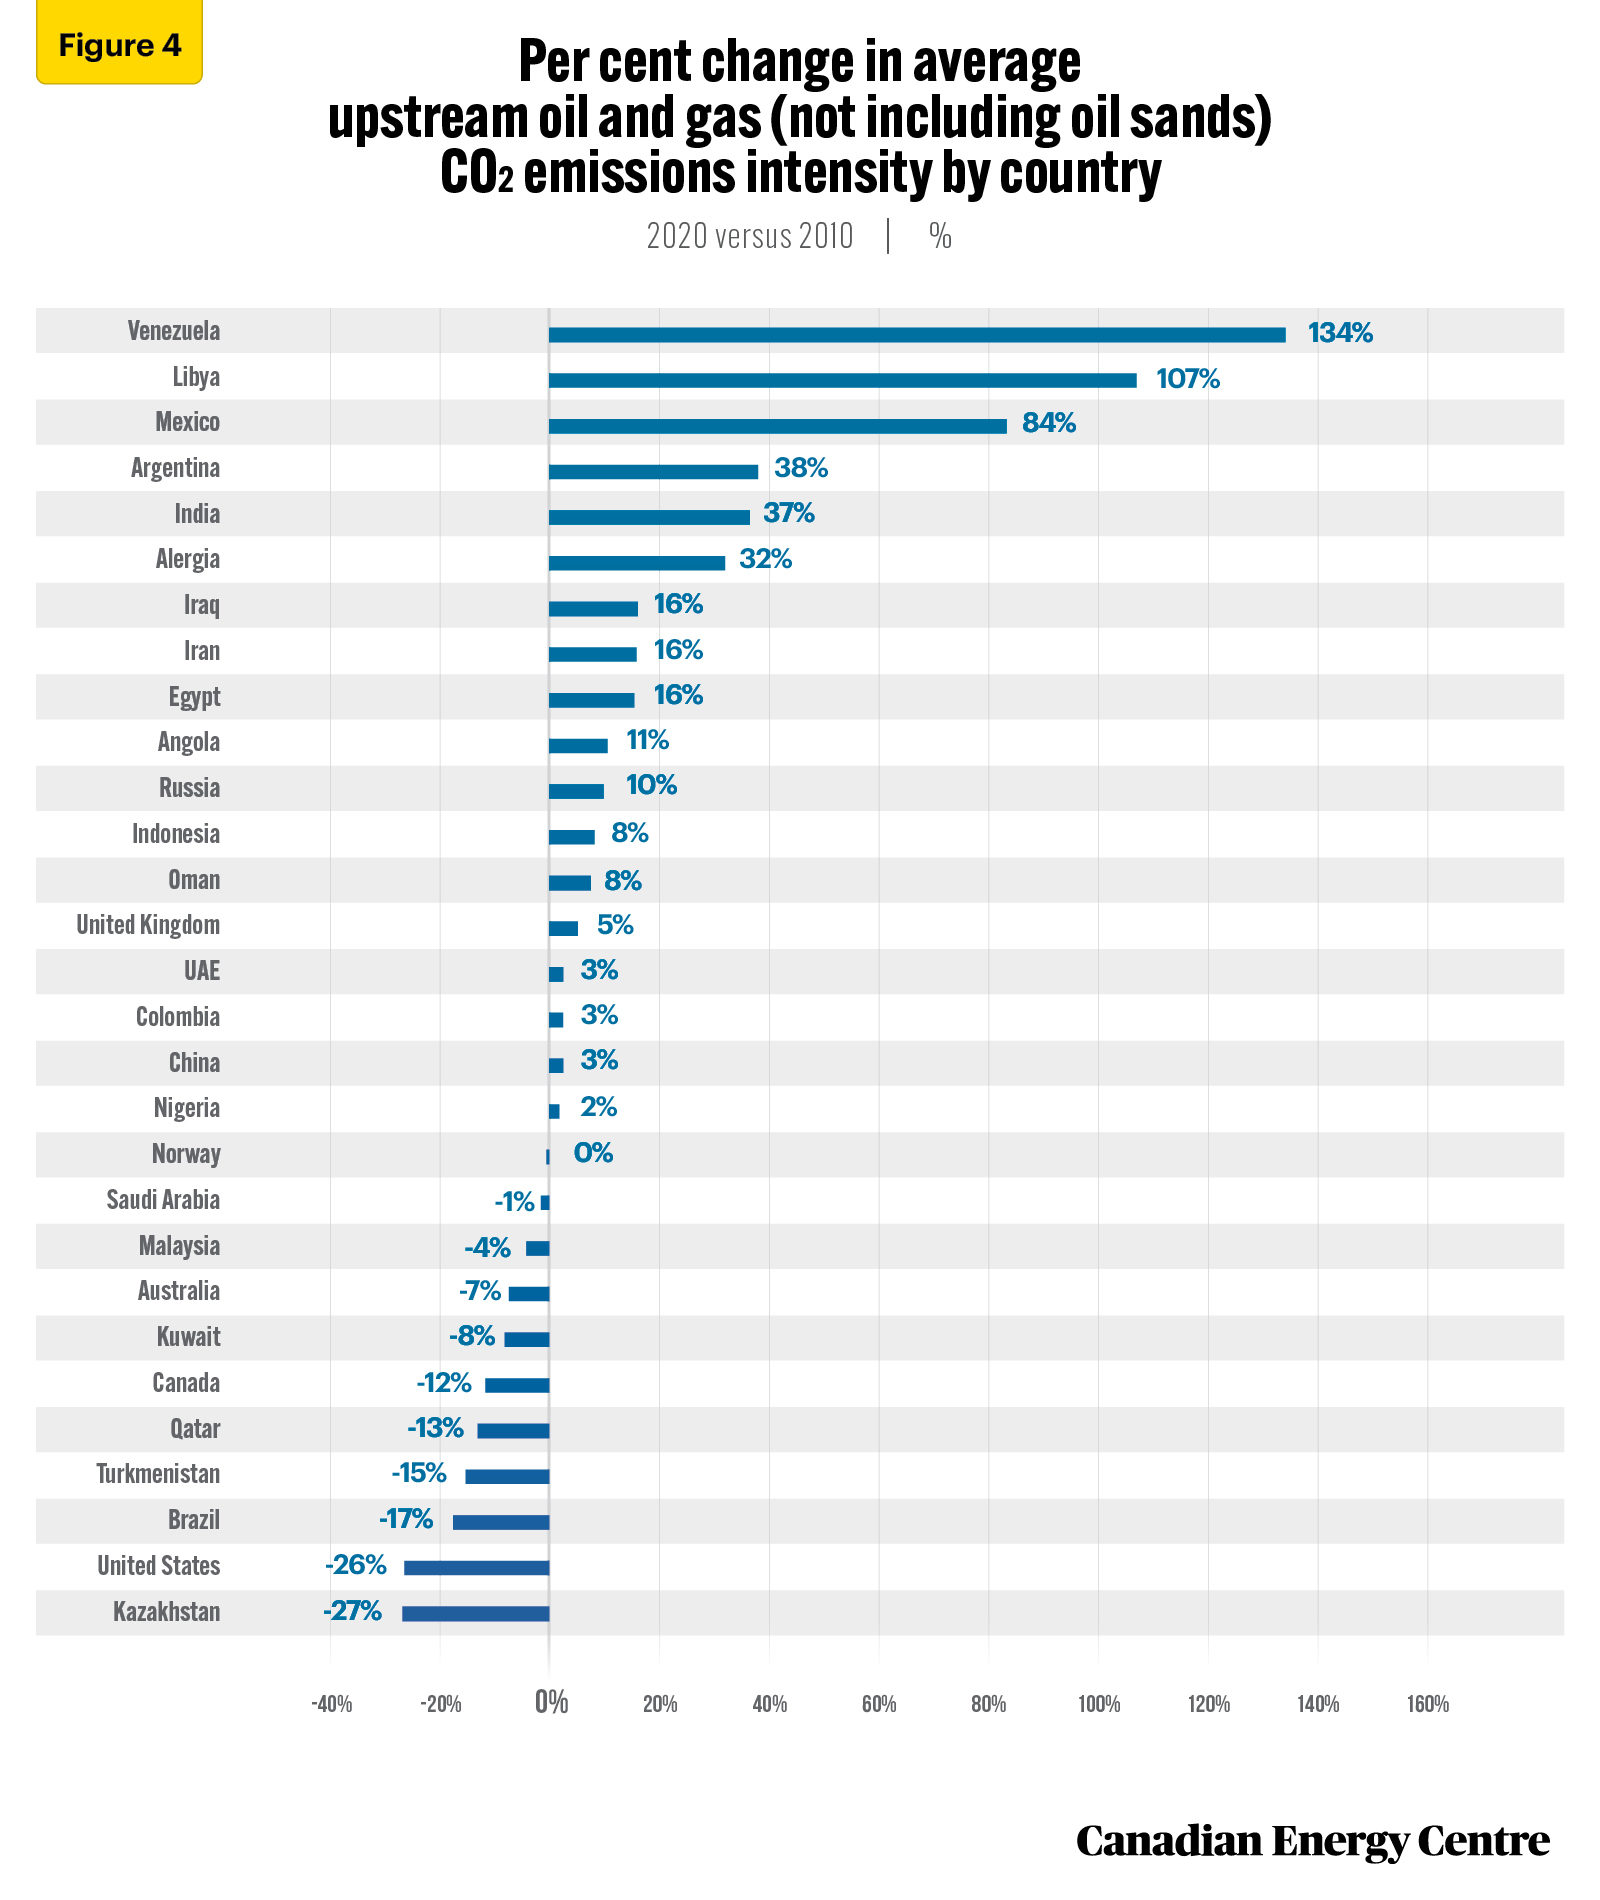
When we focus on the rate of change during the same period, Canadian upstream oil and gas (not including oil sands) kg CO2 emissions per boe produced fell by nearly 12 per cent between 2010 and 2020, the six highest decline among 29 other peer countries, behind only the United States (-26 per cent), Kazakhstan (-26 per cent), Brazil (-17 per cent), Qatar (-13 per cent), and Turkmenistan (-15 per cent).
Canada at (-12 per cent) is followed by Australia (-7 per cent), Kuwait (-8 per cent), Malaysia (-4 per cent), Saudi Arabia (-1 per cent), and Norway (-0.4 per cent), among others.
Those countries whose rate of change in upstream oil and gas (not including oil sands) kg CO2 per boe increased between 2010 and 2020, including Algeria (32 per cent), Angola (11 per cent), India (37 per cent ), Indonesia (8 per cent), Iran (16 per cent), Iraq (16 per cent), Mexico (84 per cent), Nigeria (2 per cent), Oman (8 per cent), Russia (10 per cent), and the UAE (3 per cent) (see Figure 4).
Source: Derived from Rystad Energy EmissionsCube
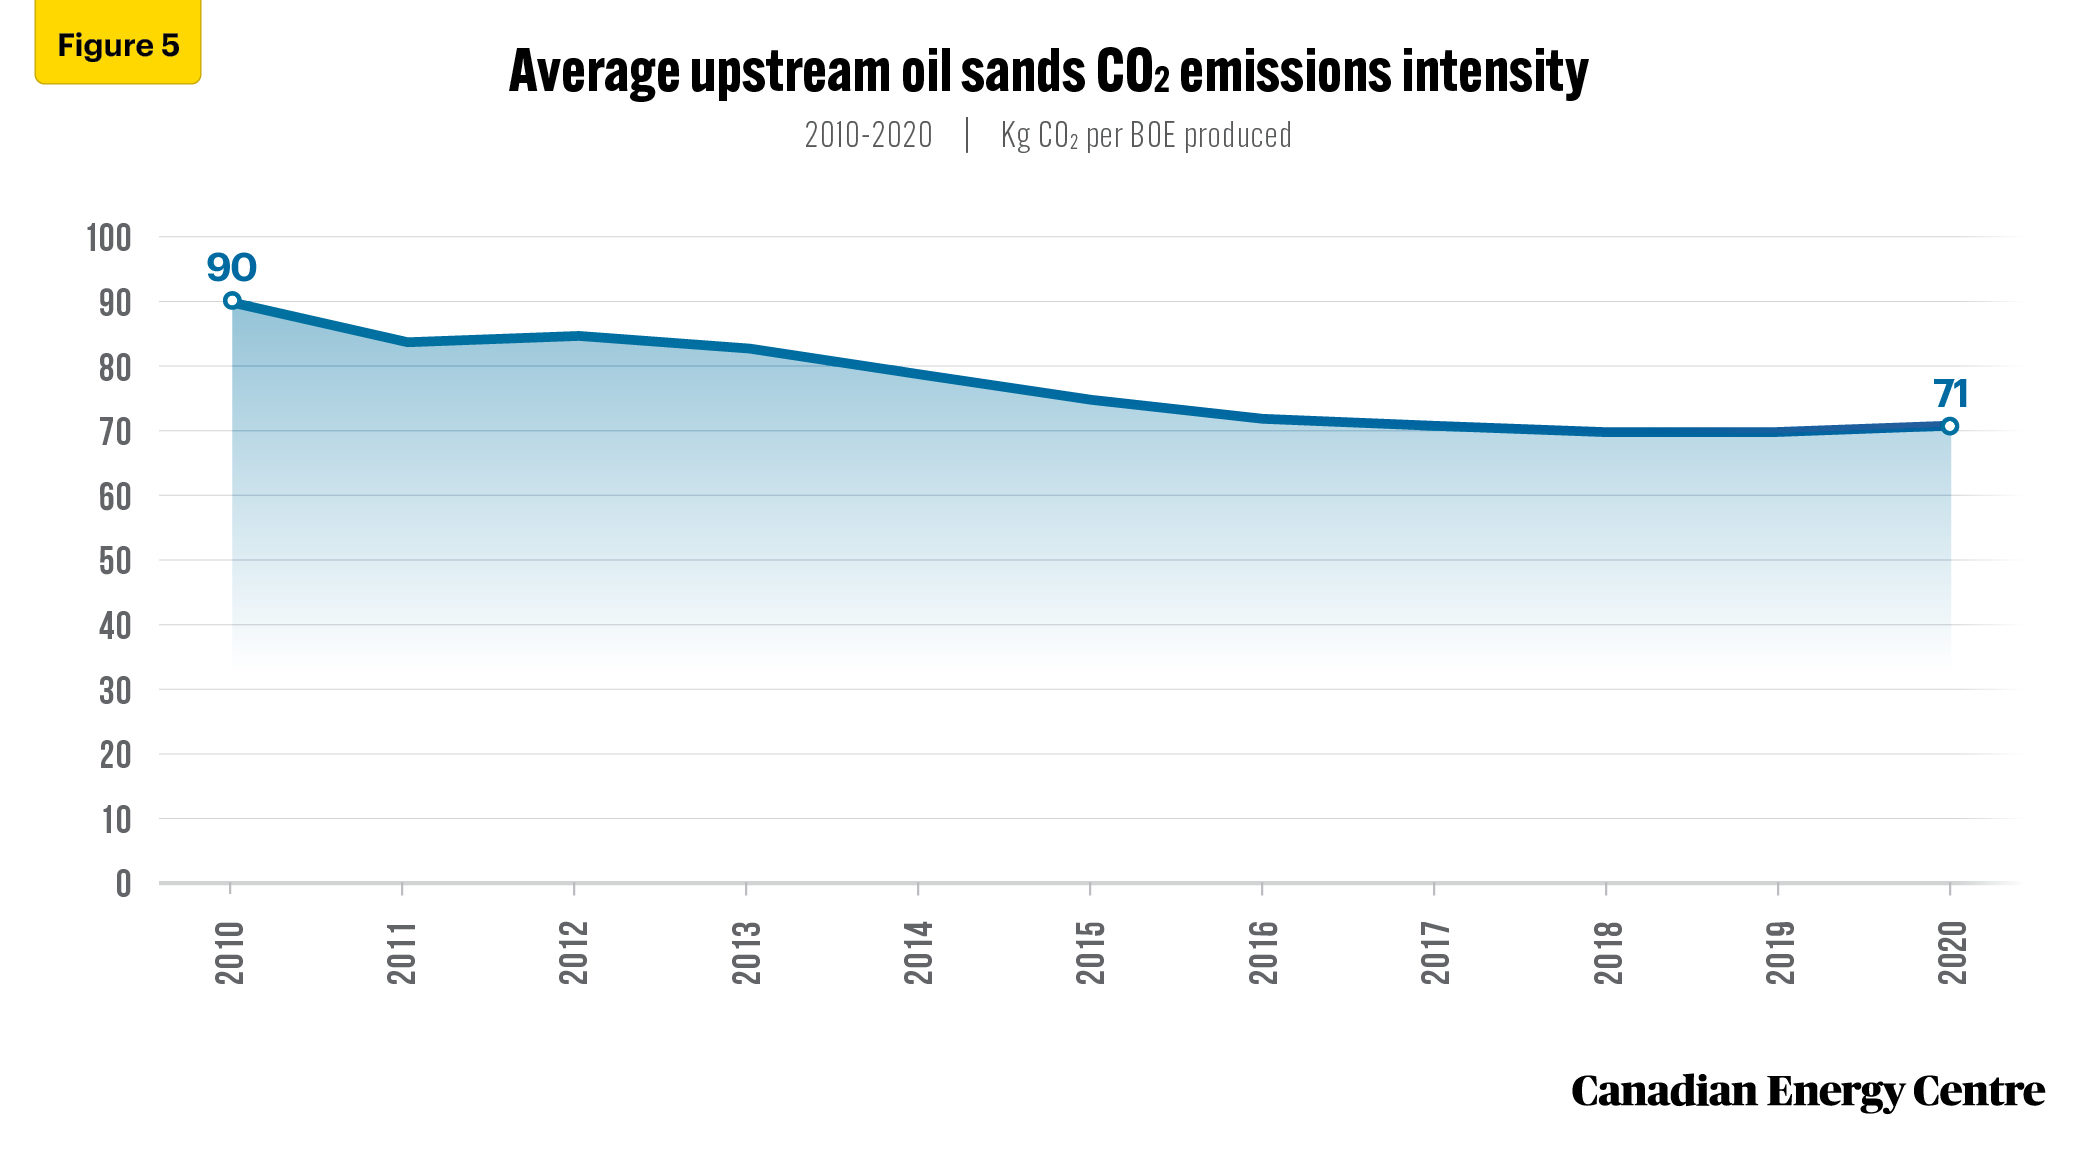
Canadian average oil sands CO2 emissions per barrel produced declined by over 21 per cent over the past decade
Canada’s oil sands sector has made considerable progress in reducing its CO2 emissions intensity over the past decade, falling to 71 kg CO2 per boe produced (see Figure 5).
Source: Derived from Rystad Energy EmissionsCube
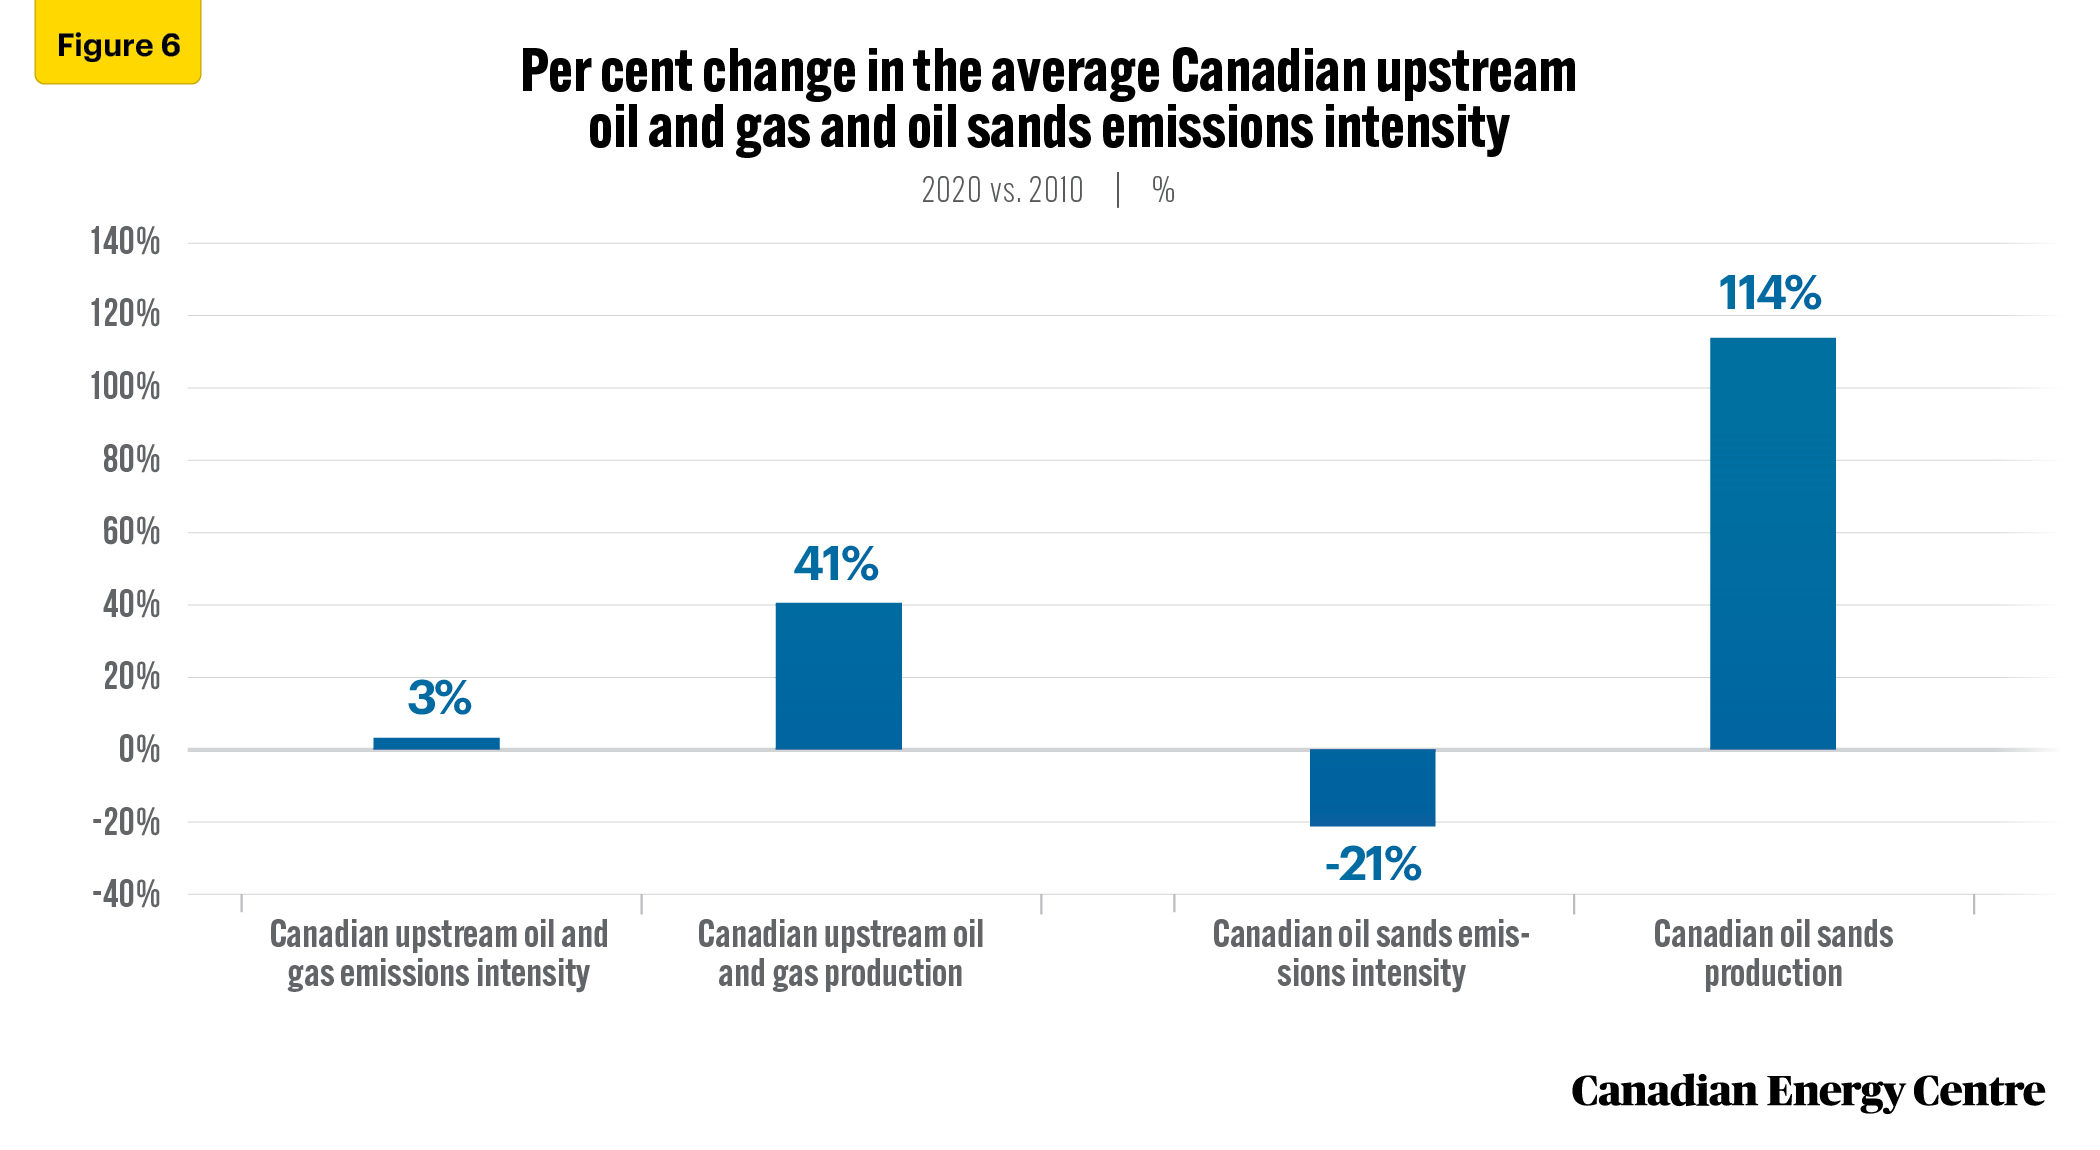
In fact, between 2010 and 2020, kg CO2 per boe fell by over 21 per cent, a significant improvement in performance (see Figure 6). At the same time, Canadian oil sands production increased by 114 per cent, according to Rystad Energy data.
As noted earlier, during the period between 2010 and 2020, Canadian upstream oil and gas (including oil sands) kg CO2 emissions per boe produced increased by just 3 per cent. At the same time, Canadian upstream oil and gas production increased by 41 per cent, according to Rystad Energy data (Figure 6).
Source: Derived from Rystad Energy EmissionsCube
Conclusion
The Canadian upstream oil and natural gas sector is making steady progress versus many peer countries on its CO2 emissions per boe produced.
Between 2010 and 2020, Canadian upstream oil and gas CO2 emissions intensity, expressed as kg CO2 per boe produced, remained relatively steady in a band between 32 to 34 kgCO2 per boe produced, settling in at 33 kgCO2 per boe produced in 2020. In fact, average upstream oil and gas emissions intensity rose by just 3 per cent over the past decade, a much better performance than a number of other peer countries. At the same time, Canadian upstream oil and gas production increased by 41 per cent, according to Rystad Energy data.
The Canadian upstream oil and gas emissions intensity is influenced by higher levels of emissions intensity found in the sands sector. When the oil sands is separated out, the emissions intensity of the Canadian upstream oil and gas sector falls to just 13 kg CO2 per boe produced, lower than many peer countries. And average upstream oil and gas (not including oil sands) fell by nearly 12 per cent over the past decade, the six highest rate of decline among 30 peer countries.
Canada’s upstream oil sands sector is making considerable process in reducing its emissions intensity. According to Rystad data between 2010 and 2020, Canadian average oil sands CO2 emissions per boe produced declined by over 21 per cent in the past decade, while production increased by 114 per cent.
Notes
This CEC Fact Sheet was compiled by Lennie Kaplan at the Canadian Energy Centre (www.canadianenergycentre.ca). The author and the Canadian Energy Centre would like to thank and acknowledge the assistance of two anonymous reviewers in reviewing the original data and research for this Fact Sheet.
References (as of September 20, 2022)
Rystad Energy, August and September 2022. EmissionsCube. <https://bit.ly/3eAyIAs>.
Creative Commons Copyright
Research and data from the Canadian Energy Centre (CEC) is available for public usage under creative commons copyright terms with attribution to the CEC. Attribution and specific restrictions on usage including non-commercial use only and no changes to material should follow guidelines enunciated by Creative Commons here: Attribution-NonCommercial-NoDerivs CC BY-NC-ND.