Social
To sign up to receive the latest Canadian Energy Centre research to your inbox email: research@canadianenergycentre.ca
Download the PDF here
Download the charts here
Overview
Despite Canada’s position as one of the world’s top oil producers with one of the largest global oil reserves, crude oil imports into Canada have become a significant part of the country’s energy mix, particularly since 2000.
This Fact Sheet uses Statistics Canada’s International Merchandise Trade Database to track the flow of imports of crude oil (i.e., petroleum oils and oils obtained from bituminous minerals) into Canada between 1988 and 2020. We then analyze the source of those imports by country, break down the oil imports by province, and then break down the 2010 to 2020 figures. We also compare the value of crude oil imports with other imports to provide a sense of the relative value of Canada’s oil imports.¹
In short:
- Between 1988 and 2020, Canada spent $488 billion nominal ($604 billion in 2020 dollars) on foreign oil imports;
- Quebec is by far the largest importer of foreign oil into Canada, importing $228 billion worth of foreign oil since 1988;
- Between 2010 and 2020, Canada’s oil imports from just the United States and Saudi Arabia totaled over $110 billion;
- Using census data from 2016, along with our own calculations, we determined that the value of foreign oil imports that year amounted to $1,021 per household based on a national average (including Quebec); and
- When the value of Quebec’s foreign oil imports in 2016 is matched to the number of households in Quebec that year, foreign oil imports to Quebec were worth $1,576 per household annually in 2016.
1. There are a number of factors that explain Canada’s level of foreign crude oil imports, including the type of oil a refinery is designed to process and ongoing pipeline constraints. In this Fact Sheet, we do not offer “pro” or “con” policy prescriptions; just hard data which the public and policymakers can use as a base for discussion. Note that we make clear in other reports that Canada is a net beneficiary of the international oil trade and for that and other reasons—the benefits of free trade writ large—the data herein should not be interpreted as a call to restricted trade in oil, but rather, an end to artificial, activist, and political barriers and for Canada’s crude oil to be extracted and shipped cross-country to be used domestically and internationally.
Canada has imported nearly 9 billion barrels of foreign oil since 1988
Between 1988 and 2020, Canada imported nearly nine billion barrels of crude oil from other countries, an average of over 745,000 barrels per day over the period. Crude oil imports into Canada more than doubled between 1988 and 2008, increasing from 148 million barrels to nearly 329 million barrels annually. Since 2008, crude oil imports to Canada have fallen by about 37 per cent, yet at over 206 million barrels in 2020, they remain nearly 39 per cent above the 1988 level.
The value of foreign oil imports from 1988 to 2020: $488 billion nominal or $604 billion in 2020 dollars
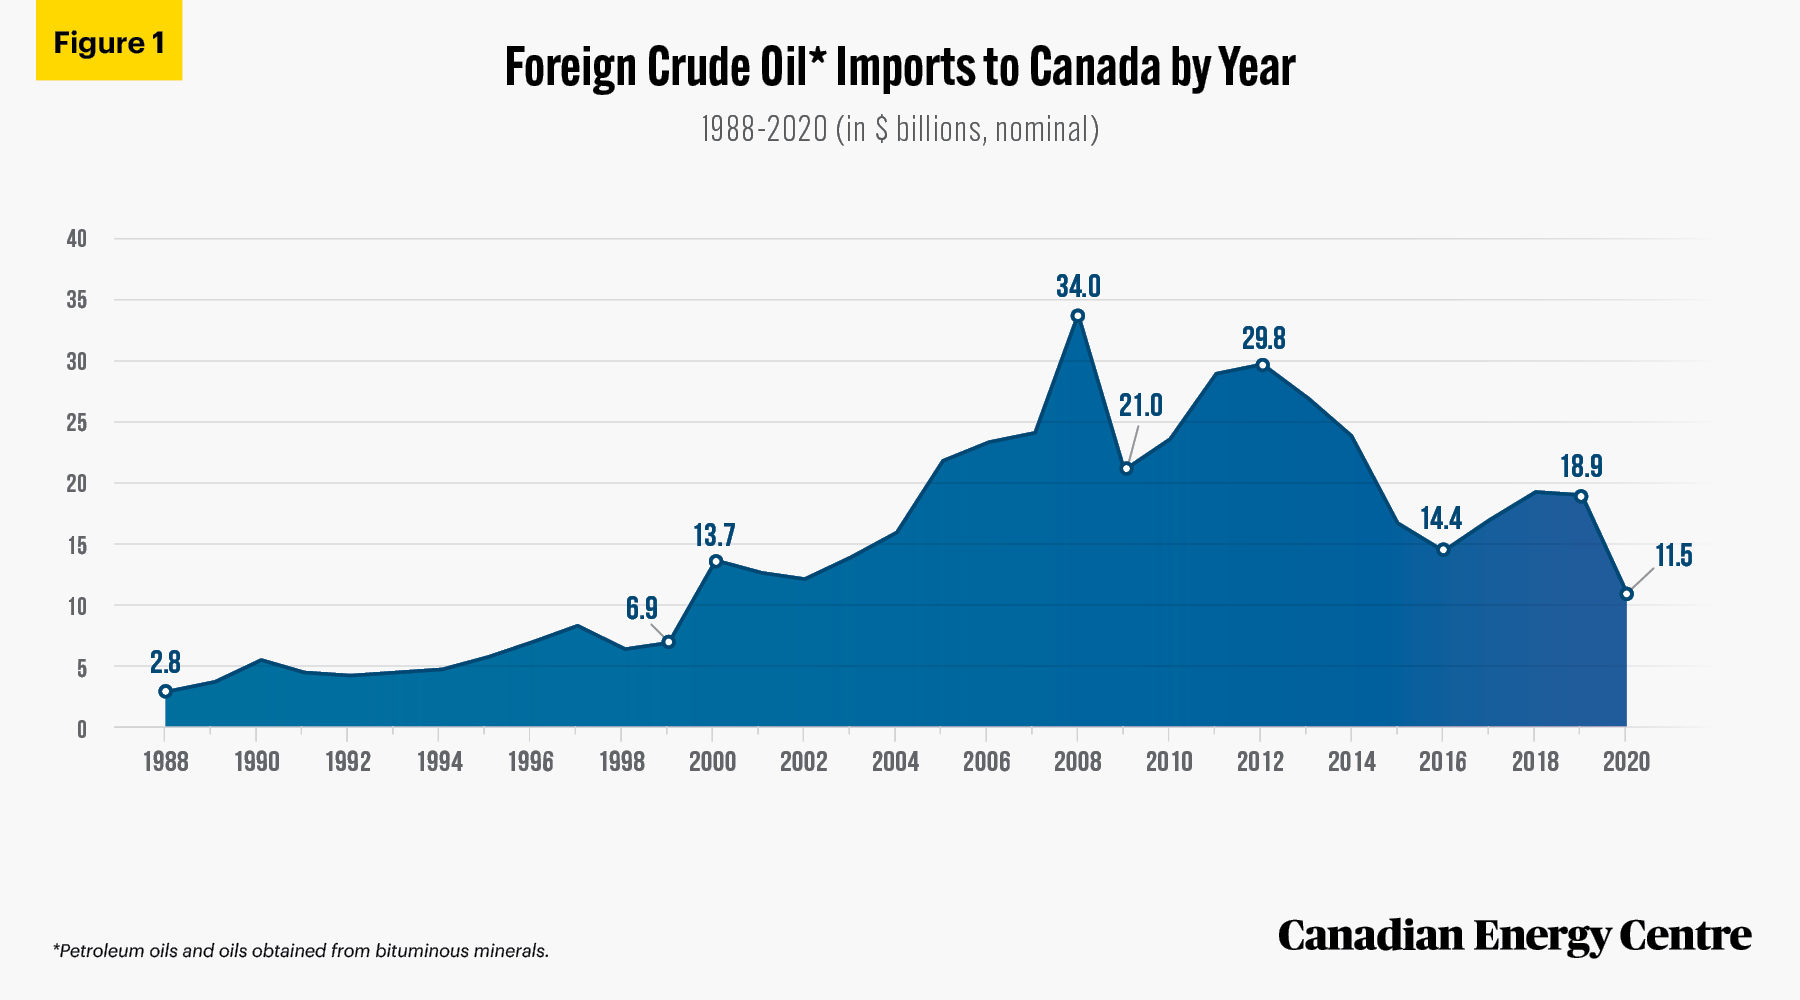
The value of crude oil imports into Canada grew gradually between 1988 and 1999, from $2.8 billion to $6.9 billion in those years. Foreign crude oil imports then nearly doubled to $13.7 billion in 2000 and continued to grow steadily to nearly $34 billion by 2008 (see figure 1). There was a sharp decline to $21 billion worth of imports in 2009, coinciding with the Great Recession, but growth resumed and crude oil imports reached $29.8 billion in 2012. Despite lower crude prices beginning in 2014, the value of annual foreign crude oil imports into Canada remained at over $14 billion through to 2019 when imports reached $18.9 billion before falling to $11.5 billion in 2020 due to COVID-19.
In total, between 1988 and 2020, Canada spent $488 billion importing crude oil from such countries as Saudi Arabia, Iraq, Russia, Azerbaijan, Nigeria, Algeria, Angola, Venezuela, and Kazakhstan, as well as the United Kingdom, Norway and, more recently, the United States.
- On an inflation-adjusted basis, Canada spent $604 billion importing foreign crude oil between 1988 and 2020.
- On an inflation-adjusted basis, Canada spent $5.5 billion on foreign oil imports in 1988 ($2.8 billion in nominal dollars) compared with the $18.9 billion it spent on such imports in 2020.
Source: Derived from Statistics Canada, Canadian International Merchandise Trade Database.
Foreign oil imports by province from 1988 to 2020: Quebec highest at $228 billion
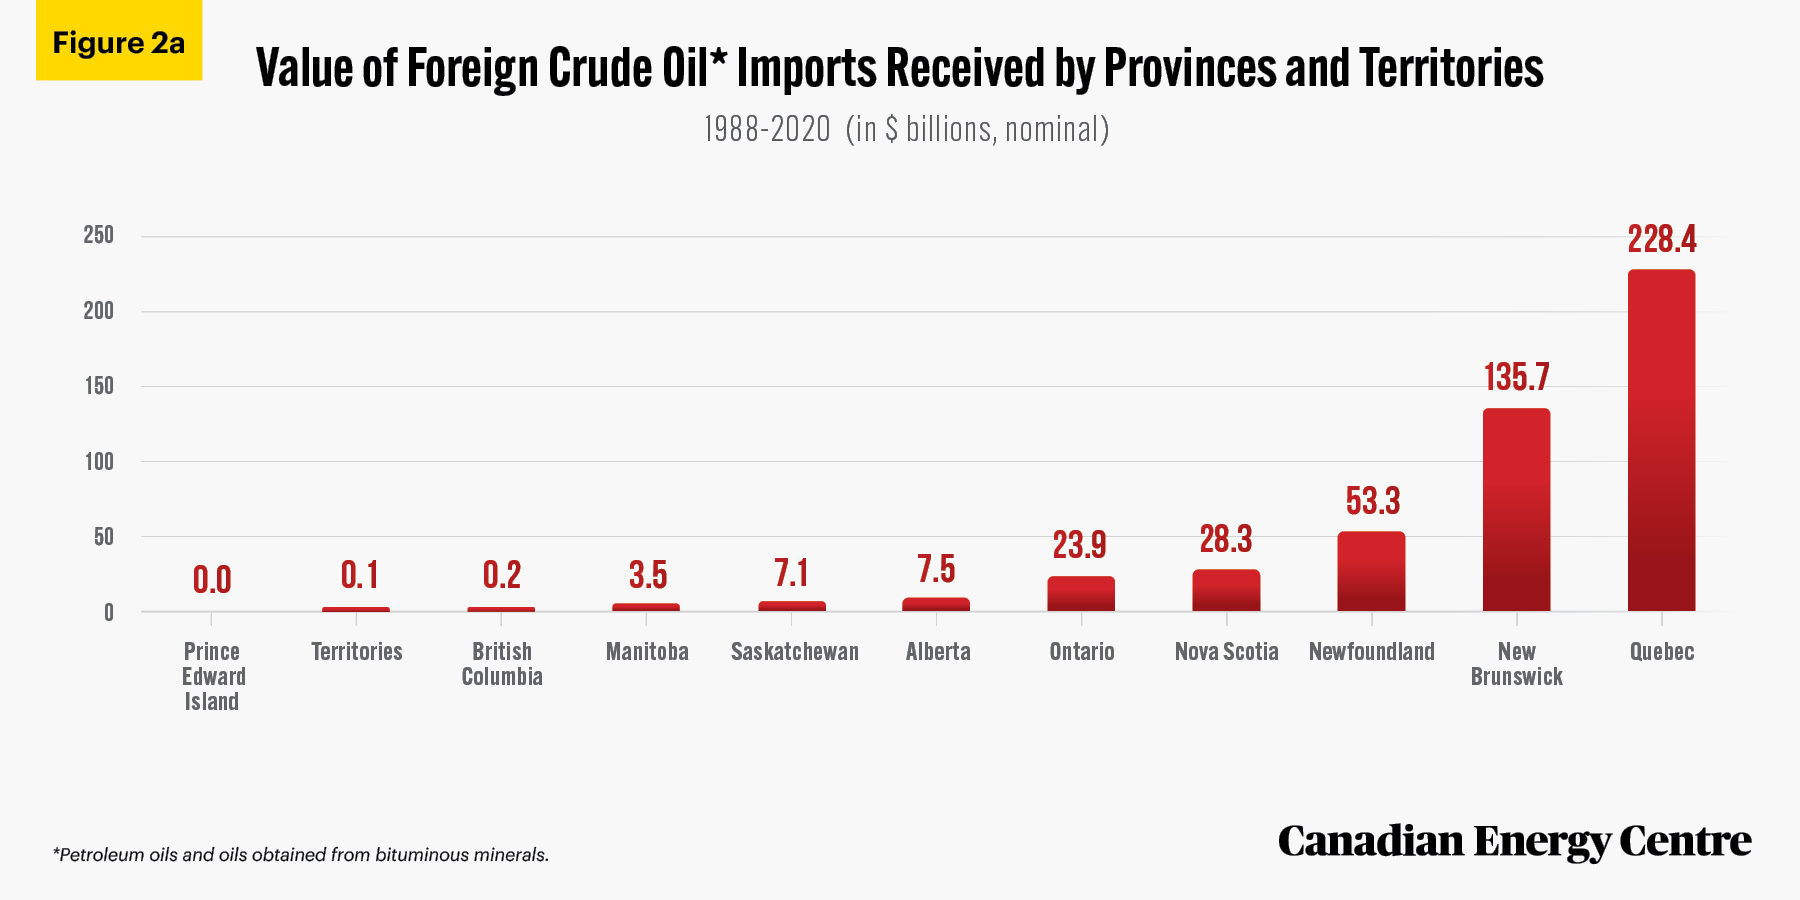
Between 1988 and 2020, Canada’s foreign crude oil imports in nominal dollars ranged from nil in Prince Edward Island and $200 million in British Columbia to $228 billion in Quebec where import values were the highest (see Figure 2a).
Central and Eastern Canada are generally more reliant on foreign oil imports than Western Canada, in part due to the lack of critical pipeline infrastructure from Western Canada. Insufficient pipeline capacity continues to be a problem despite the 2015 reversal/expansion of Enbridge’s Line 9B pipeline, which has enabled Ontario and Quebec refineries to source more oil from Western Canada. Historically, New Brunswick’s Irving Oil Refinery also relies on foreign oil imports.
Source: Derived from Statistics Canada, Canadian International Merchandise Trade Database.
Value of foreign oil imports per household
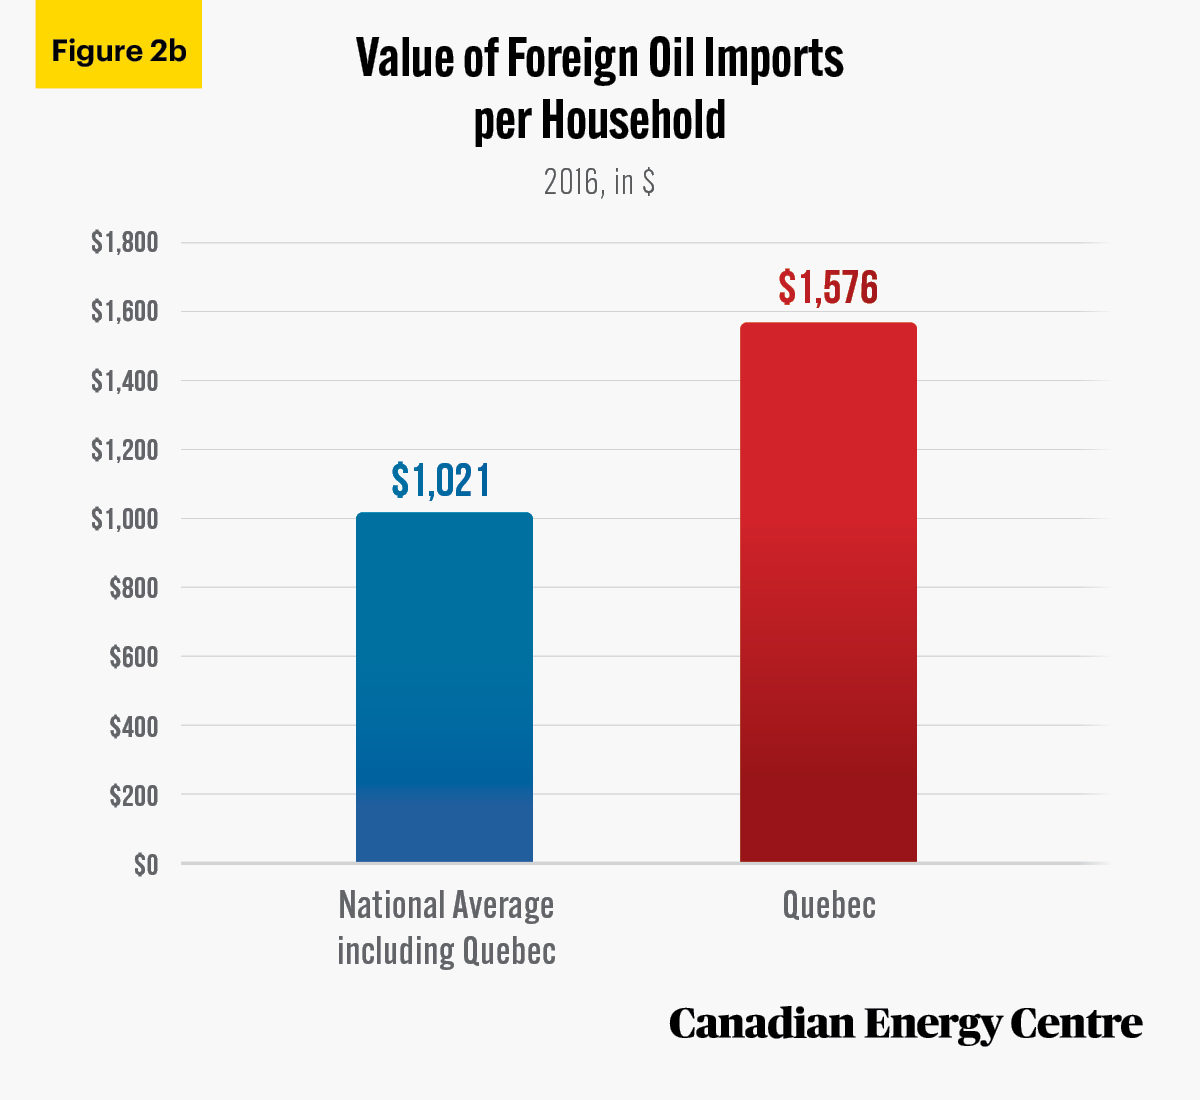
Combining census data from 2016 on the number of households with the value of foreign oil imports that year allows for a per-household comparison (see figure 2b).
- In 2016, the value of foreign oil imports to all of Canada was just under $14.4 billion. Quebec’s portion of such imports was nearly $5.6 billion. There were nearly 14.1 million households in Canada that year, with over 3.5 million of them in Quebec;
- The value of foreign oil imports amounted to $1,021 per household based on a national average (including Quebec); and
- When the value of Quebec’s foreign oil imports in 2016is matched to the number of Quebec households, the value of foreign oil imports to Quebec was $1,576 per household.
Sources: Derived from Statistics Canada, Canadian International Merchandise Trade Database and the 2016 Census
Foreign crude oil imports by country from 1988 to 2020
Canada has imported crude oil from a number of countries over the past three decades (see figure 3). Between 1988 and 2020, the five largest exporters of foreign crude oil to Canada were the United States ($94.6 billion), followed by Norway ($79.0 billion), the United Kingdom ($62.6 billion), Algeria ($58.4 billion), and Saudi Arabia ($44.4 billion).
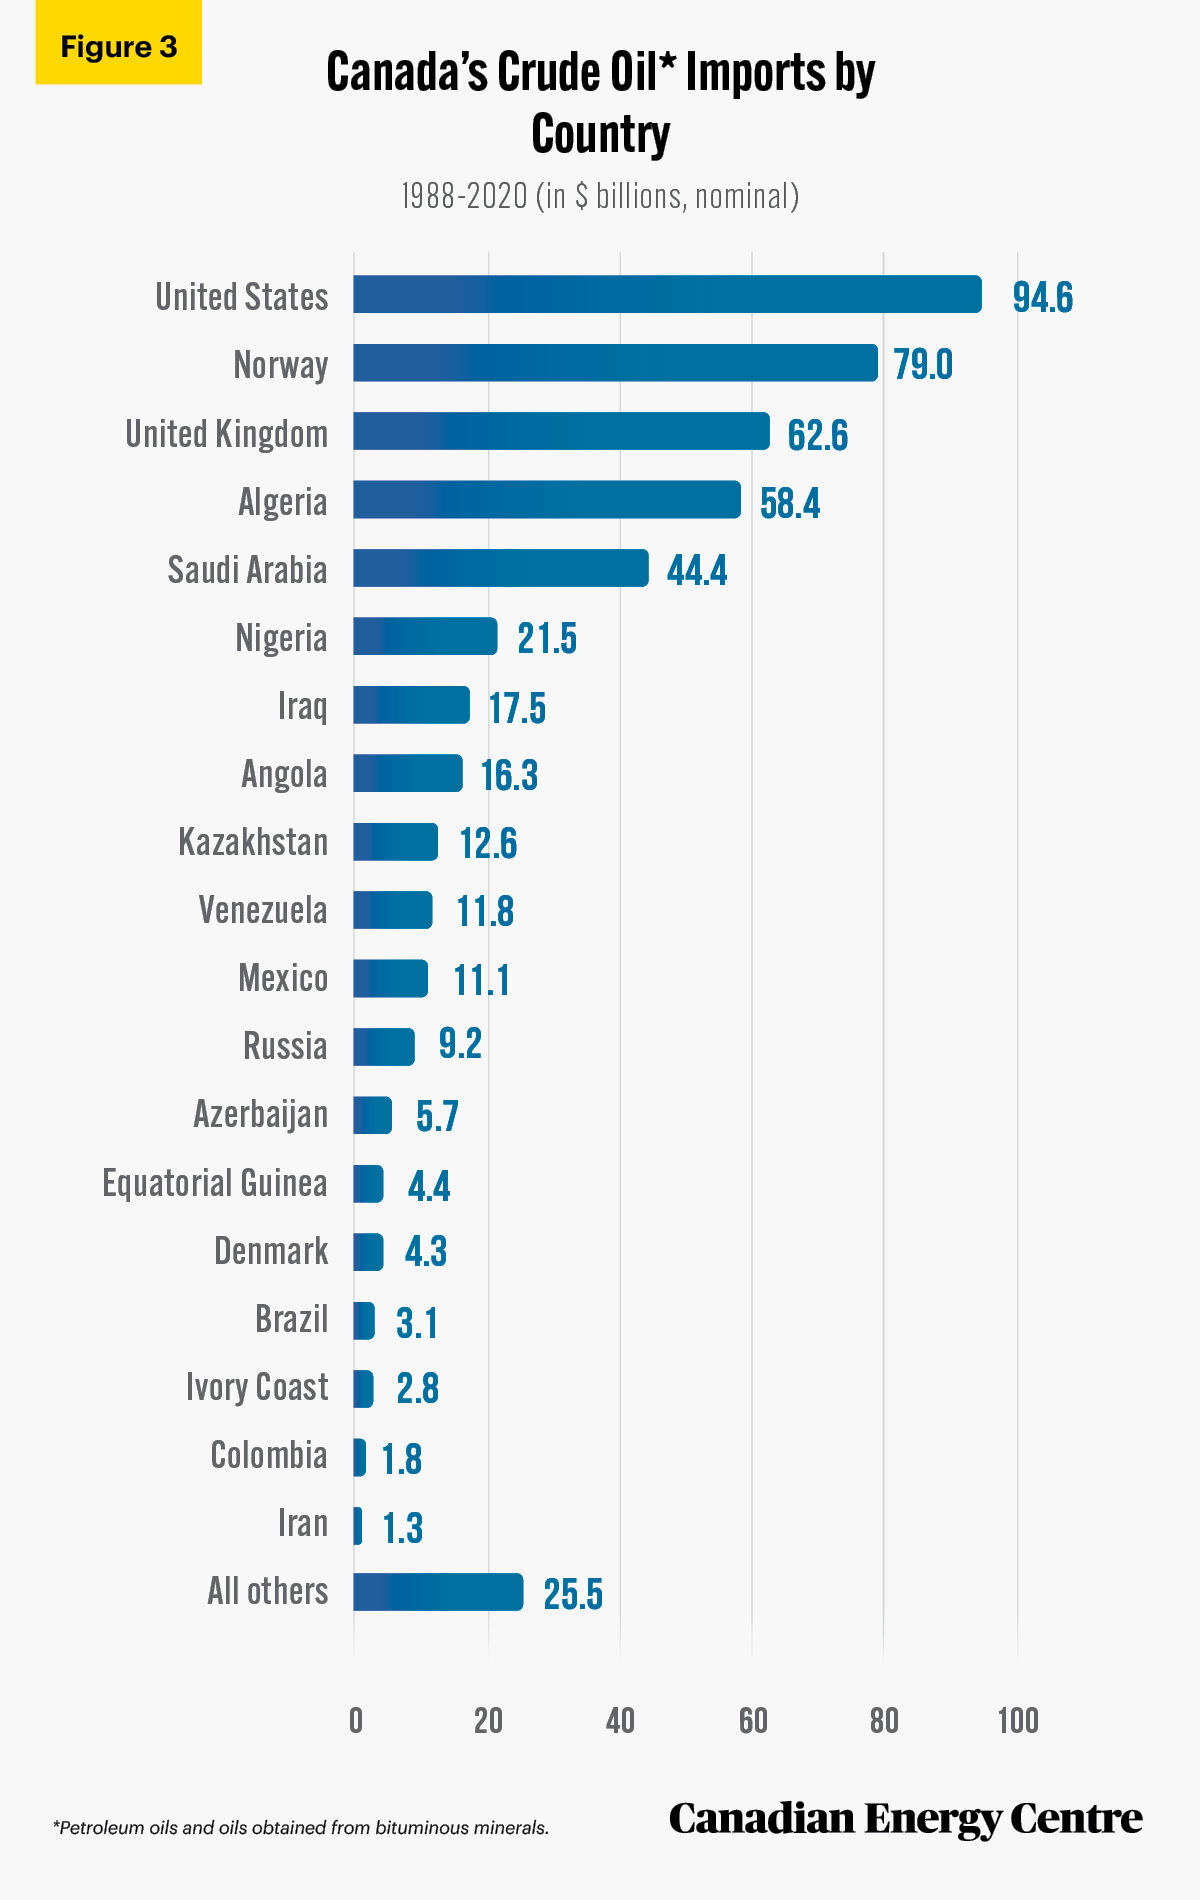
Source: Derived from Statistics Canada, Canadian International Merchandise Trade Database
Canada’s historic oil suppliers: The United Kingdom, Norway, and Nigeria
- The United Kingdom was once a consistent source of foreign crude oil for Canada; imports from it reached an annual value of $5.2 billion in 2008 before falling off in the current decade as its oil production declined; as of 2020, the value of U.K. oil imports to Canada was just $63 million.
- Norway was also once a significant source of foreign crude oil for Canada; the value of imports from it reached over $5.6 billion in 2008, but fell off with the Great Recession of 2009 and the crude oil price decline that started in 2014. In 2020, the value of oil imported to Canada from Norway was just $345 million.
- Nigeria has been another major source of foreign crude oil for Canada; the value of imports from that country peaked at $2.4 billion in 2011, but fell off to just $611 million in 2020.
- Venezuela was also a source of foreign crude oil for Canada between 2000 and 2007 at a value of nearly $11.8 billion, but as of 2008, Canada imported no oil from Venezuela;
- Algeria emerged as a key source of foreign crude oil for Canada between 2000 and 2013; the value of imports from it peaked at nearly $6 billion in 2012 before falling to zero between 2016 and 2020; and
- Other nations such as Azerbaijan, Angola, and Kazakhstan have also been sources of crude oil for Canada, primarily between 2008 and 2014.
Since 2005, Saudi Arabia has increasingly become a key source of foreign crude oil for Canada. And after 2007 when its shale oil production began to soar, the United States also increased its role as a significant supplier of crude oil to Canada.
From 2010 to 2020 Canada relied more heavily on the United States and Saudi Arabia
Canada’s mix of suppliers of foreign crude oil has become less diverse over time, particularly in the last decade.
- Between 2010 and 2020, Canada’s oil imports were worth a total of $231.1 billion. U.S. oil imports accounted for nearly $84.2 billion, followed by imports from Saudi Arabia at $26.3 billion. That is over $110 billion in foreign oil imported to Canada from those two countries alone in that decade (see Figure 4).
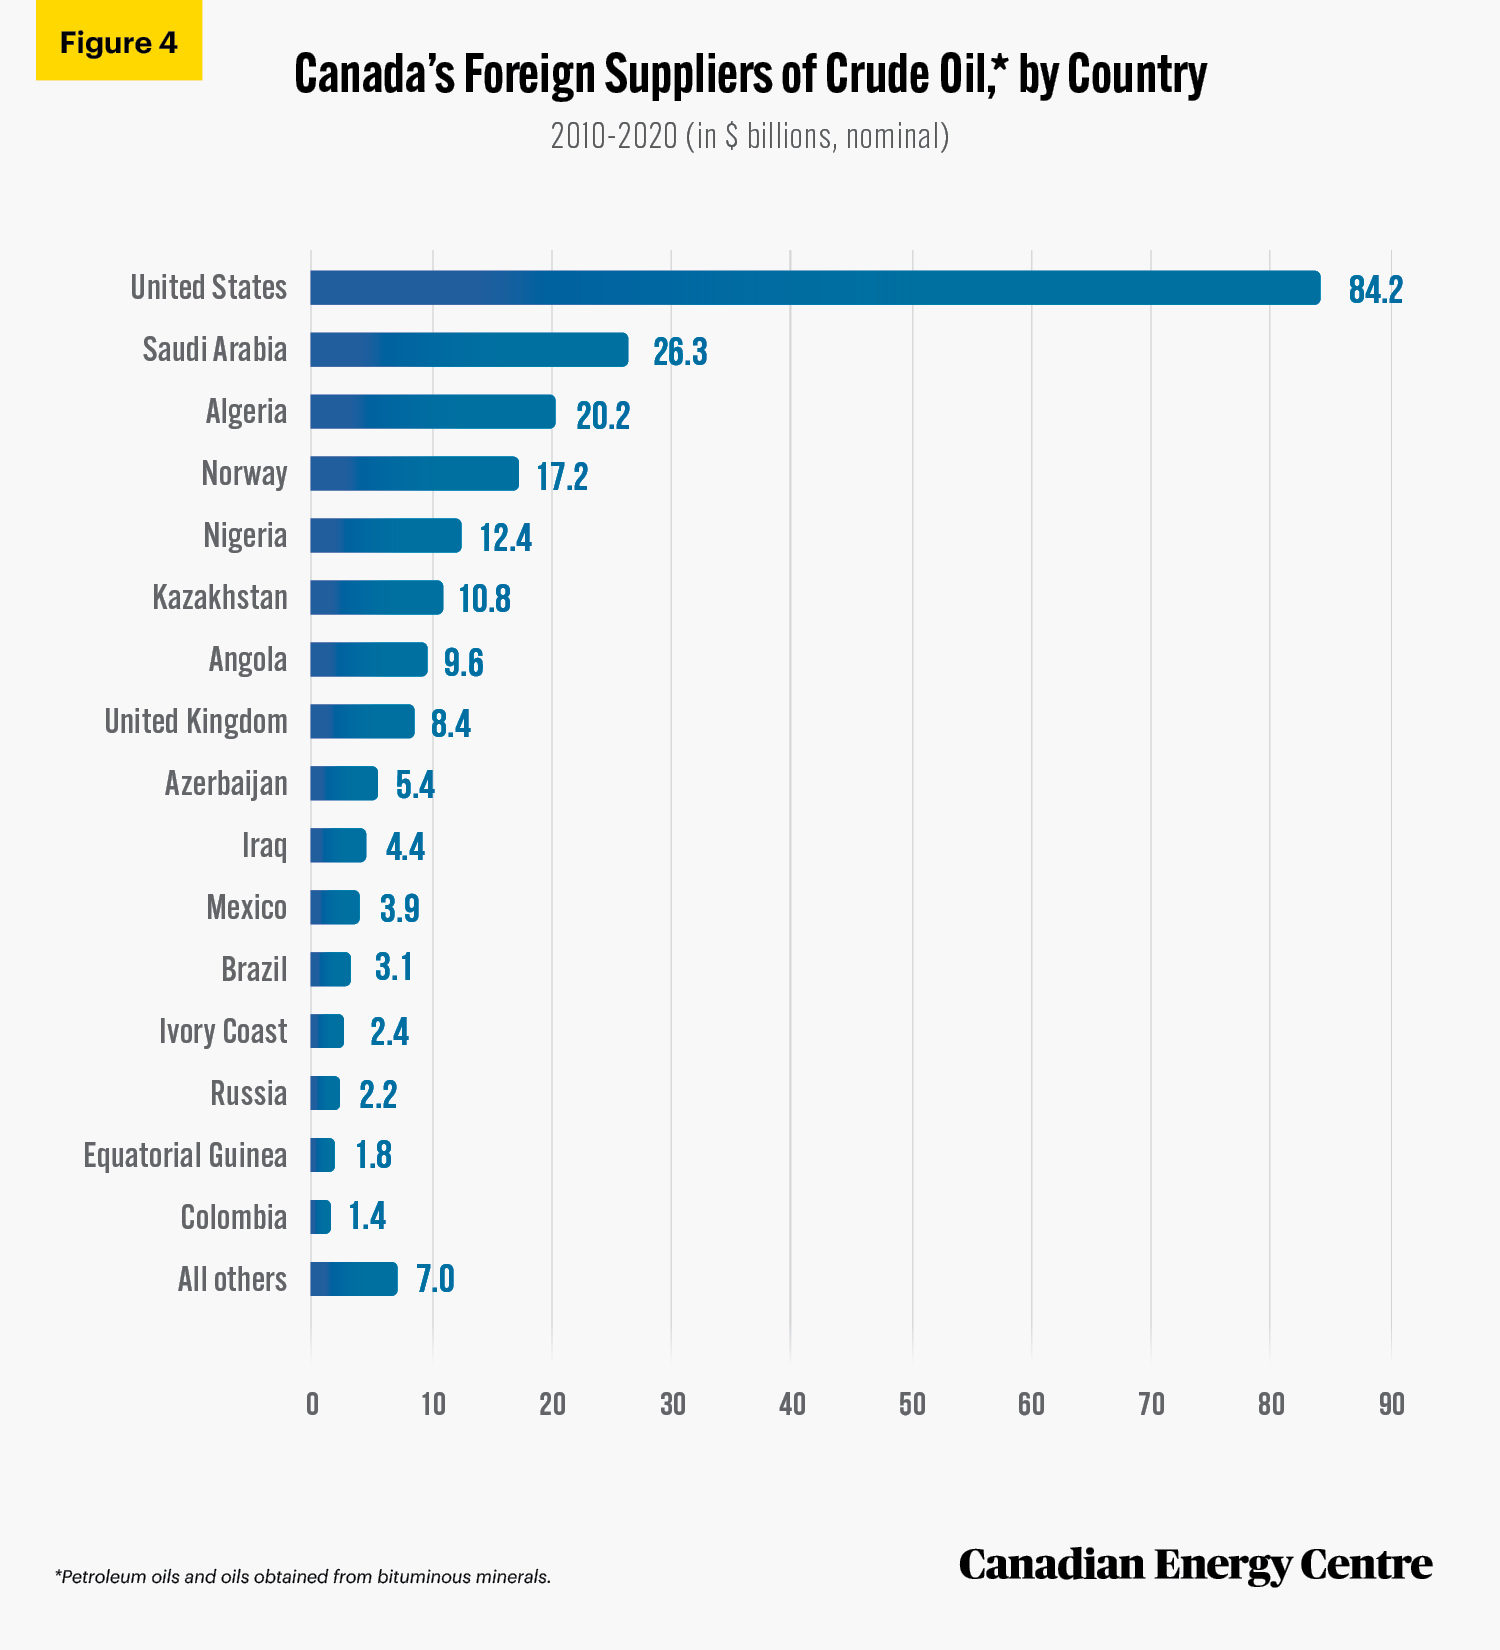
Derived from Statistics Canada, Canadian International Merchandise Trade Database.
Imports of crude oil compared with imports from other key sectors, 2010 to 2020
Canada spent nearly $238 billion on crude oil imports between 2010 and 2020 (see Figure 5). This is:
- Higher than the almost $192 billion Canada spent on farm, fishing, and intermediate food products imports;
- Higher than the nearly $205 billion Canada spent on aircraft and other transportation equipment and parts imports; and
- Just below the $256 billion Canada spent on forestry products and building and packaging materials imports.
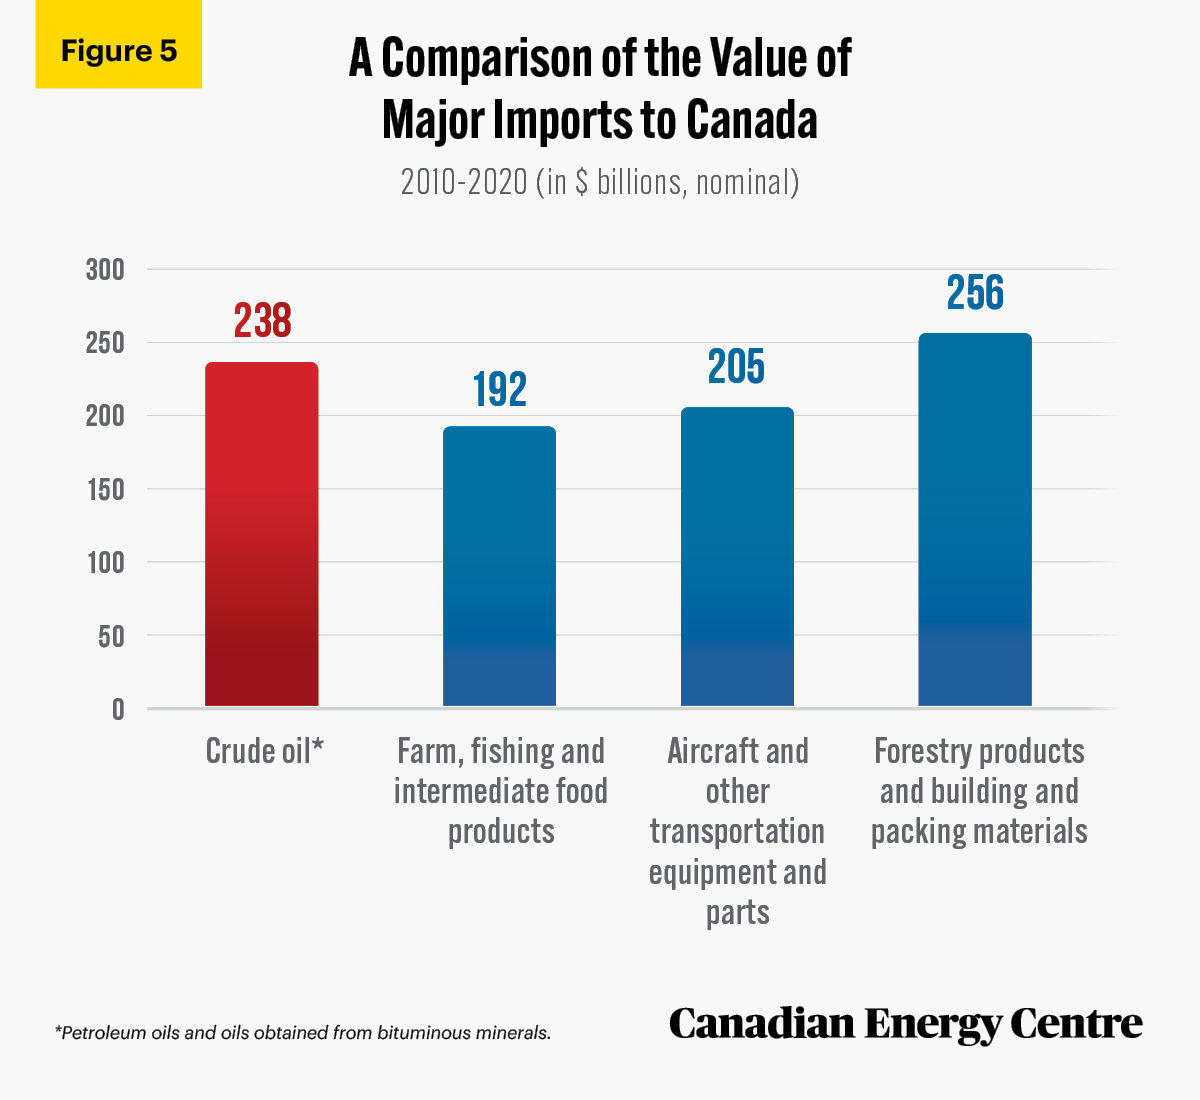
Source: Derived from Statistics Canada, Canadian International Merchandise Trade Database
Comparing imports of oil from Saudi Arabia worth over $26 billion with other imports
Between 2010 and 2020, Canada spent over $26.3 billion on crude oil imported from Saudi Arabia (see Figure 6). This $26.3 billion expenditure is larger than the:
- $1.7 billion Canada spent importing coffee from Brazil;
- $2.5 billion Canada spent importing coffee from Colombia;
- $7.8 billion Canada spent importing fruits, nuts, citrus fruits, and melons from Mexico;
- $9.2 billion Canada spent importing edible vegetables and certain roots and tubers from Mexico;
- $16.4 billion Canada spent importing footwear from China; and
- $19.9 billion Canada spent importing pharmaceutical products from Germany
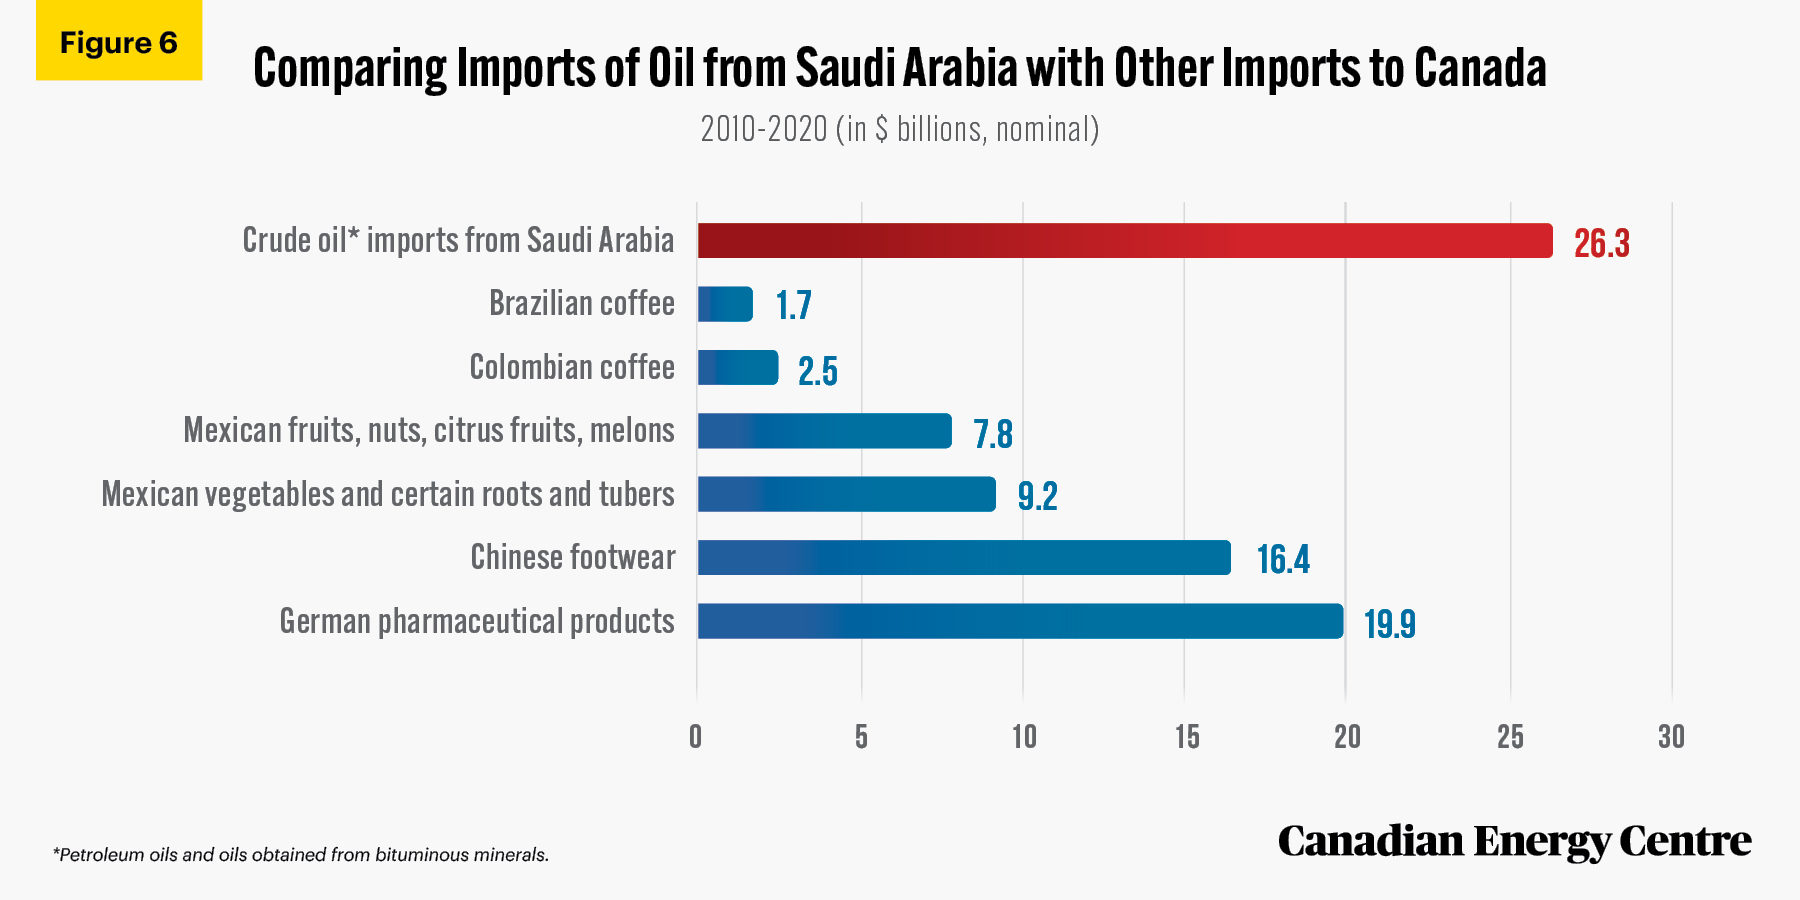
Source: Derived from Statistics Canada, Canadian International Merchandise Trade Database
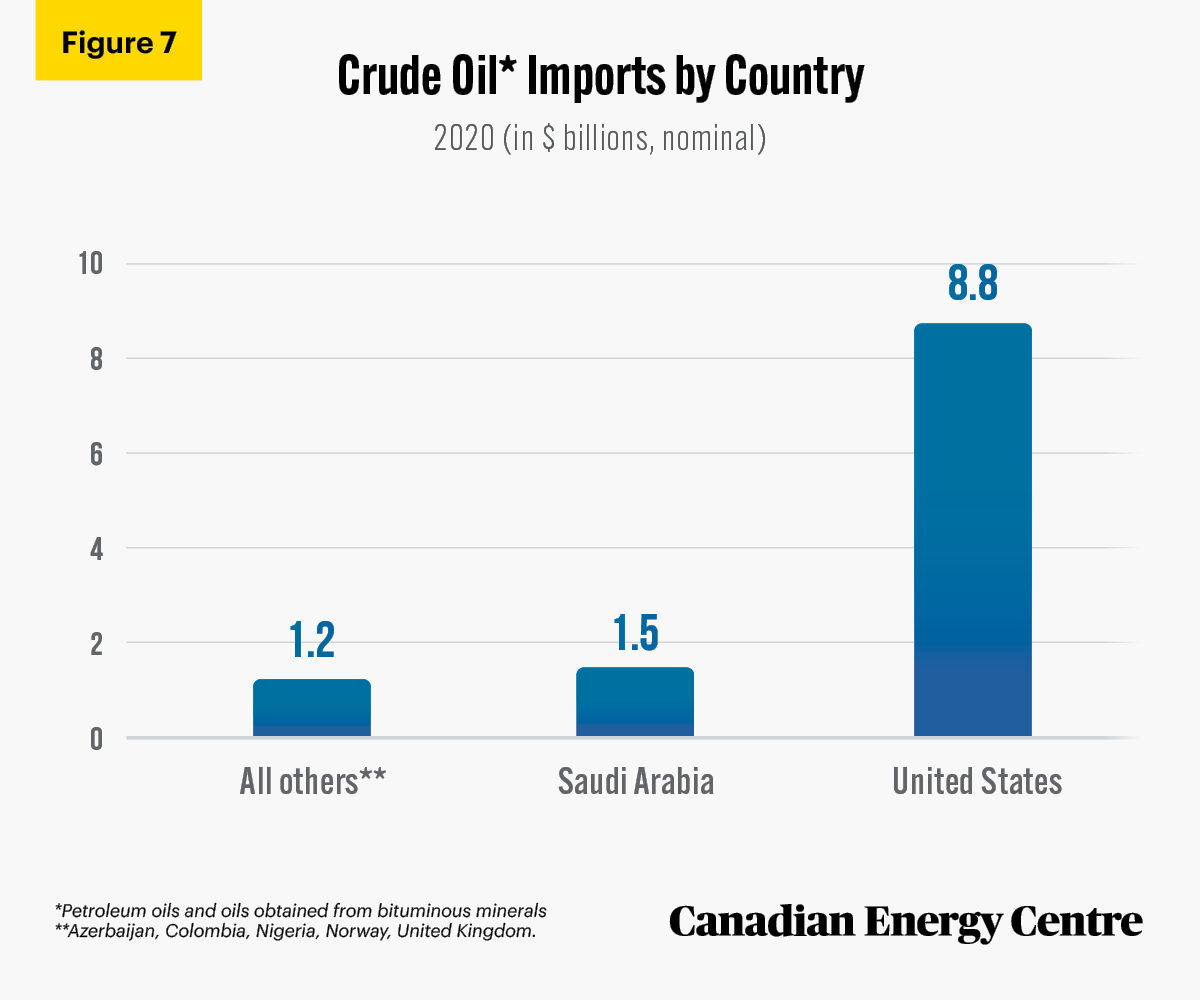
A 2020 snapshot: 89% of all the oil imported to Canada comes from the U.S. and Saudi Arabia
In 2020, the U.S. was Canada’s largest source of foreign crude oil at a value of nearly $8.8 billion, followed by Saudi Arabia at a value of $1.5 billion (see Figure 7). Together, these two countries were the sources of about 89 per cent of all the oil imported by Canada, or nearly $10.3 billion of the $11.5 billion total value of that oil in 2020. Other countries were very distant thirds as sources for crude, such as Nigeria (at a value of $611 million), Norway ($345 million), and the United Kingdom ($63 million).
Source: Derived from Statistics Canada, Canadian International Merchandise Trade Database
Conclusion
Imports of crude oil to Canada have been rising over the past two decades and the value remains high ($11.5 billion in 2020) despite the decline in crude oil prices beginning in 2014 and continuing with the onslaught of COVID-19 in 2020.
While Canada is among the world leaders in both crude oil reserves and crude oil production, it spent $488 billion between 1988 and 2020 to bring in crude oil from such countries as Saudi Arabia, Russia, Azerbaijan, Nigeria, Algeria, Angola, Venezuela, and Kazakhstan, along with United Kingdom, Norway and, more recently, the United States.
Quebec has been the largest importer of foreign oil between 1988 and 2020 (45 per cent of the total imported to Canada), at a value of $228 billion.
The value of foreign oil imports per household, using 2016 census data, was $1,021 per household (nationally, including Quebec) and $1,576 per household annually specific to Quebec.
Notes
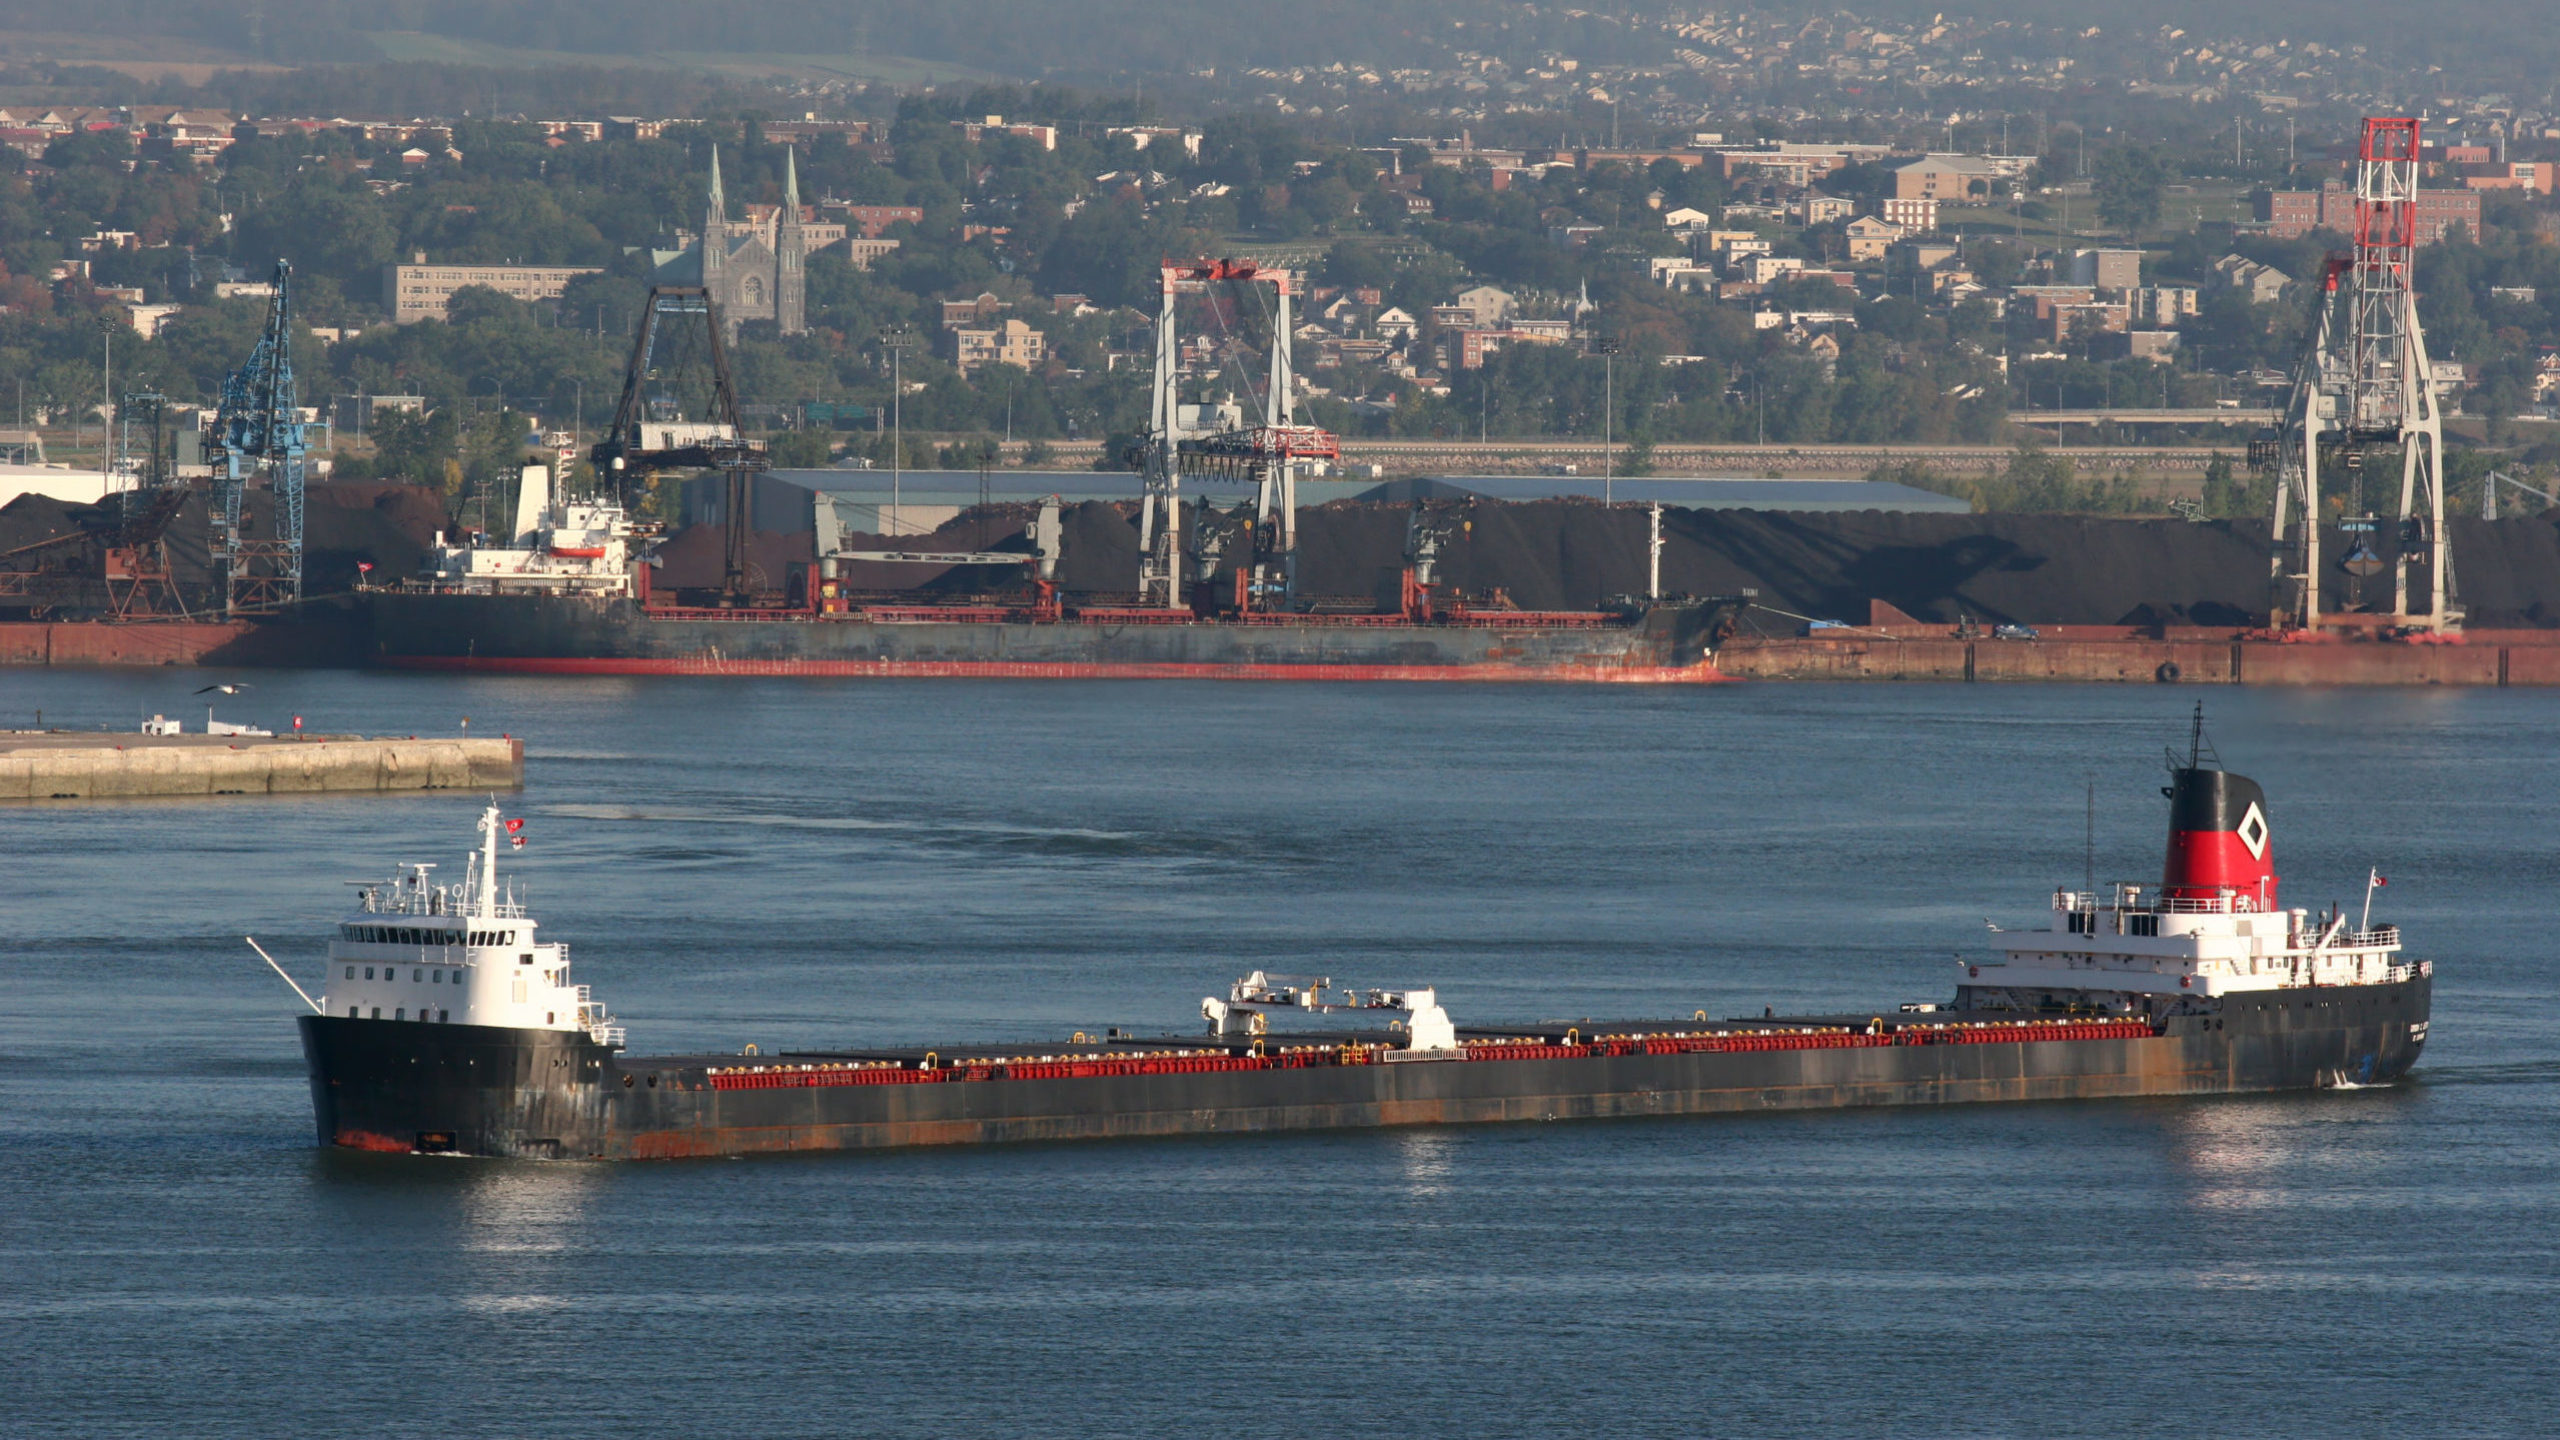
This CEC Fact Sheet was compiled by Lennie Kaplan and Mark Milke at the Canadian Energy Centre (www.canadianenergycentre.ca). The authors and the Canadian Energy Centre would like to thank and acknowledge the assistance of Philip Cross in reviewing the original data and research for this Fact Sheet. Photo credits: Lewis Pratt from Unsplash.com
References (All links live as of July 8, 2021)
Statistics Canada (undated), Canadian International Merchandise Trade Database <https://bit.ly/37XDr7y>; Statistics Canada (undated), Table 12-10-0133-01: Canadian international merchandise trade by province and country, and by product sections, customs-based, annual <https://bit.ly/3g12J8g>; Statistics Canada (2017), Families, Households and Marital Status Highlight Tables, 2016 Census <https://bit.ly/2YppR9B>; U.S. Energy Information Administration (2020), International: Petroleum and Other Liquids <https://bit.ly/2QeWang>.
Creative Commons Copyright
Research and data from the Canadian Energy Centre (CEC) is available for public usage under creative commons copyright terms with attribution to the CEC. Attribution and specific restrictions on usage including non-commercial use only and no changes to material should follow guidelines enunciated by Creative Commons here: Attribution-NonCommercial-NoDerivs CC BY-NC-ND.