Social
To sign up to receive the latest Canadian Energy Centre research to your inbox email: research@canadianenergycentre.ca
Download the PDF here
Download the charts here
Overview
There has a lot of discussion about the role that carbon capture, utilization and storage (CCUS) will play in reducing global greenhouse gas emissions.
In this Canadian Energy Centre (CEC) Fact Sheet, using the Rystad Energy CCUS Solution, we examine projected trends in global and Canadian carbon capture capacity and spending to date between 2023 and 2030.
The written content in this report has been prepared by the CEC and does not represent the views of Rystad Energy.
Background on the Rystad Energy CCUS Solution
The Rystad Energy CCUS Solution provides data covering carbon capture, transportation, and storage for both commercial and pilot projects, including analysis of such key indicators as carbon capture capacity and spending to date on CCUS.
These capabilities allow us to analyze short- and long-term CCUS capacity and spending to date under various global decarbonization scenarios, including net zero (Rystad Energy, 2023).
Potential for CCUS to capture 623 mtpa of CO2 globally through 2030
According to Rystad Energy, at the end of 2022, there were 65 commercial CCUS projects in operation globally capable of capturing nearly 41 million tonnes per annum (mtpa) of CO2 across various industries, including the oil and gas sector.
There are another 478 projects in various stages of development in the global pipeline that will be capable of capturing roughly another 559 mtpa. Some of these projects are currently in various stages of development, including in the feasibility stage, while others are in the concept and construction phases (Rystad Energy, 2023).
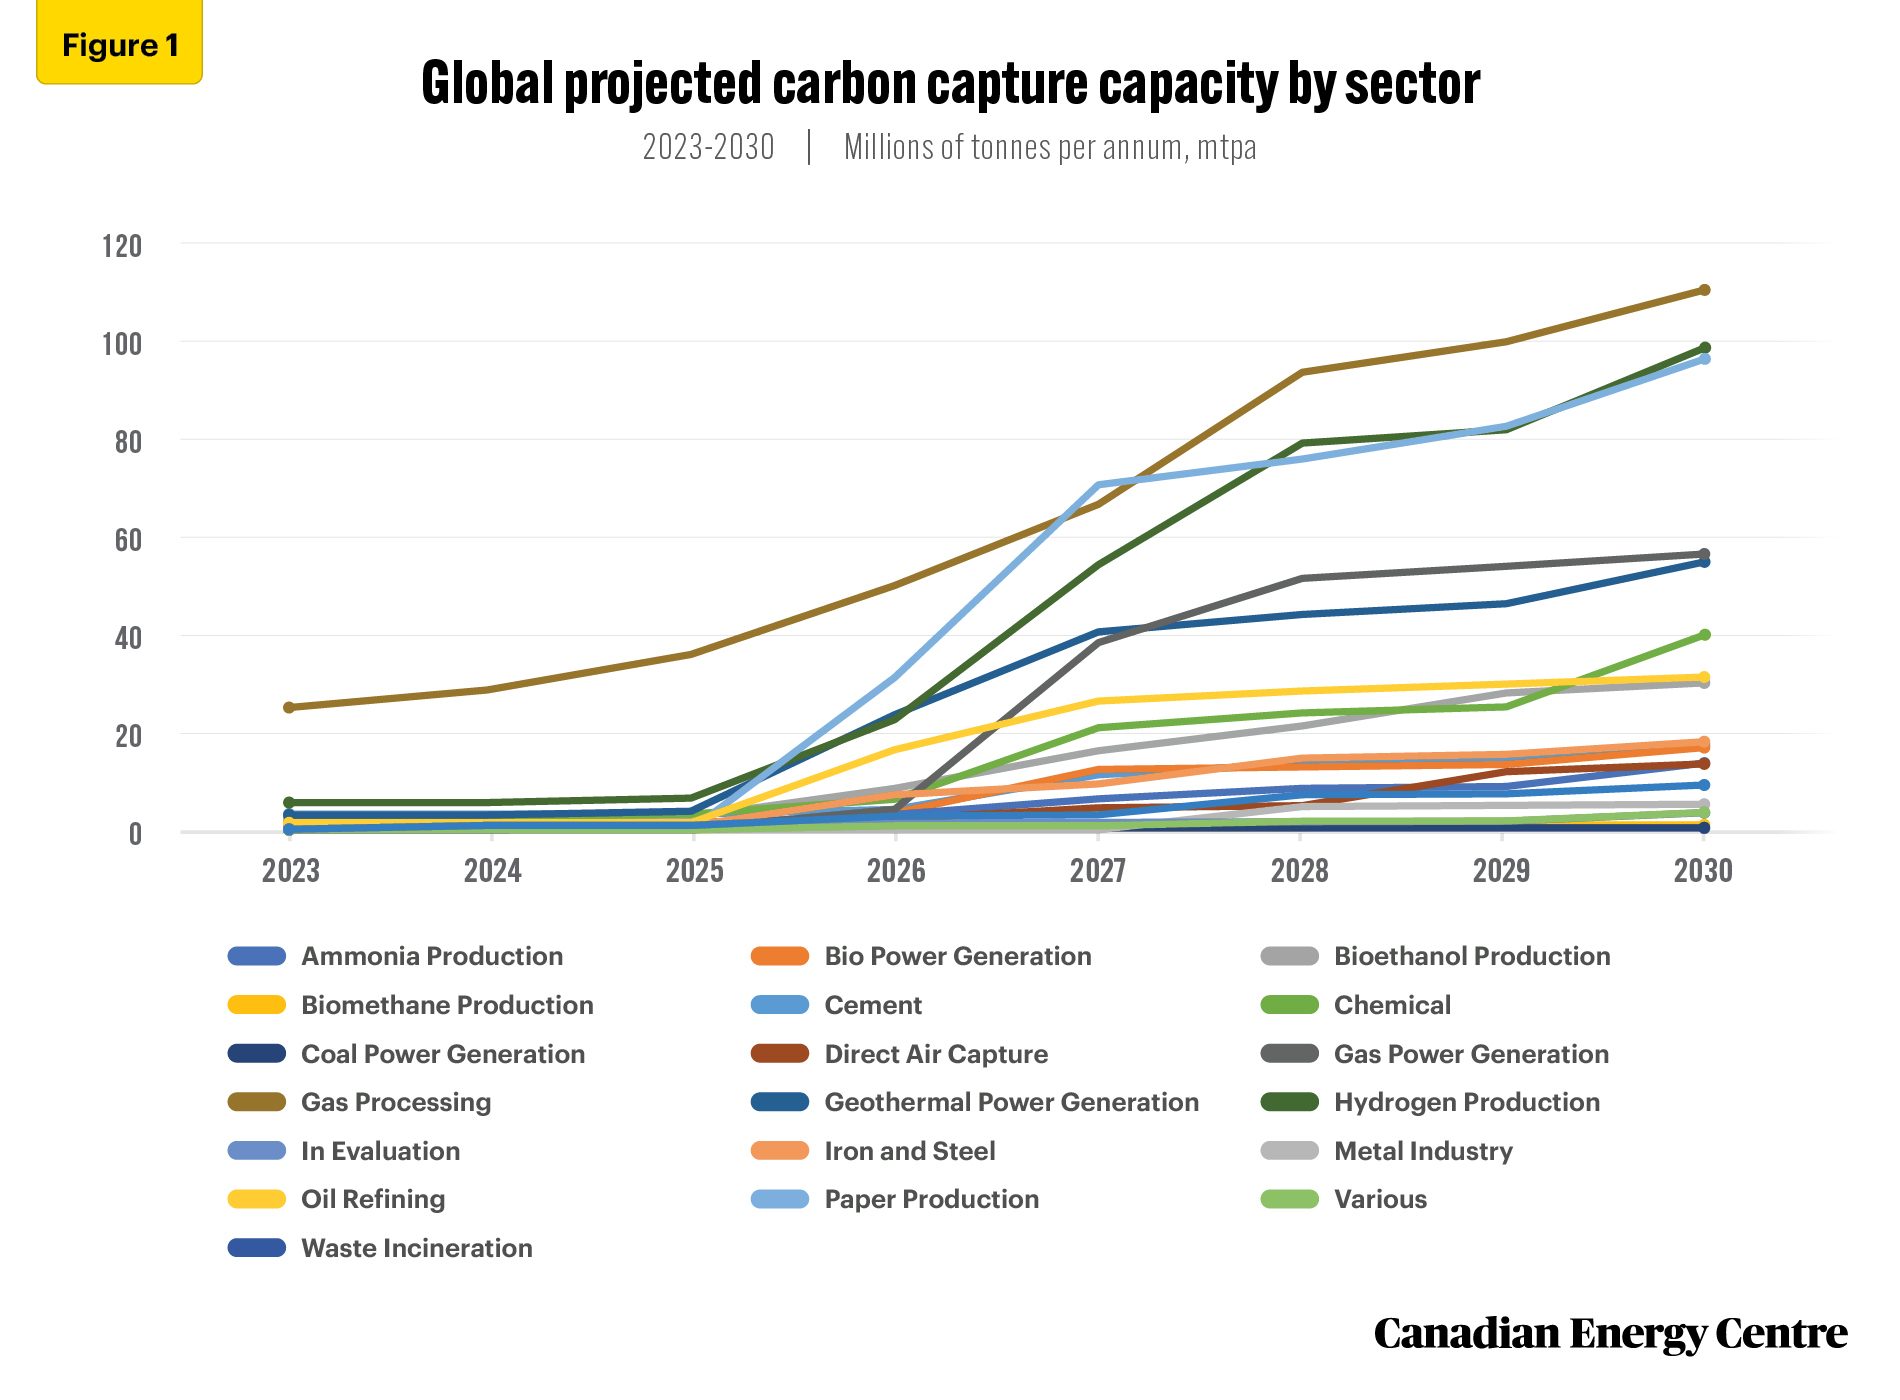
Figure 1 breaks down global carbon capture capacity by sector. By 2030, it is estimated that nearly 500 CCUS projects could be operation worldwide, having the ability to capture 623.0 mtpa of CO2, if all projects move ahead as scheduled (see Figure 1).
In fact, between 2023 and 2030, global carbon capture capacity could grow from 43.5 mtpa to 623.0 mtpa, an increase of over 1,332 per cent.
Oil and gas sector global carbon capture capacity will reach over 140 mtpa by 2030
Beyond carbon capture capacity that is still being evaluated, the sectors which are expected to experience the greatest growth between 2023 and 2030 are hydrogen production (5.5 mtpa rising to 98.7 mtpa); gas processing (24.7 mpta rising to 110.0 mtpa); and coal power generation (3.0 mtpa rising to 55.0 mtpa).
Carbon capture capacity in oil refining is anticipated to grow from 1.4 mtpa in 2023 to 30.4 mtpa in 2030, meaning that carbon capture capacity in oil refining and gas processing combined will grow from 26.1 mtpa to 140.4 mtpa (see Figure 1).
Source: Derived from the Rystad Energy CCUS Solution
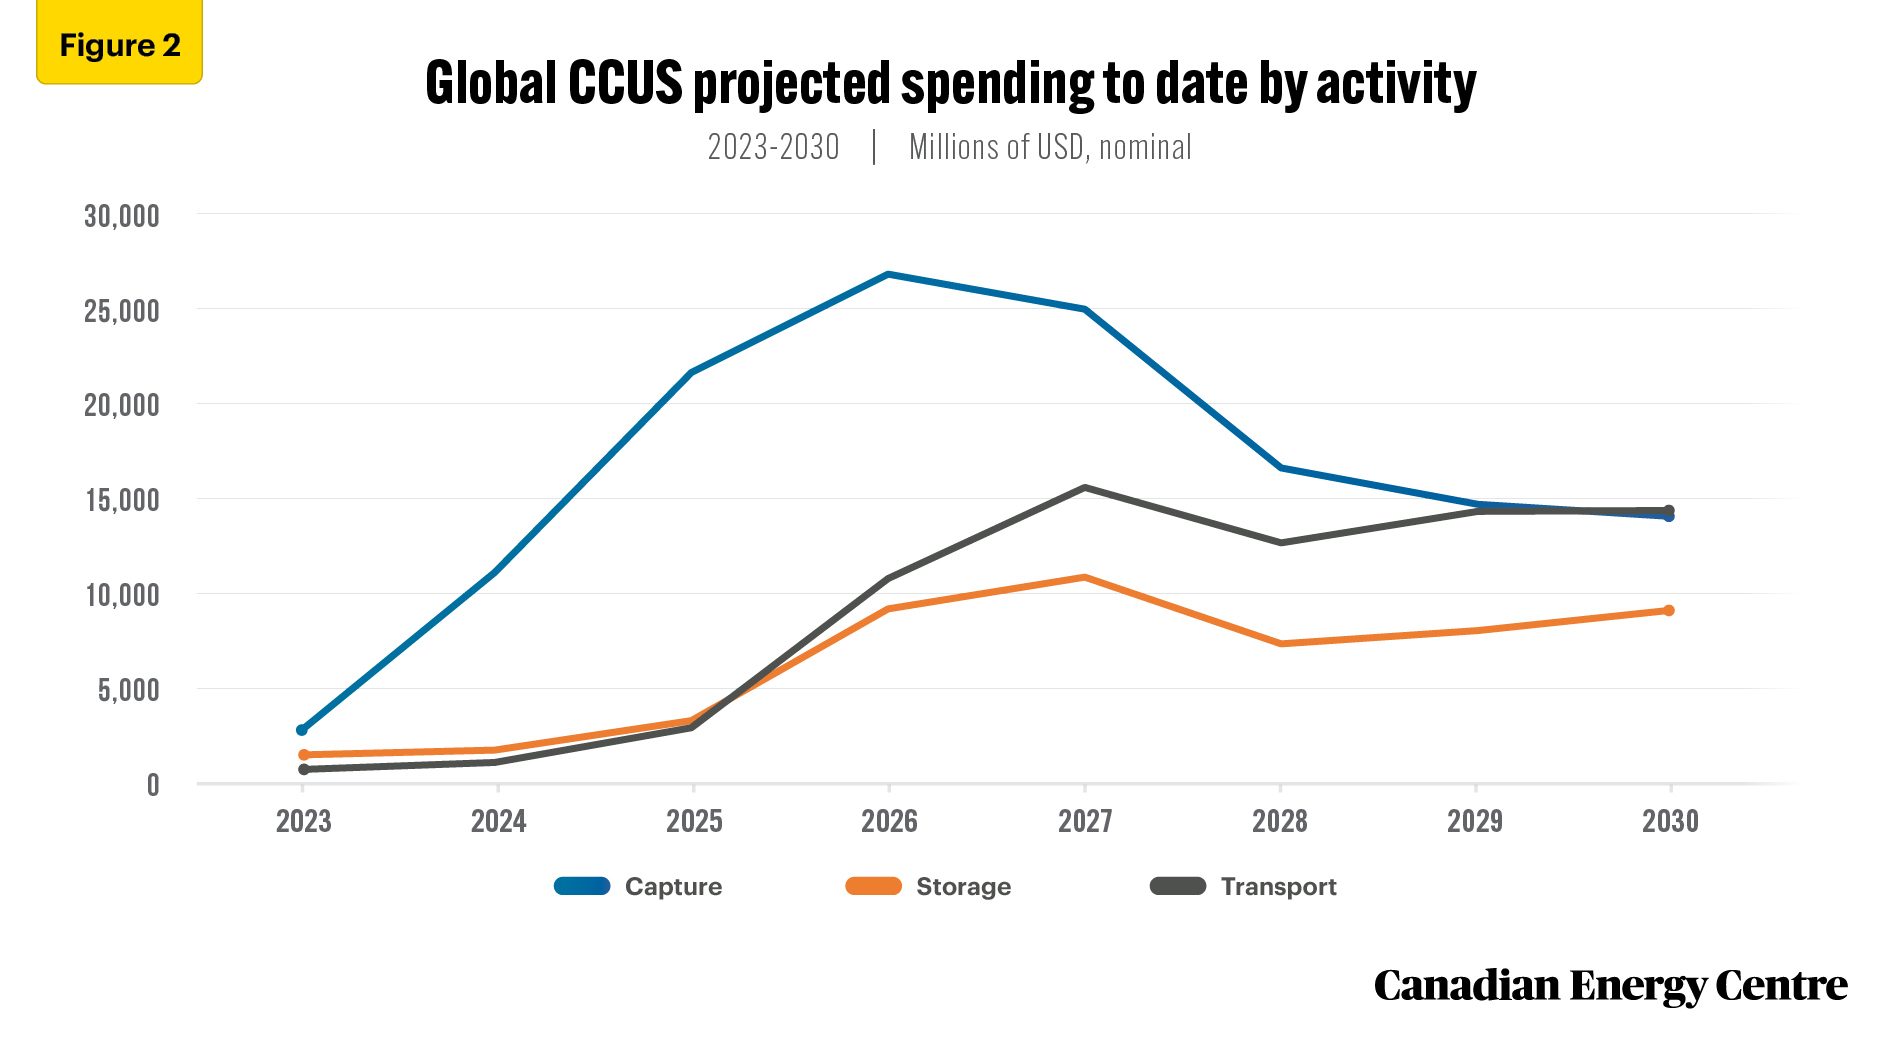
Global spending on CCUS could reach over $256 billion to date through 2030
Projected spending to date on CCUS is set to expand significantly between 2023 and 2030, increasing from $4.7 billion in 2023 to $37.7 billion in 2030, an increase of about 702 per cent. In fact, cumulative spending to date on CCUS between now and 2030 is projected at over $256 billion (see Figure 2).
About 52 per cent of cumulative CCUS spending to date between 2023 and 2030 (about $133 billion) will go towards the CO2 capture segment. Spending on CO2 capture rises from $2.6 billion in 2023 to $14.4 billion in 2030, an increase of nearly 4,539 per cent (see Figure 2).
Source: Derived from the Rystad Energy CCUS Solution
Transport is the second largest segment of projected CCUS spending between 2023 and 2030, at about 28 per cent of total spending, or $72.5 billion cumulative.
The storage segment will see projected spending of 20 per cent, or $51.0 billion cumulative through 2030 (see Figure 2).
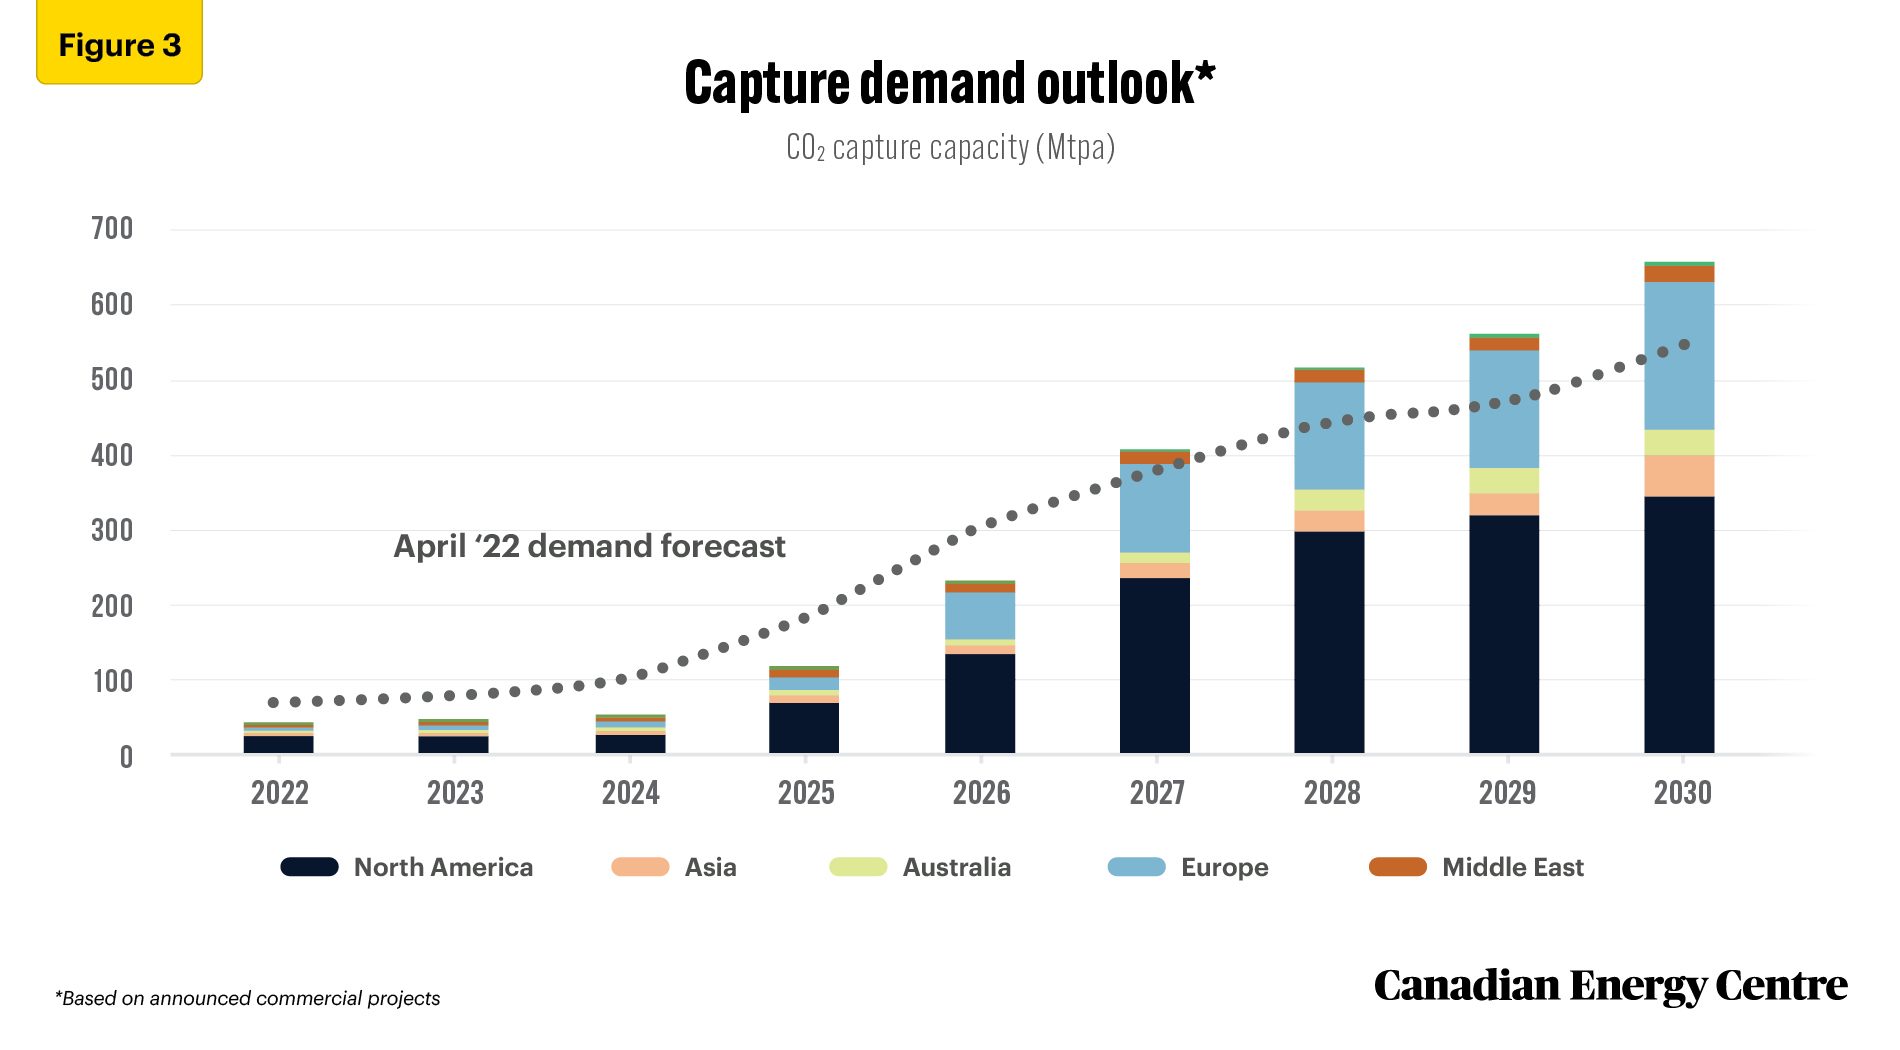
According to Rystad Energy, North America and Europe are expected to continue to dominate the global CCUS market through 2030 (see Figure 3).
Source: Rystad Energy research and analysis, CCUS Market dashboard
Implications for Canada
Global carbon capture capacity and worldwide spending to date trends underline the fact that the future is bright for Canadian investments in CCUS. Assuming that appropriate government policies and regulations are put in place, Canada can expect to see further project announcements and increased investment.
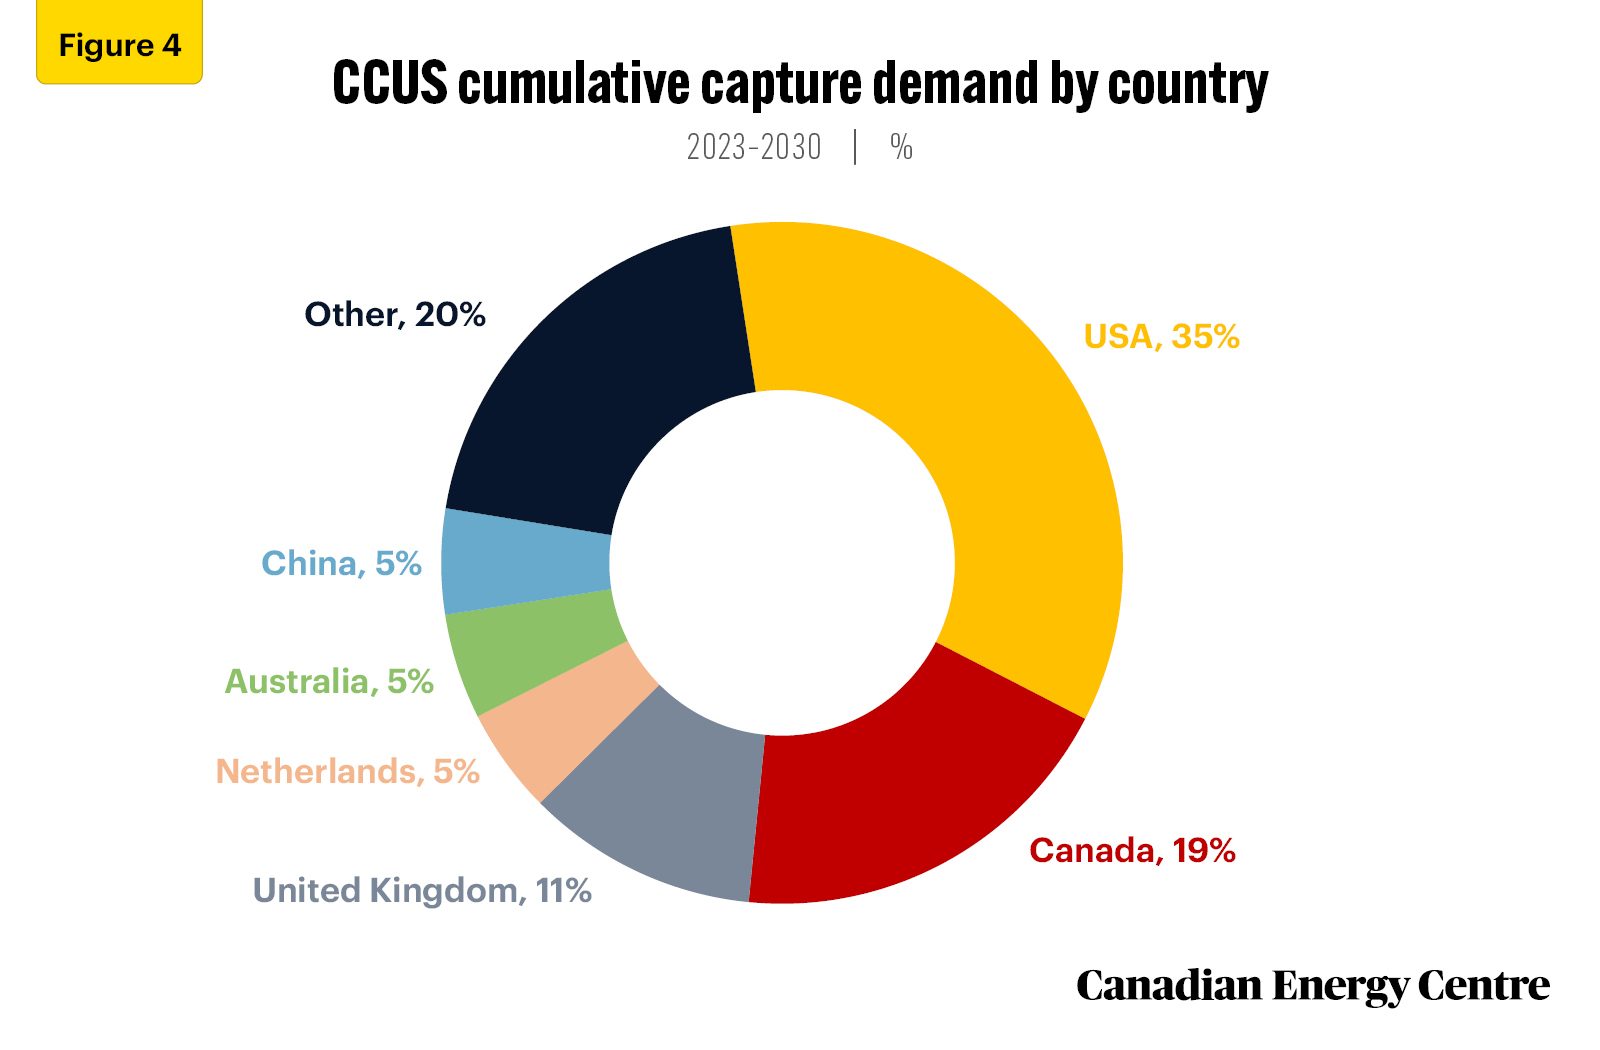
In fact, according to Rystad Energy, “Canada will likely emerge as a CCUS heavyweight given the prevailing policy environment and the existential need for oil sands players to decarbonize. Rystad Energy estimates that Canada alone could account for around 20 per cent of cumulative carbon capture demand between 2023 and 2030” (see Figure 4).
Source: Rystad Energy CCUSCube
Notes
This CEC Fact Sheet was compiled by Lennie Kaplan at the Canadian Energy Centre (www.canadianenergycentre.ca). The author and the Canadian Energy Centre would like to thank and acknowledge the assistance of two anonymous reviewers in reviewing the data and research for this Fact Sheet.
The written content in this report was prepared by the Canadian Energy Centre (CEC) and does not represent the views of Rystad Energy.
References (links live as of March 8, 2023)
Rystad Energy (2023a). CCUS Solution. 2023. <http://bit.ly/3YT5Hlu>; Rystad Energy (2023b). Five key trends to watch in Canada’s upstream oil and gas sector in 2023. <https://bit.ly/3YT5Hlu>.
Creative Commons Copyright
Research and data from the Canadian Energy Centre (CEC) is available for public usage under creative commons copyright terms with attribution to the CEC. Attribution and specific restrictions on usage including non-commercial use only and no changes to material should follow guidelines enunciated by Creative Commons here: Attribution-NonCommercial-NoDerivs CC BY-NC-ND.