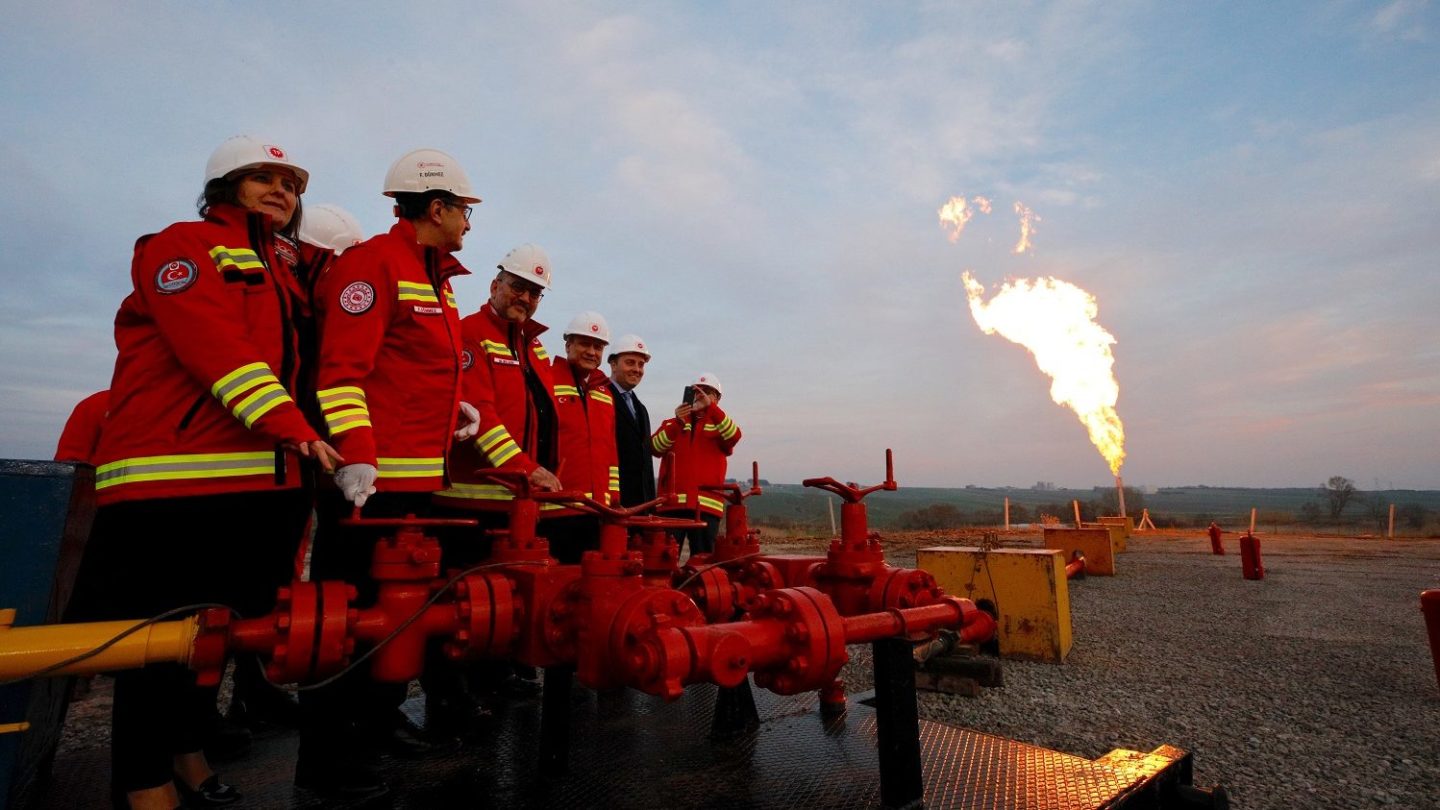
Social
Canada’s oil and gas industry is among the best in the world when it comes to reducing air emissions from flaring, according to a new analysis by the Canadian Energy Centre.
Flaring is the controlled burning of waste gases from oil and natural gas operations, resulting in the release of greenhouse gases (GHGs) and other emissions. In 2018, 145 billion cubic metres (bcm) of flared gases were emitted worldwide, resulting in just under 280 megatonnes of CO2-equivalent GHG emissions — approximately one per cent of global GHGs.
Data from the World Bank and U.S. Energy Information Administration show that Canada ranks 22nd out of the world’s top 30 countries for flaring, despite being the fourth-largest oil and gas producer. Canada’s flaring emissions were 1.3 bcm in 2018, while Russia was the highest at 21.3 bcm, followed by Iraq (17.8 bcm), Iran (17.3 bcm) and the United States (14.1 bcm).
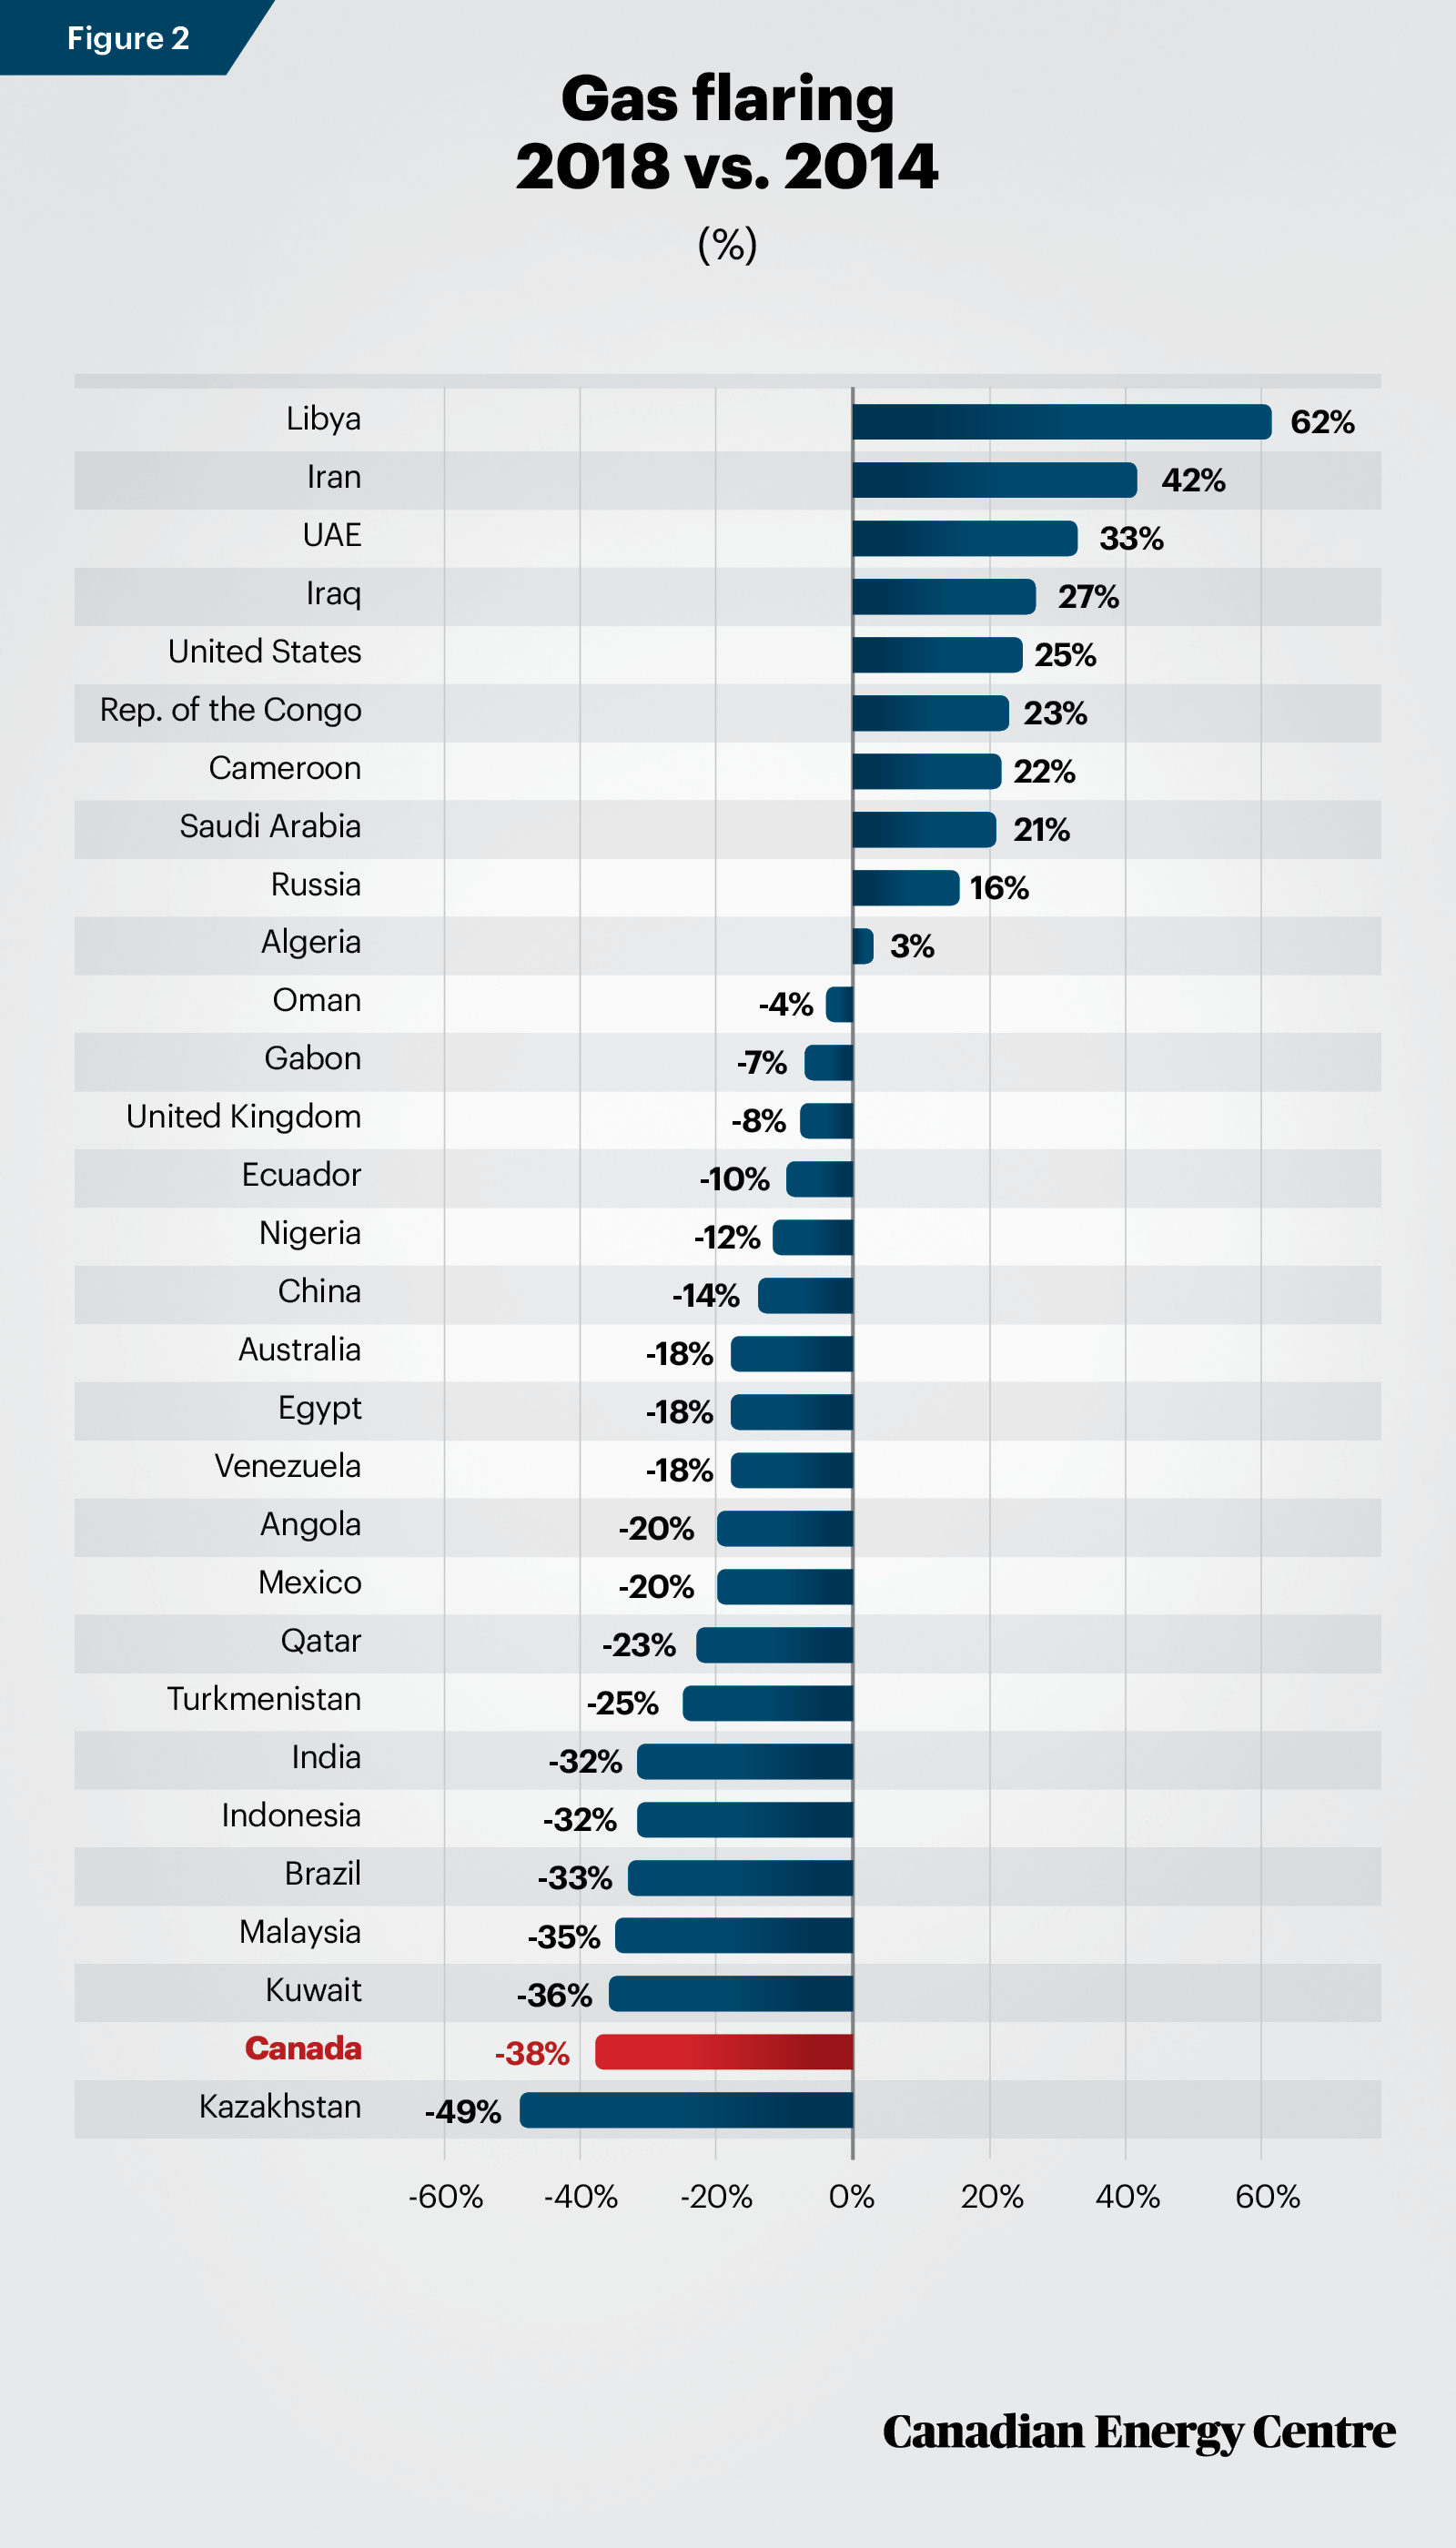
Canada also showed the second-largest decrease in flaring over the five years between 2014 and 2018 – a 38 per cent decrease, second only to Kazakhstan which reduced flaring by 49 per cent. The magnitude of this decrease is significant because it occurred at the same time as petroleum and other liquids production in Canada rose by 22 per cent while dry natural gas production rose by 16 per cent.
———————————————————————————
This Fact Sheet (which can be downloaded here as a pdf) analyzes the record on flaring and venting of gases in Canada’s upstream oil and gas industry relative to other countries. The issue, while technical in nature, is relevant given that this is a source of greenhouse gas emissions (GHGs). For example, in 2018, 145 billion cubic metres (bcm) of flared gases were emitted worldwide, or just under 280 megatonnes of CO2 equivalent. It is also relevant given that Canada is a major producer of oil and natural gas, with the third-largest proven reserves of crude oil and the 17th largest reserves of natural gas, and the fourth-largest producer of both commodities.
Background
Flaring and venting are two ways in which an oil or natural gas producer can dispose of waste gases. (Venting is the intentional controlled release of un-combusted gases directly to the atmosphere, and flaring is a disposal by combustion of natural gas or gas derived from petroleum.¹) As Matthew R. Johnson and Adam R. Coderre noted in their 2012 paper on the subject, flaring in the petroleum industry generally falls within three broad categories:
- Emergency flaring (large, unplanned, and very short-duration releases, typically at larger downstream facilities;
- Process flaring (intermittent large or small releases that may last for a few hours or a few days, as occurs in the upstream industry during well-test flaring to assess the size of a reservoir or at a downstream plant during a planned process blowdown); and,
- Production flaring (which may occur continuously for years as the resource, oil, is being produced).
1. Many provinces regulate flaring and venting including Alberta (Directive 060) British
Columbia (Flaring and Venting Reduction Guideline), and Saskatchewan (S-10 and S-20).
Newfoundland & Labrador also has regulations that govern offshore flaring.
To track GHGs from flaring and venting, Environment Canada defines such emissions as:
- Fugitive emissions: Releases from venting, flaring or leakage of gases from fossil fuel production and processing; iron and steel coke oven batteries; CO2 capture, transport, injection, and storage infrastructure.
- Flaring emissions: Controlled releases of gases from industrial activities, from the combustion of a gas or liquid stream produced at the facility, the purpose of which is not to produce useful heat or work. This includes releases from waste petroleum incineration; hazardous emission prevention systems (in pilot or active mode); well testing; natural gas gathering systems; natural gas processing plant operations; crude oil production; pipeline operations; petroleum refining; chemical fertilizer production; and steel production.
- Venting emissions: Controlled releases of a process or waste gas, including releases of CO2 associated with carbon capture, transport, injection, and storage; from hydrogen production associated with fossil fuel production and processing; of casing gas; of gases associated with a liquid or a solution gas; of treater, stabilizer or dehydrator off-gas; of blanket gases; from pneumatic devices which use natural gas as a driver; from compressor start-ups, pipelines, and other blowdowns; and from metering and regulation station control loops.
Flaring comparisons
This Fact Sheet provides international data comparisons on flaring only (given limited international data on venting) based on World Bank data. It also compares flaring by country with production for major petroleum (and others liquids) producing countries using U.S. Energy Information Administration (IEA) data.
Table 1 shows gas flaring volumes in 2014 and 2018. In absolute terms, Russia recorded more flaring than any other country at 21.3 billion cubic metres (bcm) in 2018, three bcm or 16 per cent higher than in 2014. Among the 30 countries measured, Australia flared the least at 0.9 bcm or 18 per cent less than in 2014. Canada was the 22nd lowest in 2018 at 1.3 bcm, and recorded a decrease of 0.8 bcm from 2.1 bcm in 2014, or 38 per cent.
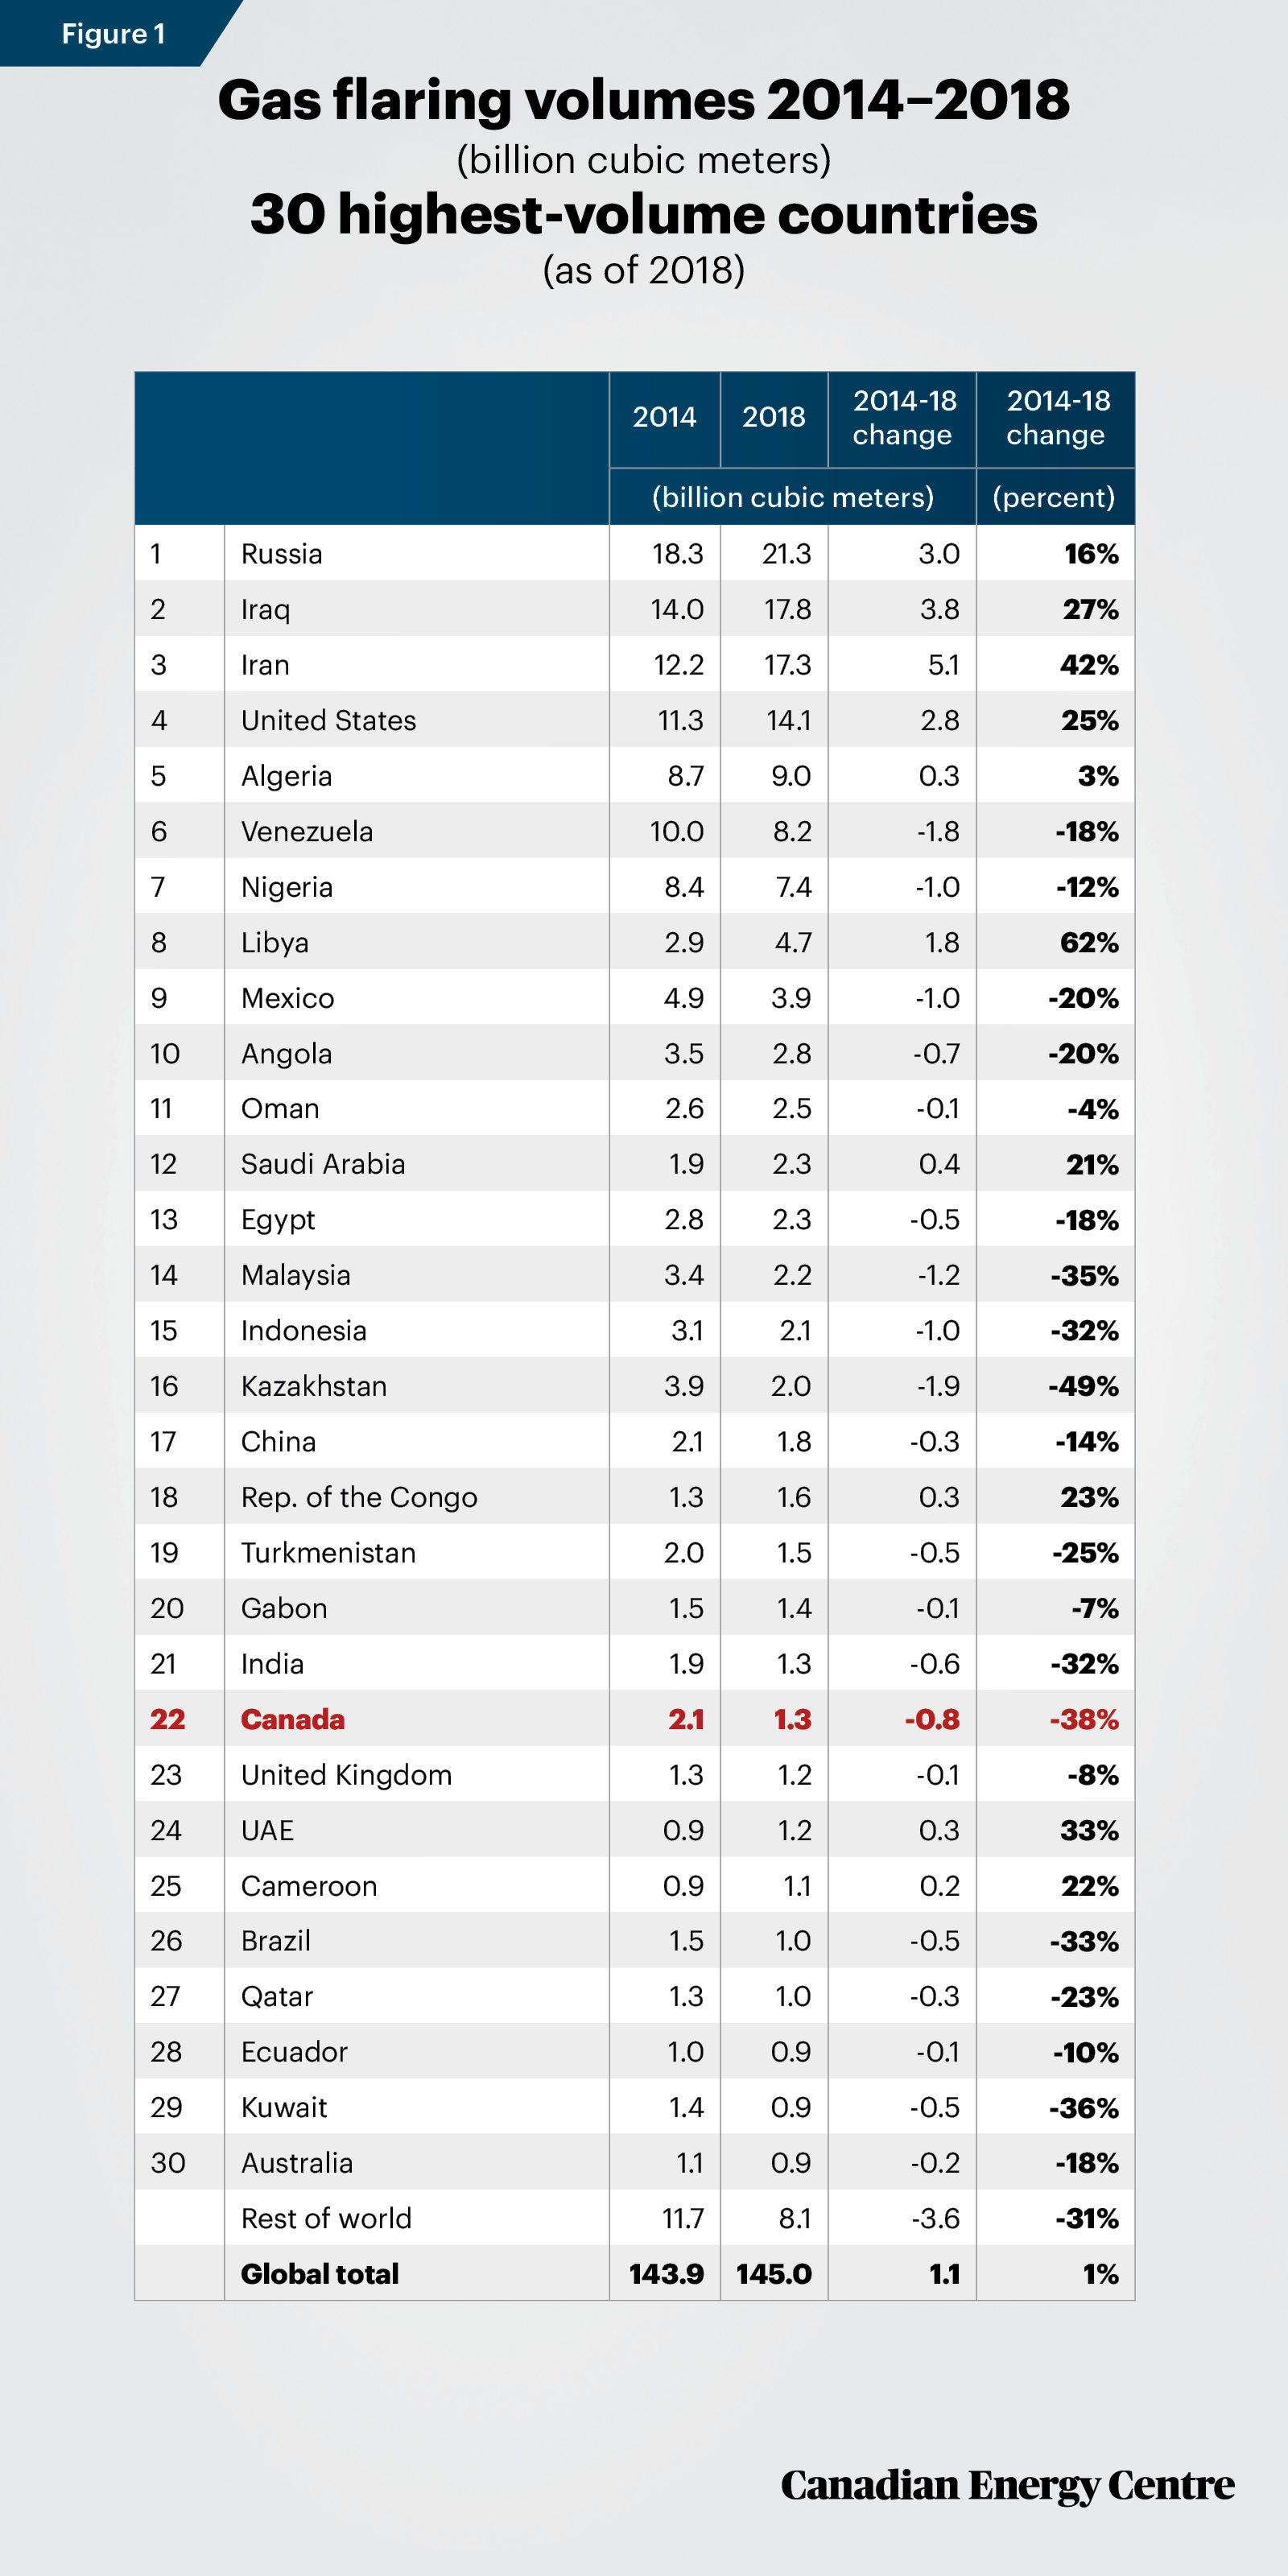
Source: World Bank
Ten countries flared more in 2018; 20 countries flared less
Figure 2 also shows changes in flaring volumes. In total, ten countries flared more in 2018 compared with 2014, while 20 countries flared less.
• The countries that showed the greatest increase in flaring were the United Arab Emirates (33 per cent), Iran (42 per cent) and Libya (62 per cent).
• The countries that showed the greatest decrease in flaring were Kazakhstan (-49 per cent), Canada (-38 per cent) and Kuwait (-36 per cent).
Source: World Bank
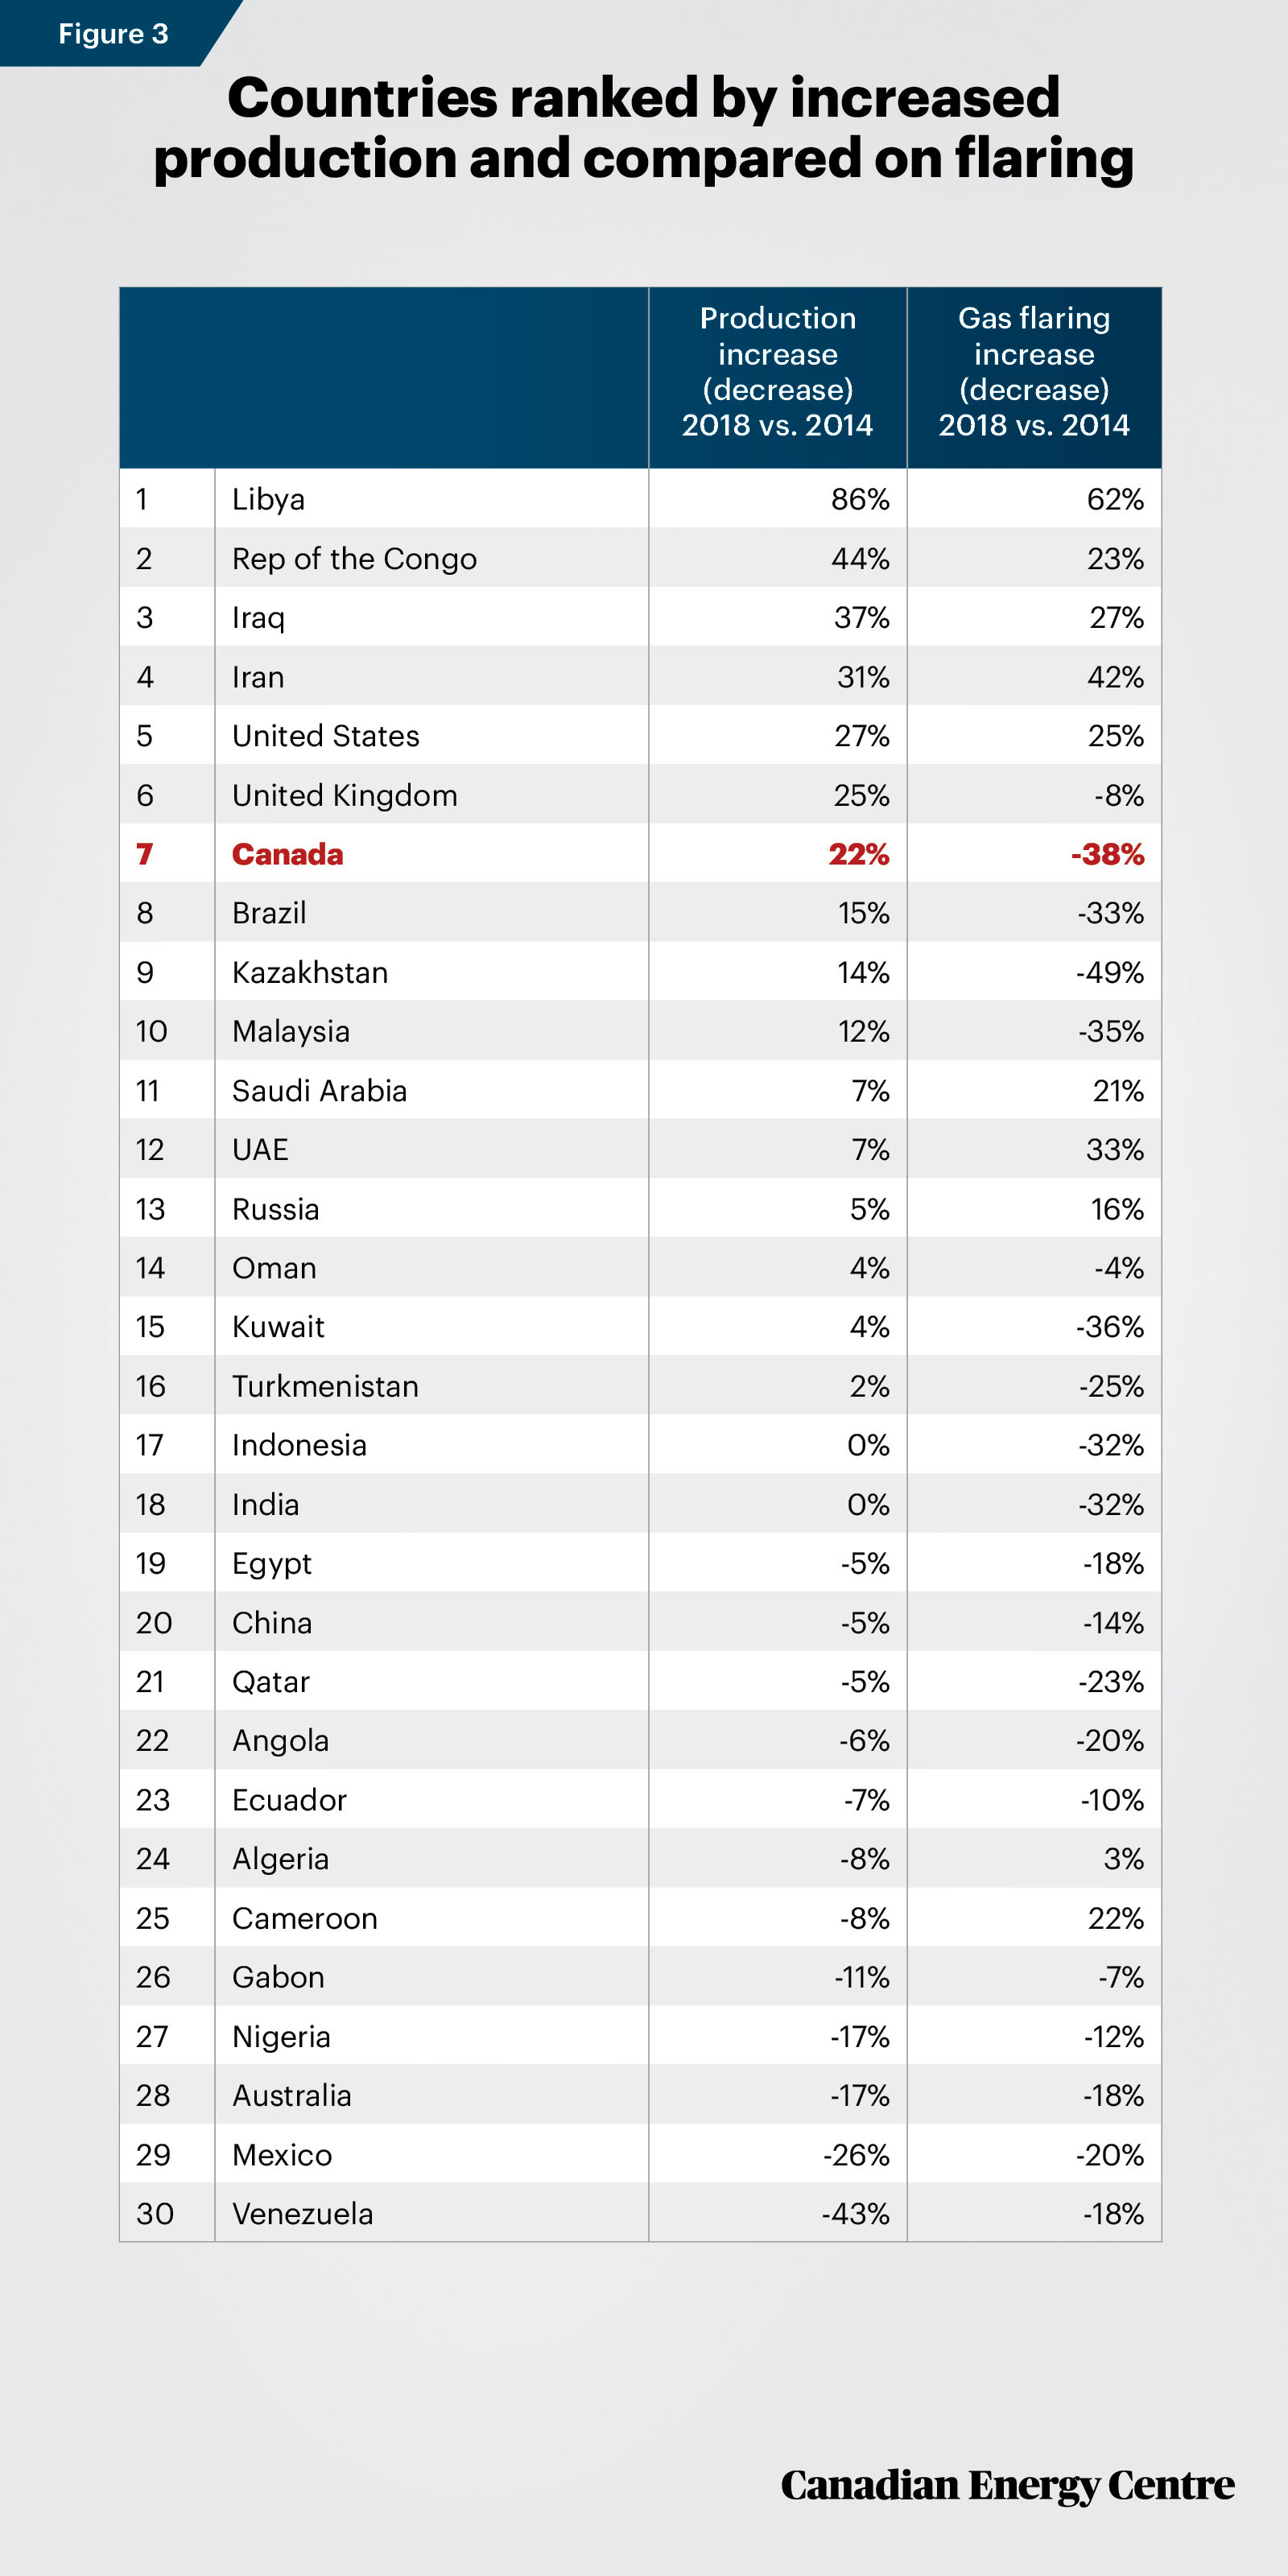
Figure 3: Comparing flaring to increased production
• The decreases for Canada in Figures 1 and 2 understate the magnitude of the decrease in flaring between 2014 and 2018. The reason for that is that Canada’s production of petroleum and other liquids has increased by 22 per cent, with natural gas production up 16 per cent in that time, all the while decreasing flaring by 38 per cent.²
• In contrast, Venezuela, as one example, decreased flaring by 18 per cent but this was driven in part by steep production declines (43 per cent less in oil production in 2018 compared to 2014 though with a six per cent increase in gas production).
• In another example, the United States increased production of petroleum and other liquids by 27 per cent, similar to Canada’s 22 per cent rise (and the U.S. also increased gas production by 18 per cent), but unlike Canada, U.S. flaring increased by 25 per cent.
To fully grasp how much more efficient Canada has been in reducing flaring, Figures 3 compares both flaring and production.
2. As per the U.S. Energy Information Administration data sources, this measurement
includes the production of crude oil (including lease condensate), natural gas plant
liquids, and other liquids. It also includes refinery processing gain for volume (TBPD) only
Sources: World Bank, U.S. Energy Information Administration, International Energy Agency
*Ranking based on increase (decrease) in petroleum and other liquids. Data description
depends on source agency with petroleum data in Mb/d; gas data in mcm, and flaring data
in bcm. For Figure 3, the relevant comparison is the percentage increase/decrease in volumes.
The takeaway
Global flaring and venting of gases contribute to greenhouse gas emissions. Canada is an example of a producer country of petroleum and other liquids where a significant reduction in flaring has occurred not only in absolute terms but also when compared with increased production volumes.
Notes:
This CEC Fact Sheet was compiled by Ven Venkatachalam and Mark Milke at the Canadian Energy Centre: www.canadianenergycentre.ca. The authors and the Canadian Energy Centre would like to thank and acknowledge the assistance of Philip Cross and Dennis Sundgaard in reviewing the data and research for this Fact Sheet. Image credit: ‘Oil refinery in industrial estate at sunset’ by Kampee Patisena.
Sources: (Links live as of June 18, 2020)
Alberta Energy Regulator (2020). Directive 060. <https://bit.ly/37jrLfi>; BC Oil and gas Commission (2018). Flaring and Venting Reduction Guideline. <https://bit.ly/3frjDfJ>; Saskatchewan Energy & Resources (2010). S-10 and S-20. <https://bit.ly/2BY68Wg>; Canada-Newfoundland and Labrador Offshore Petroleum Board (2007). Offshore Newfoundland and Labrador Gas Flaring Reduction. <https://bit.ly/30zqaAC>; Environment and Climate Change Canada (2020). Facility Greenhouse Gas Reporting. Technical Guidance on Reporting Greenhouse Gas Emissions—2019 data. <https://bit.ly/2AURpe7>; International Energy Agency, Indigenous Gas production, <https://bit.ly/30Uuivl>; Johnson, Matthew R. and Adam R. Coderre (2012). “Compositions and greenhouse gas emission factors of flared and vented gas in the Western Canadian Sedimentary Basin. Journal of the Air & Waste Management Association 62:9; 992-1002. <https://bit.ly/3cJRqPd>; Natural Resources Canada (undated). Crude Oil Facts. <https://bit.ly/3dSAzen>; Natural Resources Canada (undated). Natural Gas Facts. <https://bit.ly/2XN7kEe>; International Energy Agency (2019). Tracking Fuel Supply, 2019. <https://bit.ly/2YnU0FC>; U.S. Energy Information Administration (undated). Petroleum and other liquids. <https://bit.ly/2Ad6S9i>; World Bank (undated). Gas flaring volumes 2014-2018. <https://bit.ly/2MDsX3p>.
Creative Commons Copyright
Research and data from the Canadian Energy Centre (CEC) is available for public usage under creative commons copyright terms with attribution to the CEC. Attribution and specific restrictions on usage including non-commercial use only and no changes to material should follow guidelines enunciated by Creative Commons here: Attribution-NonCommercial-NoDerivs CC BY-NC-ND.