Social
Parsing through subsidy claims
This Fact Sheet (which can also be downloaded here as a pdf) focuses on government subsidies to business, prompted in part by various claims about the extent of subsidies to the Canadian oil and gas industry. One 2010 study claimed that $2.8 billion in subsidies flowed to the sector annually. In 2014, a Vancouver reporter asserted that a (2013) International Monetary Fund report found that subsidies to oil and gas in Canada amounted to $34 billion. The figure was substantially arrived at by arguing “uncollected taxes” existed due to externalities such as “impacts like traffic accidents, carbon emissions, air pollution and road congestion.”
In response to the $2.8 billion figure, in 2011, economists Kenneth McKenzie and Jack Mintz noted that measuring fossil fuel subsidies was a “tricky art.” They took specific issue with the 2010 study methodology that later informed subsequent work including at the International Monetary Fund. They argued four flaws led to the “billions-of-dollars” subsidy claim. The flaws included methodology that:
- Used a subsidy definition designed for a different purpose;
- Inappropriately added individual tax expenditures and royalty relief items up without accounting for critical interactions;
- Was not based upon an underlying optimizing economic model which emphasizes the impact of taxes, royalties and subsidies on investment at the margin; and
- Was not based upon an economically meaningful benchmark.
The McKenzie-Mintz study also argued that tax and royalty policies were already being phased out, such as earned depletion and accelerated cost recovery. Including all tax policies and subsidies, they found that oil and gas investments were more heavily taxed than other Canadian industries, resulting in a negative subsidy for marginal investments. (Philip Bazel and Jack Mintz found a similar result for 2018.) Overall, the authors concluded that taxes and royalties are not a significant source of subsidization for oil and gas.
In 2014, in response to both the 2010 and 2014 estimates, the Montreal Economic Institute found energy sector subsidies amounted to just $71 million. As the Montreal think tank noted, the larger numbers are arrived at in part by counting up “billions of dollars [that] simply do not exist”—the presumed subsidy value of a car accident as an example—and in other instances, by counting deferred taxes as subsidies. In 2017, when one of the authors of this Fact Sheet wrote a study on subsidies, scouring Alberta and Ontario disbursements and also the federal department of Natural Resource Canada, it turned out most subsidies to energy companies were for green energy projects.
In 2017, economist Ross McKitrick also analyzed energy subsidies including the International Monetary Fund estimate that $5.6 trillion was directed at energy subsidies worldwide. He noted numerous problems with this estimate. A few examples:
- Overstating the size of subsidy when tax expenditure calculations are used, i.e., overstatements that result from not accounting for the cost of cancelling a particular policy and its subsequent effect on revenues;
- Labelling non-tolled roads, a “subsidy,” without applying the same reasoning to all other public goods”; and
- Ignoring how “road subsidies are often financed through excise taxes on gasoline.”
Turning to unpriced externalities, McKitrick notes that once direct disbursements to fossil fuel companies are subtracted from the $5.6 trillion estimate, leaving $5.3 trillion, the latter figure is “dominated by uncollected externality taxes” which as McKitrick noted was challenged by other economists who questioned its validity. As McKitrick writes regarding that $5.3 trillion estimate:
For the purpose of determining the actual size of subsidies to fossil fuels it would appear that conventional subsidies, that is actual payments to consumers and firms, are at the low end of the range of past estimates and are only a small percentage of the large numbers that have sometimes been put forward. To the extent we include indirect or notional concepts the numbers get dramatically higher but they also become meaningless and potentially misleading.
The most recent data from Statistics Canada
To provide clarity and focus on what is possible to accurately measure in Canada, we detail the Supply and Use Tables (SUT), prepared annually by Statistics Canada, which tracks subsidies to products and production in multiple sectors.¹ Subsidies in the SUTs also include tax credit programs (including R&D tax credits), government rebates to businesses (such as for electricity), forgivable loans, and government-run farm loss insurances (local and provincial). The latest year available for the data is 2016.
Note that among other data, the following figures do not include:
- The $13.7 billion federal-Ontario subsidy package offered to the automotive sector in the 2008-09 financial crisis, because comparable Statistics Canada data is only available as of the 2010 fiscal year;
- Other subsidies to industries pre-2010 due to limitations (non-comparability) in Statistics Canada data;
- Payments to consumers, i.e. current transfers that governments make directly to households; and
- Capital subsidies from federal and provincial governments to aerospace, automotive and other sectors post-2010 that governments may make to enterprises in order to finance capital formation, or to compensate for damage to capital assets. Statistics Canada does not break down such capital subsidies by sector.
The $1.7 billion announcement
The most recent announced subsidy to oil and gas was the mid-April announcement by the federal government that it would provide $1.7 billion for “orphan and inactive well” clean-up. This should be noted as a subsidy but given it is not yet recorded in Statistics Canada data—which is historical—we note it here but do not list in the following charts.²
Seven-year totals: Motion pictures $12.6 billion in subsidies / oil and gas $1.9 billion
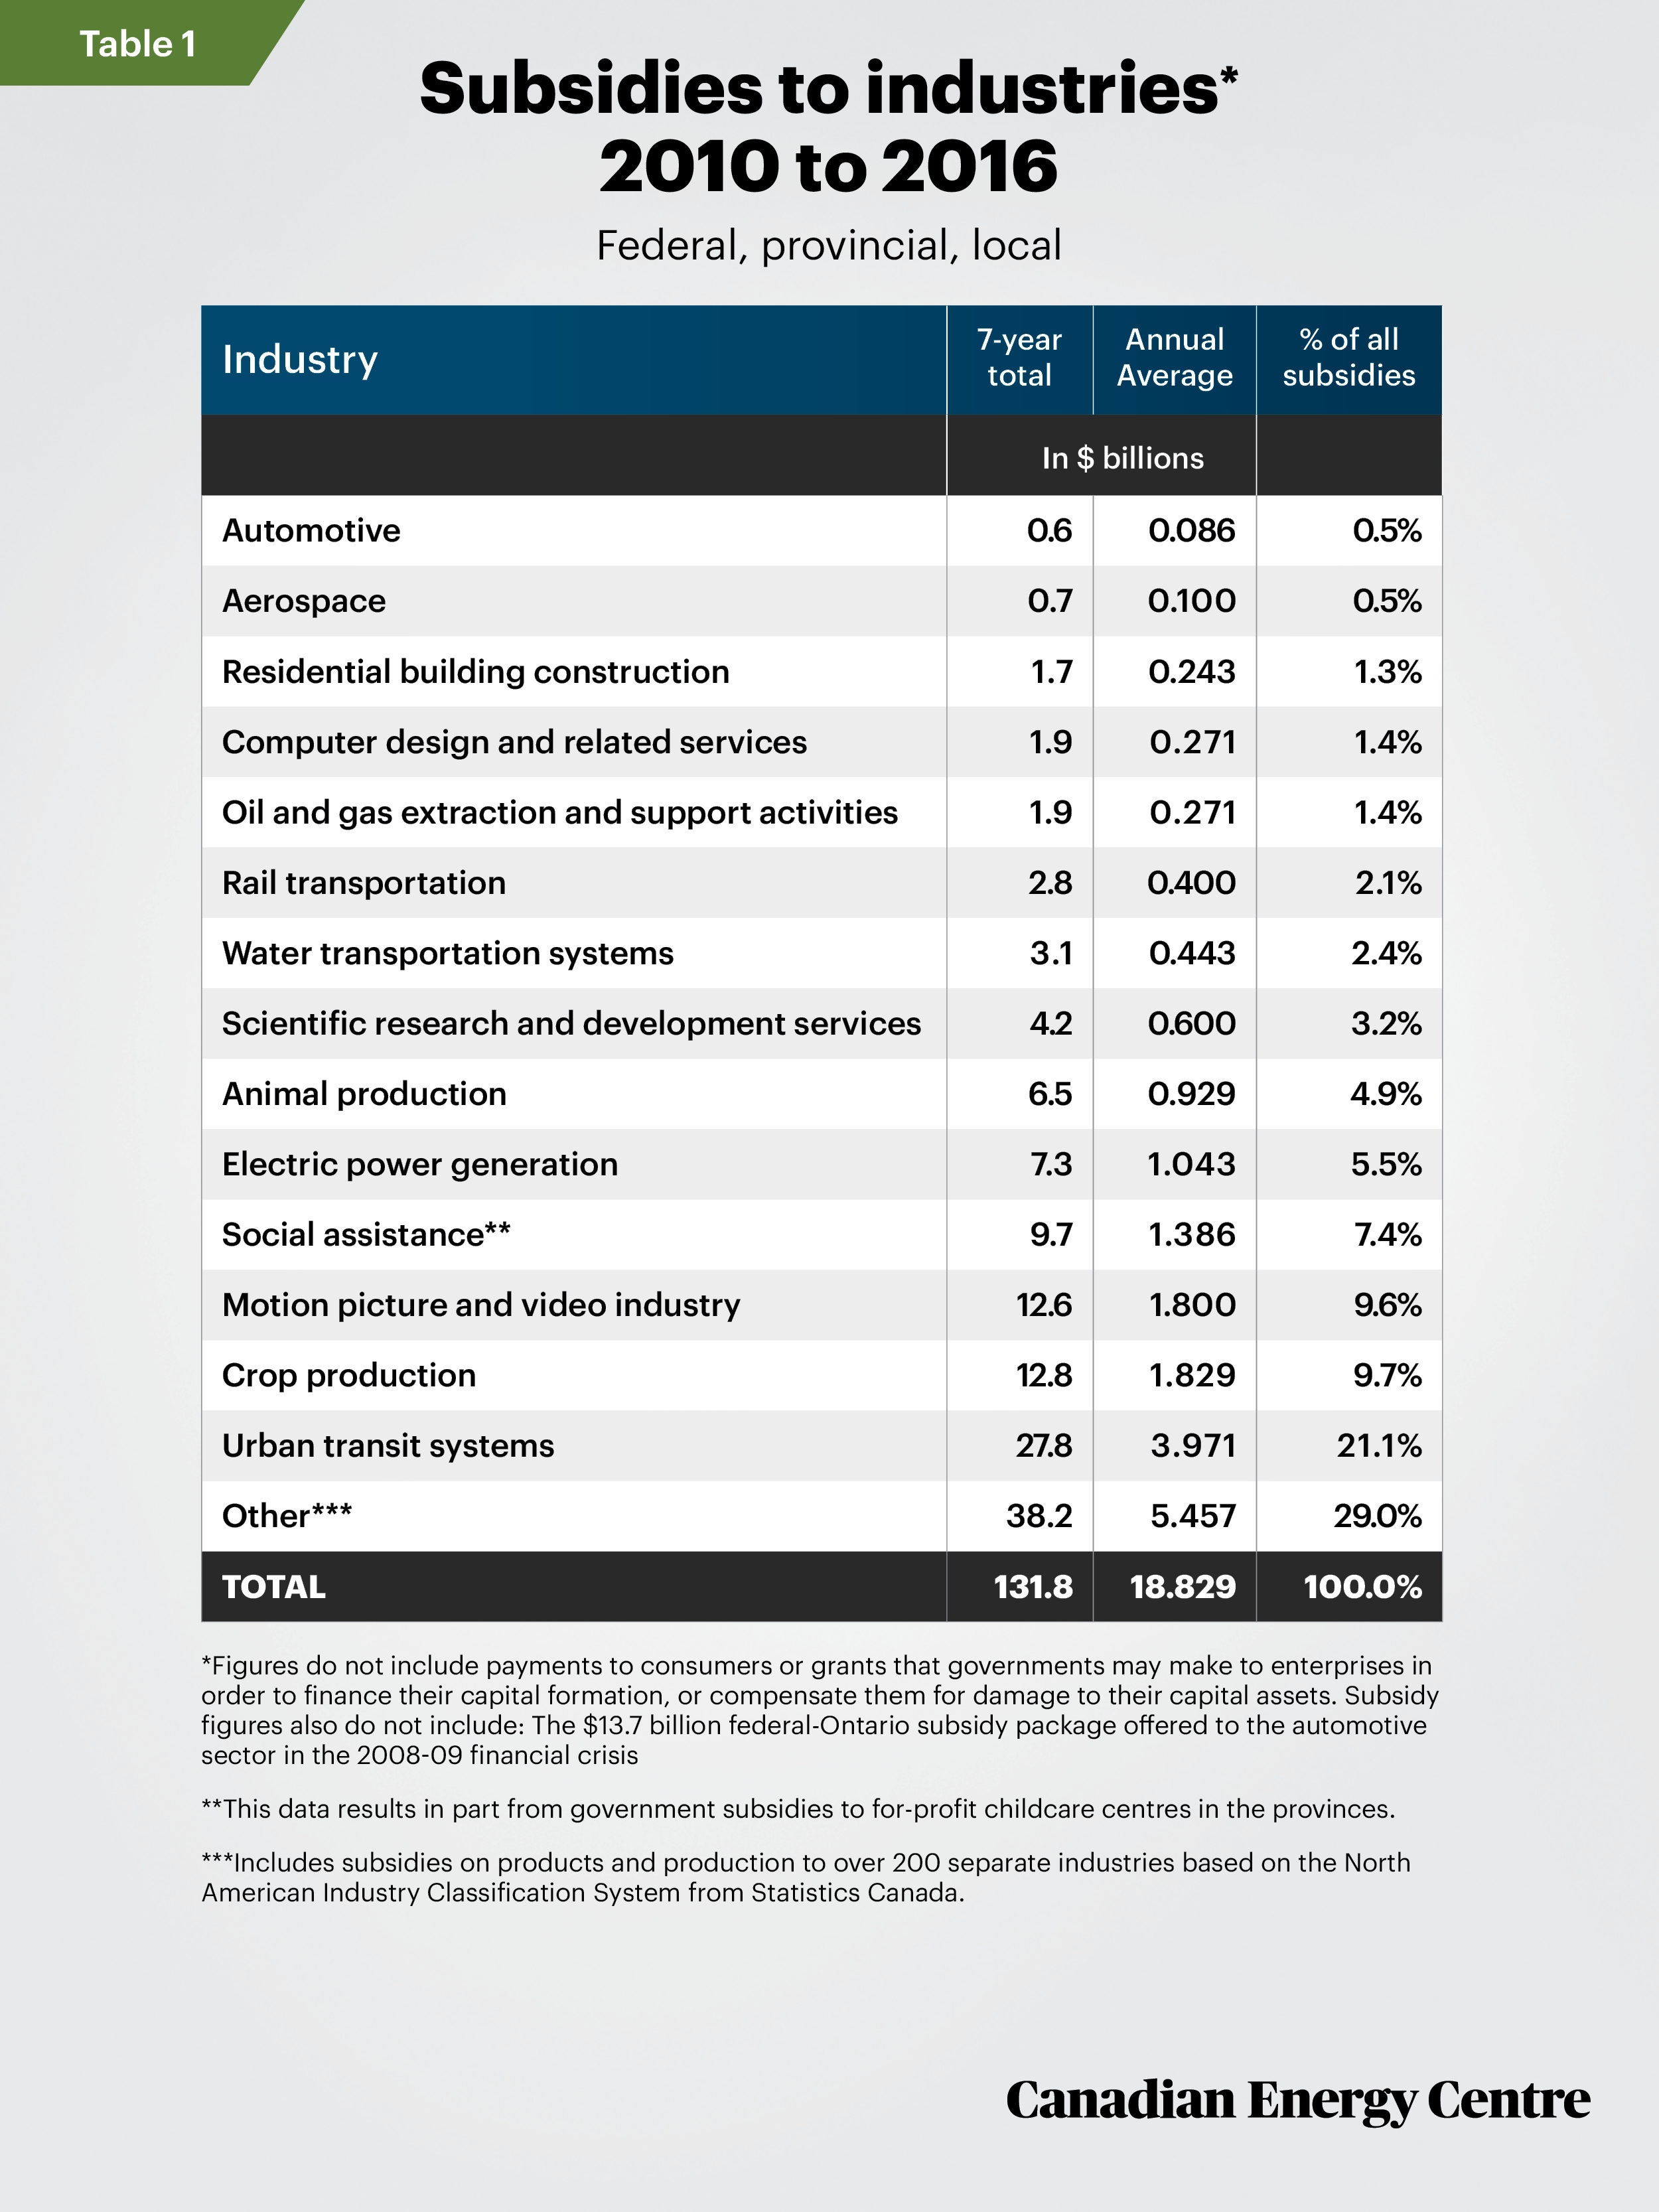
Table 1 examines trends in oil and gas industry subsidies and comparisons with other key industries between 2010 and 2016, the latter year the most recent one in which data are available. The data show that federal, provincial, and local governments spent nearly $131.8 billion on cumulative operating subsidies to private sector business and government business enterprises. This represents an average of $18.8 billion per year.
The top three recipients (private sector or government business enterprises) were:
- Urban transit systems at $27.8 billion (21.1 per cent of all subsidies);
- The crop production sector at $12.8 billion (9.7 per cent); and
- The motion picture industry at $12.6 billion (9.6 per cent);
As it pertains to claims about subsidies to the oil and gas sector, the federal, provincial and local subsidies amounted to $1.9 billion in total (2010 to 2016) or an average of $271 million annually. That is more than the subsidies to the automotive and aerospace sectors (with the above caveats noted) but less than rail, the motion picture industry, and crop production, among others.
1. The full definition of subsidies from Statistics Canada and the World Bank can be accessed
here and here. According to Statistics Canada, subsidies on production include payments made
to business, such as assistance for training and other payments to reduce the cost of labour
as well as payments to compensate producers for the interest costs of capital, property and
other taxes. Also included are subsidies on products that directly affect either the price of
those goods and services or the incomes arising from their production and sale, including
payments to reduce the price of passenger rail travel and other transportation services such
as ferries and electricity, natural gas and other home-heating fuels.
2. The federal government announced another $750 million for the federal Department of Natural
Resource Canada to loan to energy companies to help reduce their greenhouse gas emissions. The
announcement noted that some of disbursements may be converted to grants. For the purposes of
this Fact Sheet, it is thus impossible to know in advance how much of the $750 million in loans
will eventually be counted statistically as grants,i.e., subsidies.
Table 2 shows how much the three levels of government (federal, provincial, and local) collectively spent in the four major provinces and the six others, on subsidies to all industries, between 2010 and 2016. In this data set, the least amount was spent in Alberta and most in Quebec. This is distinct from Table 3 where four provinces are listed with examples of major industries in those provinces and the in-province subsidies (from three levels of government) to those industries. As per the earlier caveat, the data are not complete as some data is not available from Statistics Canada or falls outside the 2010-2016 “window” of comparable data.
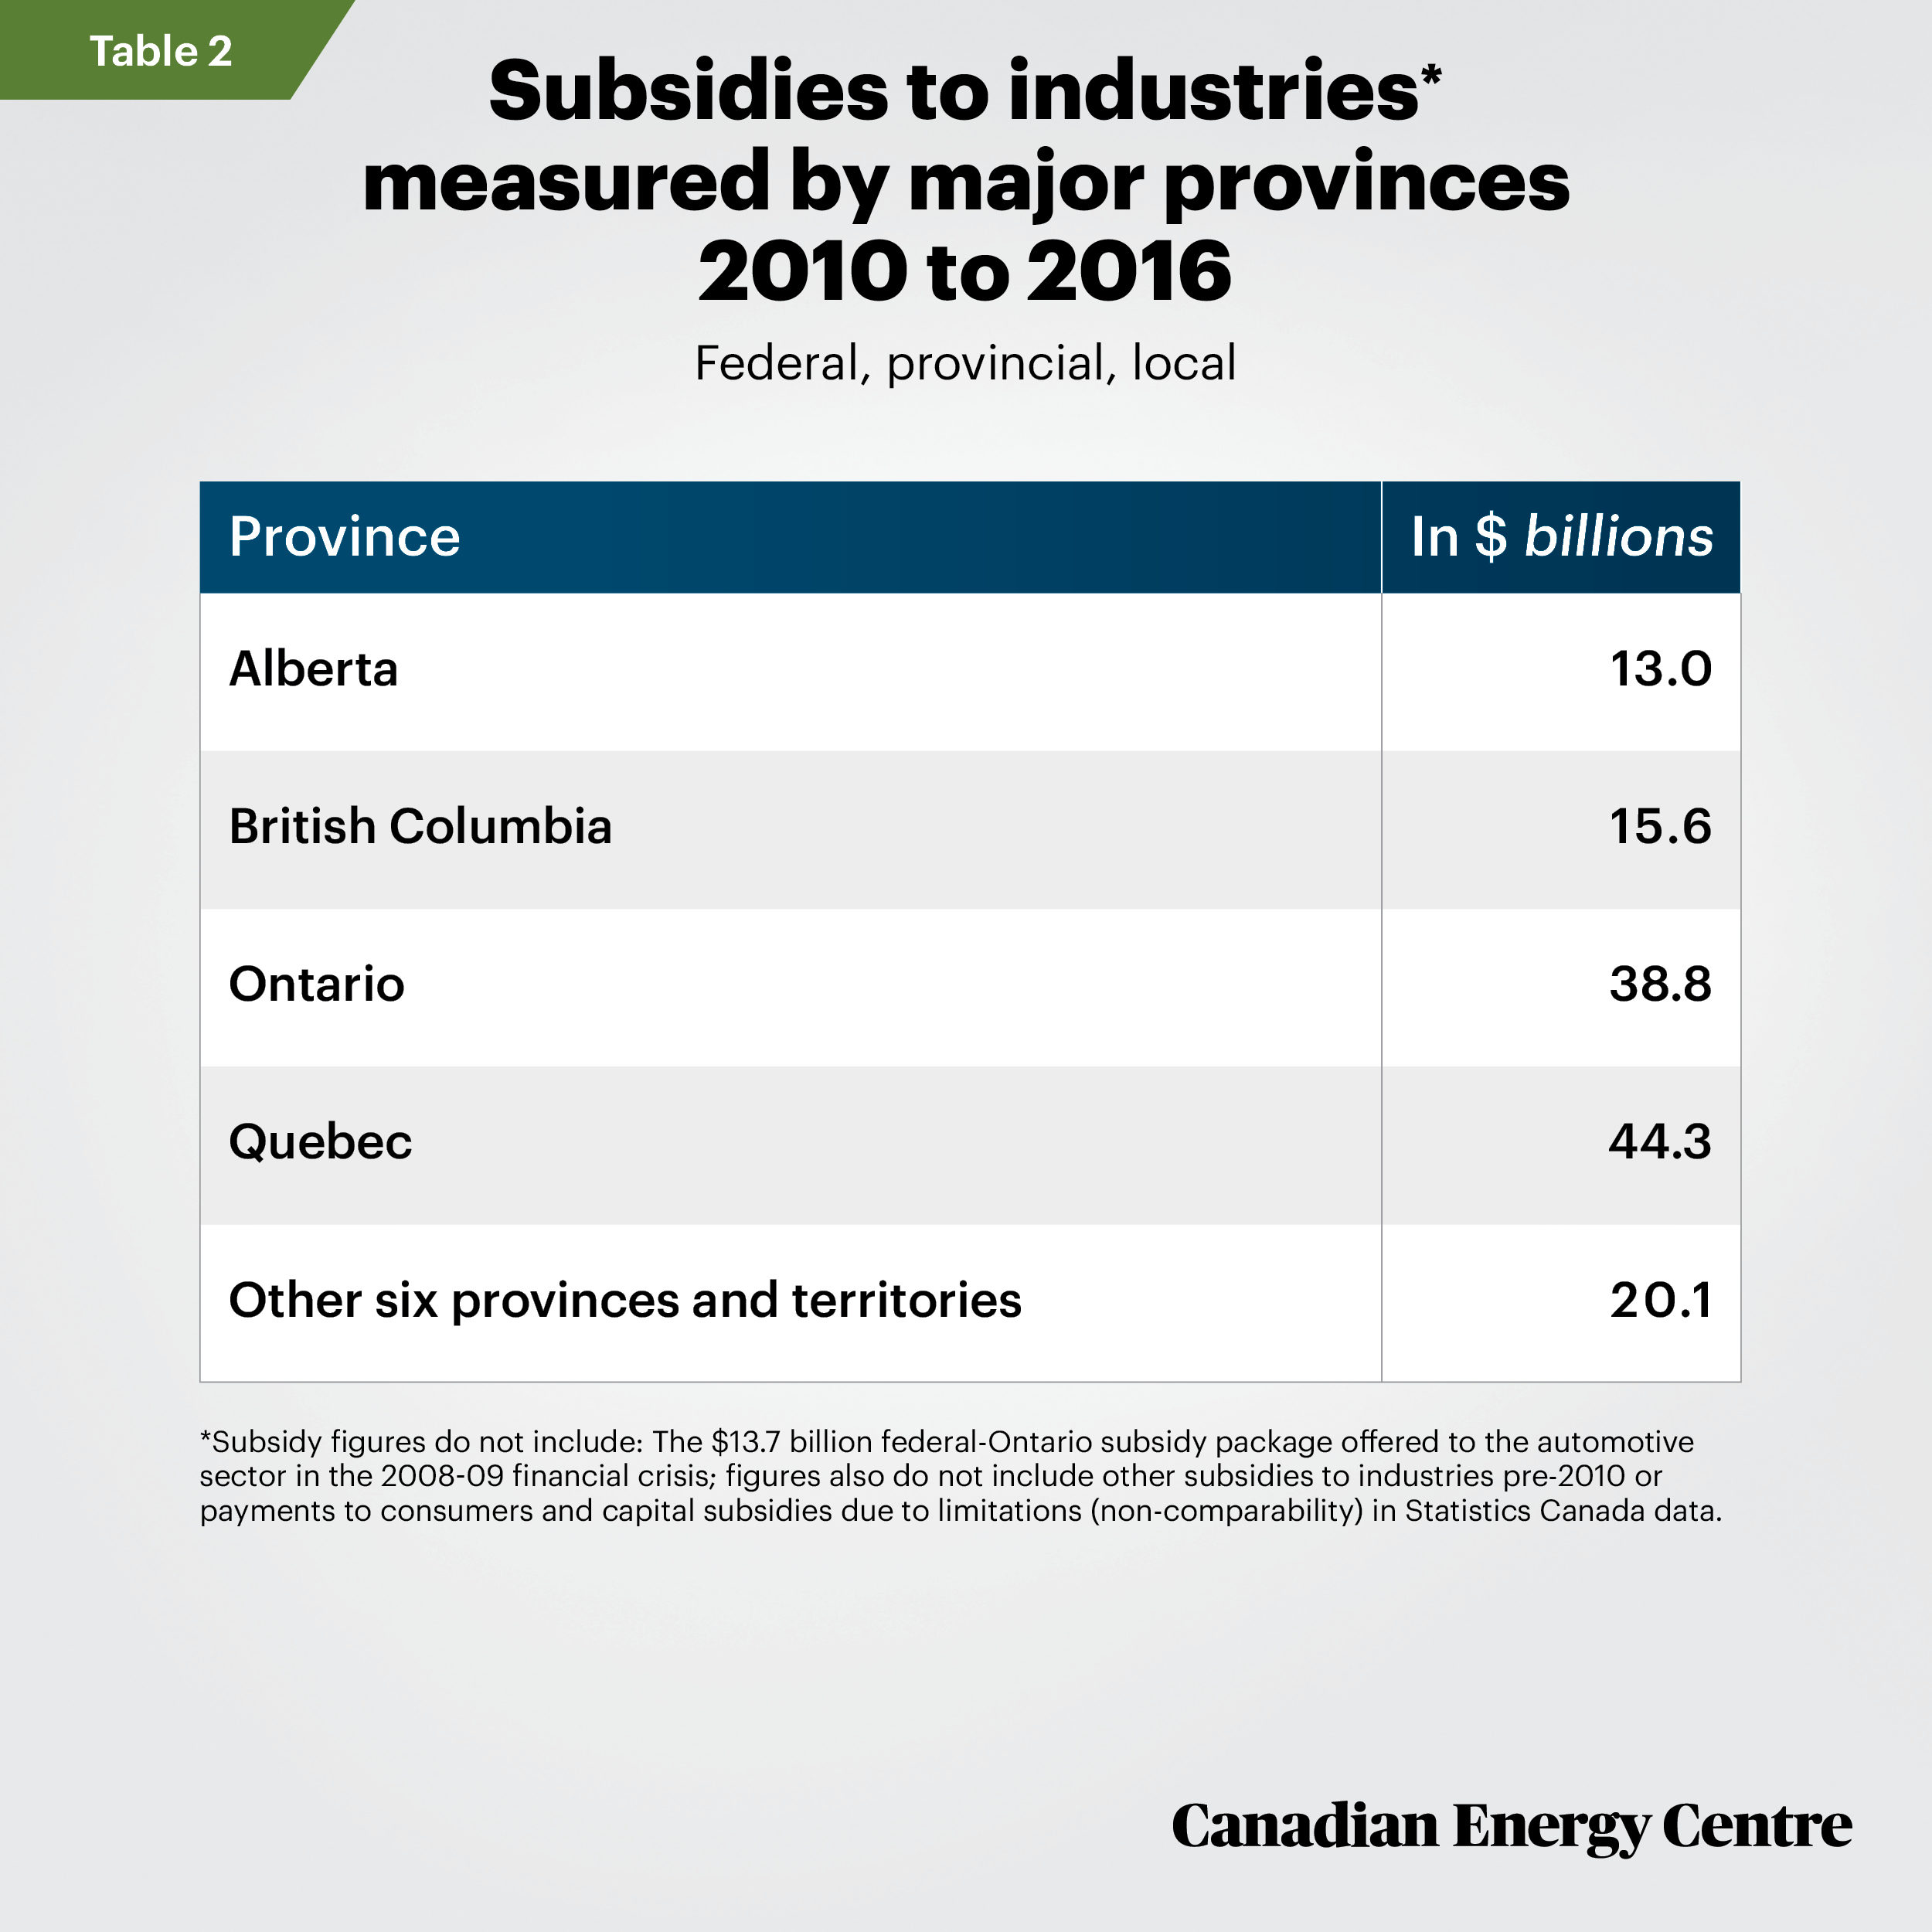
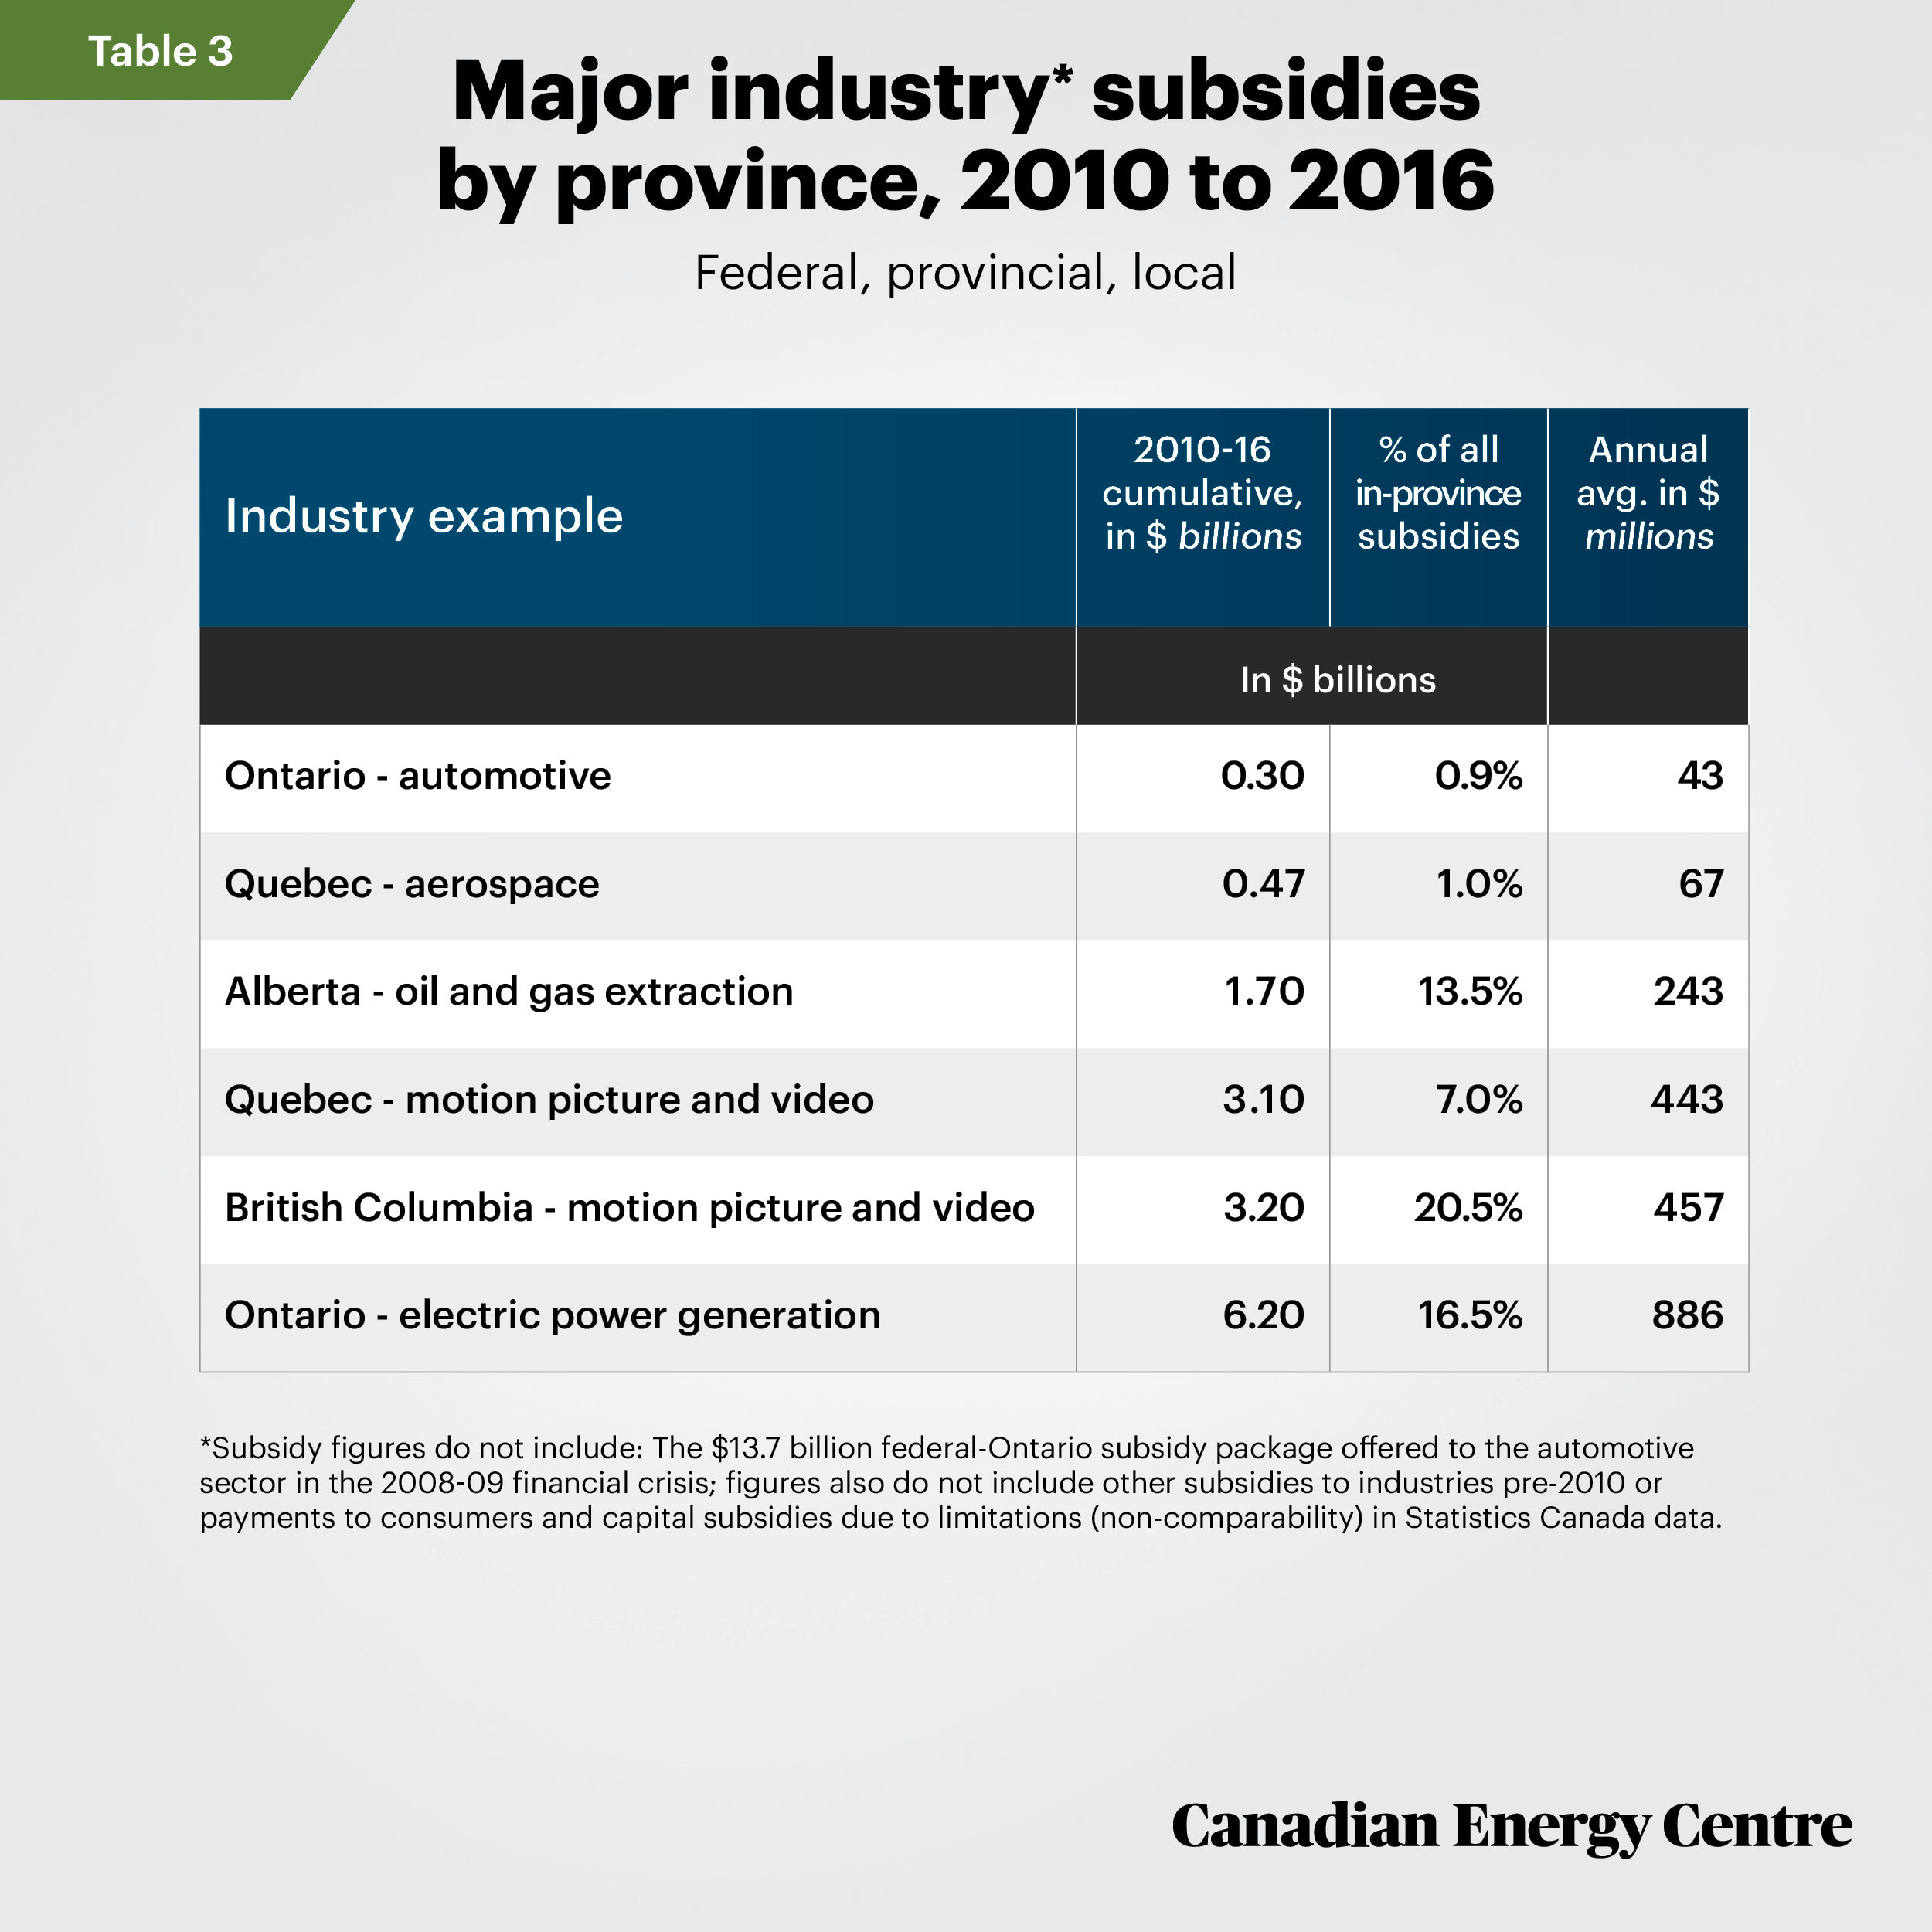
Table 3 shows major subsidies by province 2010-2016 (federal, provincial and local) by industry and as a percentage of subsidies in each province.
Takeaway: Oil and gas subsidies exist but are a fraction of eye-popping estimates
The various billion-dollar-plus estimates of subsidies to Canada’s oil and gas sector are methodologically flawed, according to economists including Kenneth McKenzie and Jack Mintz, the Montreal Economic Institute, and Ross McKitrick. Subsidies to the sector do exist. According to Statistics Canada, they amount to $1.9 billion ($271 million annually) in the seven-year (inclusive) period from 2010 to 2016.
Notes
This CEC Fact Sheet was compiled by Lennie Kaplan and Mark Milke at the Canadian Energy Centre. The authors and the Canadian Energy Centre would like to thank and thank and acknowledge the assistance of Philip Cross, Jack Mintz, and an anonymous reviewer in reviewing the data and research for this Fact Sheet. Image credits: ‘Fracking Drilling Rig at the Golden Hour’ by Grandriver
Sources (All links live as of April 21, 2020)
Mitchell Anderson (2014). “IMF Pegs Canada’s Fossil Fuel Subsidies at $34 Billion.” The Tyee. <https://bit.ly/2Xg7h4a>; Philp Bazel and Jack Mintz. (2019). “Is Accelerated Depreciation Good or Misguided Tax Policy?” Canadian Tax Journal, Vol. 67, No. 1, 2019.; Youri Chassin (2014). “Is the Canadian oil industry subsidized?” Montreal Economic Institute. < https://bit.ly/2V7bep1>; Kenneth J. McKenzie and Jack M. Mintz (2011). The Tricky Art of Measuring Fossil Fuel Subsidies. The School of Public Policy, University of Calgary, <https://bit.ly/2RhhIRf>; Ross McKitrick (2017). Global Energy Subsidies: An analytical taxonomy. Energy Policy 101 (2017)
379-385 <https://bit.ly/2wSZHS3>; Mark Milke (2015). “How much did the 2009 automotive bailout cost taxpayers?” Canadian Taxpayers Federation. <https://bit.ly/34jGDIT>; Mark Milke (2017). Corporate Welfare Cash. Canadian Taxpayers Federation.<https://bit.ly/2KqqGHX>. Statistics Canada (undated). Table 36-10-0478-01 <https://bit.ly/2UOGE4H>; Statistics Canada (undated). Table 36-10-0450-01 <https://bit.ly/2Rfl1Z9>; Statistics Canada (undated). User Guide: Canadian System of Macroeconomic Accounts <https://bit.ly/2XfSHJU>; Statistics Canada (2012) North American Industry Classification System (NAICS), <https://bit.ly/3b66EOo>;
Statistics Canada (undated). Guide to Income and Expenditure Accounts: Taxes less subsides. https://bit.ly/2XRB6bi; World Bank (2008). System of National Accounts. <https://bit.ly/2VbstFQ>.
Creative Commons Copyright
Research and data from the Canadian Energy Centre (CEC) is available for public usage under creative commons copyright terms with attribution to the CEC. Attribution and specific restrictions on usage including non-commercial use only and no changes to material should follow guidelines enunciated by Creative Commons here: Attribution-NonCommercial-NoDerivs CC BY-NC-ND.