Social
To sign up to receive the latest Canadian Energy Centre research to your inbox email: research@canadianenergycentre.ca
Download the PDF here
Download the charts here
Introduction
The Russian invasion of Ukraine is having an impact on the world’s natural gas markets. Natural gas supply security has become a key concern for governments and industries worldwide.
According to the International Energy Agency (IEA), natural gas is among the world’s fastest-growing energy sources, representing more than 23 per cent of global energy demand ( IEA, 2022). Natural gas is vital to the energy mix in many emerging economies, including countries in the Asia-Pacific region.
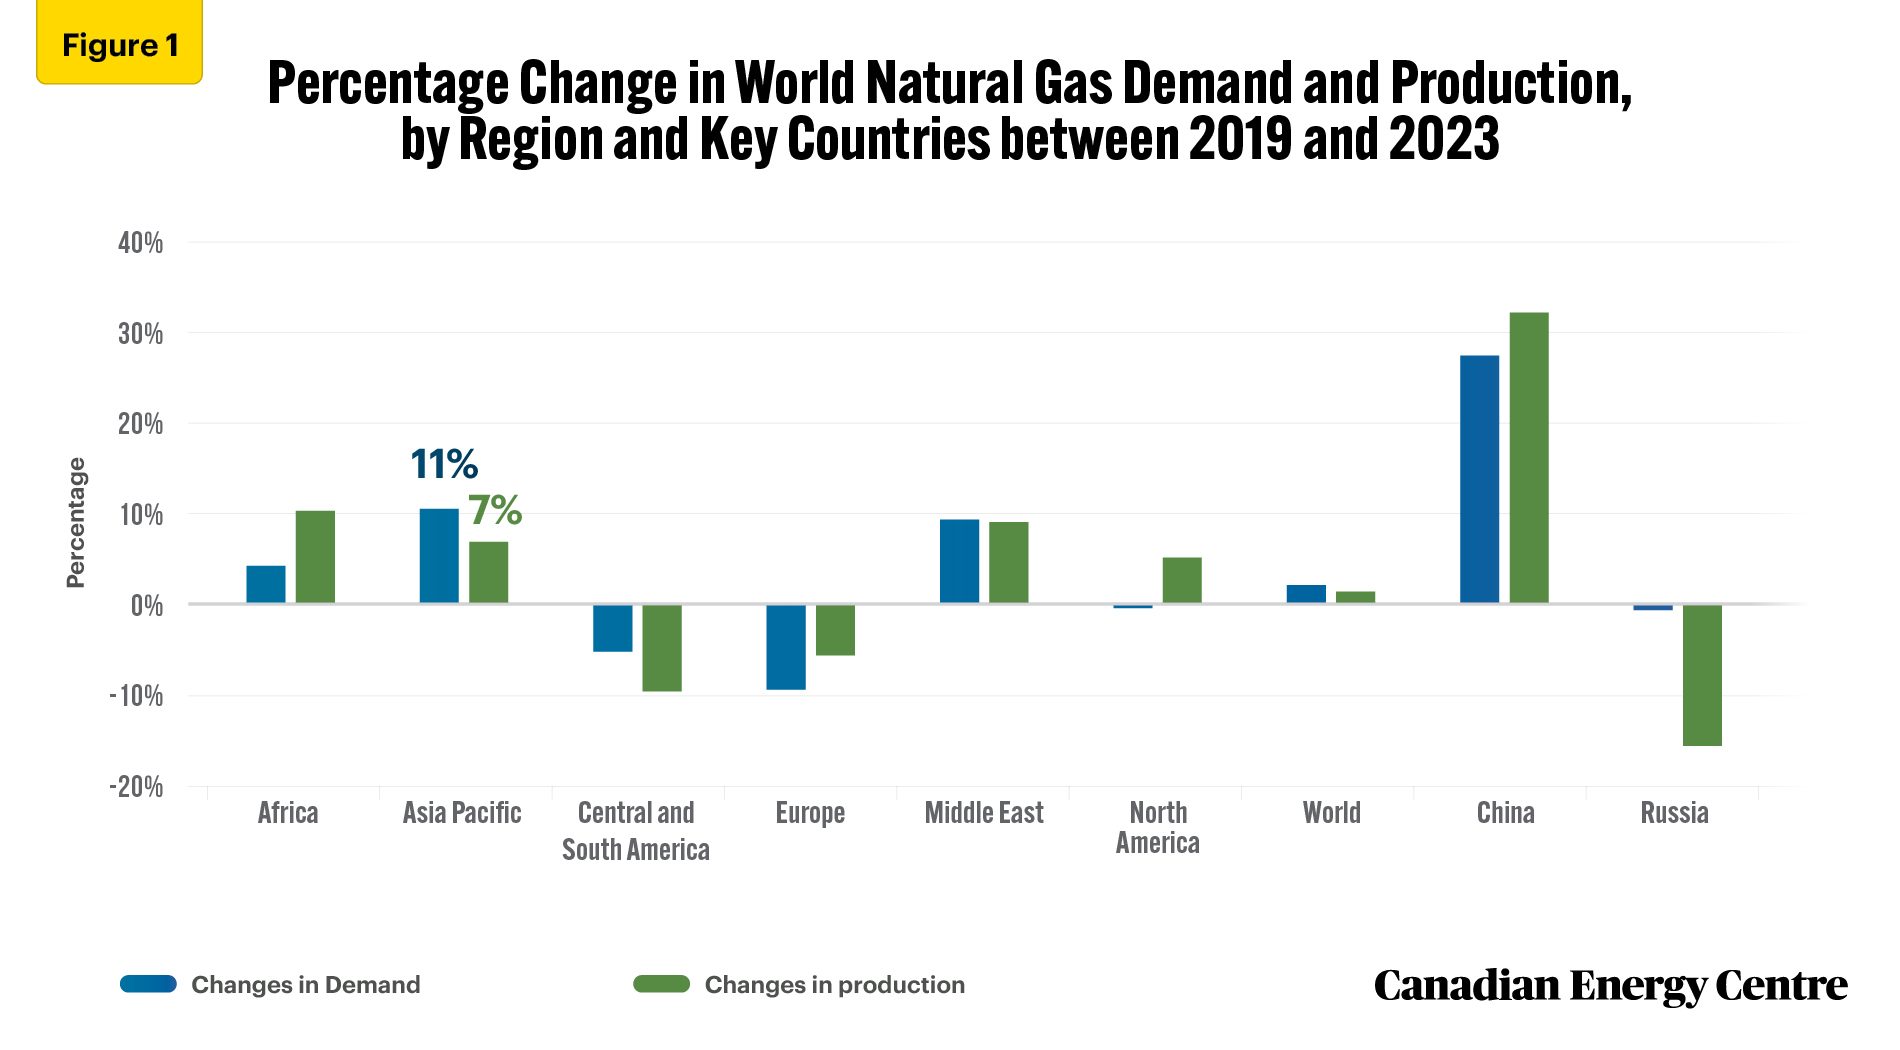
Recent forecasts from various sources predict a growing demand for natural gas in the short-term as developing countries move away from coal. In the last few years (2019-2023), the demand for and production of natural gas has fluctuated across regions. World demand for natural gas has increased by two per cent in that time, while world production has increased by just one per cent. Demand for natural gas in the Asia-Pacific region increased by 11 per cent while production in the region increased by only 7 per cent.
As the world’s fifth-largest producer of natural gas, Canada has the potential to capitalize on energy demand in the Asia-Pacific region.
In this CEC Research Brief, we explore North American natural gas price differentials, as well as prices for natural gas in significant Asian trading hubs, including Japan, South Korea, and the average in the region.
Source: Author’s calculations from IEA (2022)
Current Reliance on the United States and Prospects in Asia
In Canada, 98 per cent of natural gas production takes place in Alberta and British Columbia. Alberta’s gas production represented 63 per cent of total Canadian natural gas production in 2020.
All of the natural gas Canada exports is sent to the United States, though such exports have been decreasing in recent years. The emergence of shale gas in Western Canada and the United States has changed international natural gas market dynamics, increasing supply and decreasing prices.¹
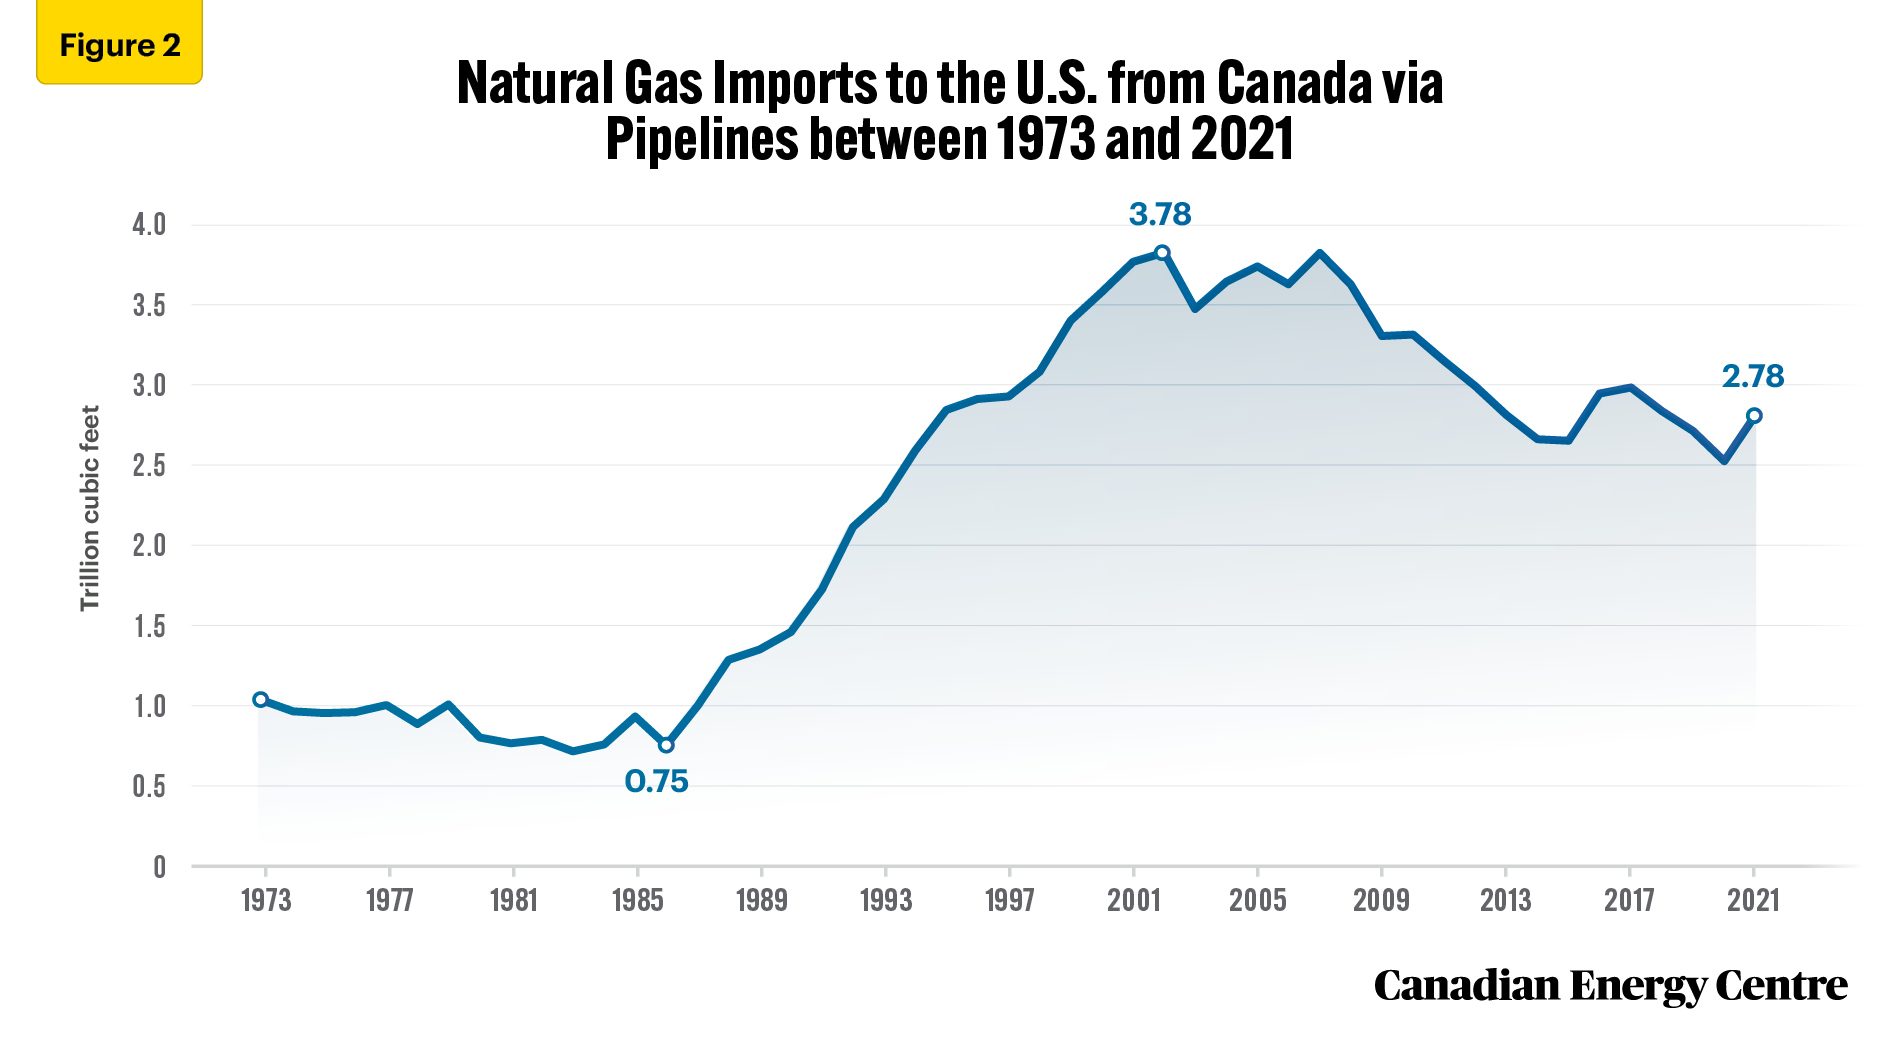
In 2021, about 99 per cent of the total natural gas imported by the United States came from Canada, with nearly all transported to the U.S. by pipelines. In 2021, Canada exported 2.78 trillion cubic feet (tcf) to the U.S., down from its peak of 3.78 tcf in 2002. However, the expansion of shale gas production in Canada and the U.S. has also created an opportunity for both countries to supply new markets in Asia.
1. Beyond shale gas being lower cost, many other factors influence natural gas prices including demand and supply, production and exploration, storage and withdrawal, weather, and access to demand markets, such as the Asia-Pacific region.
Source: EIA (2023)
Natural Gas Price Differences Between Canada and the U.S.
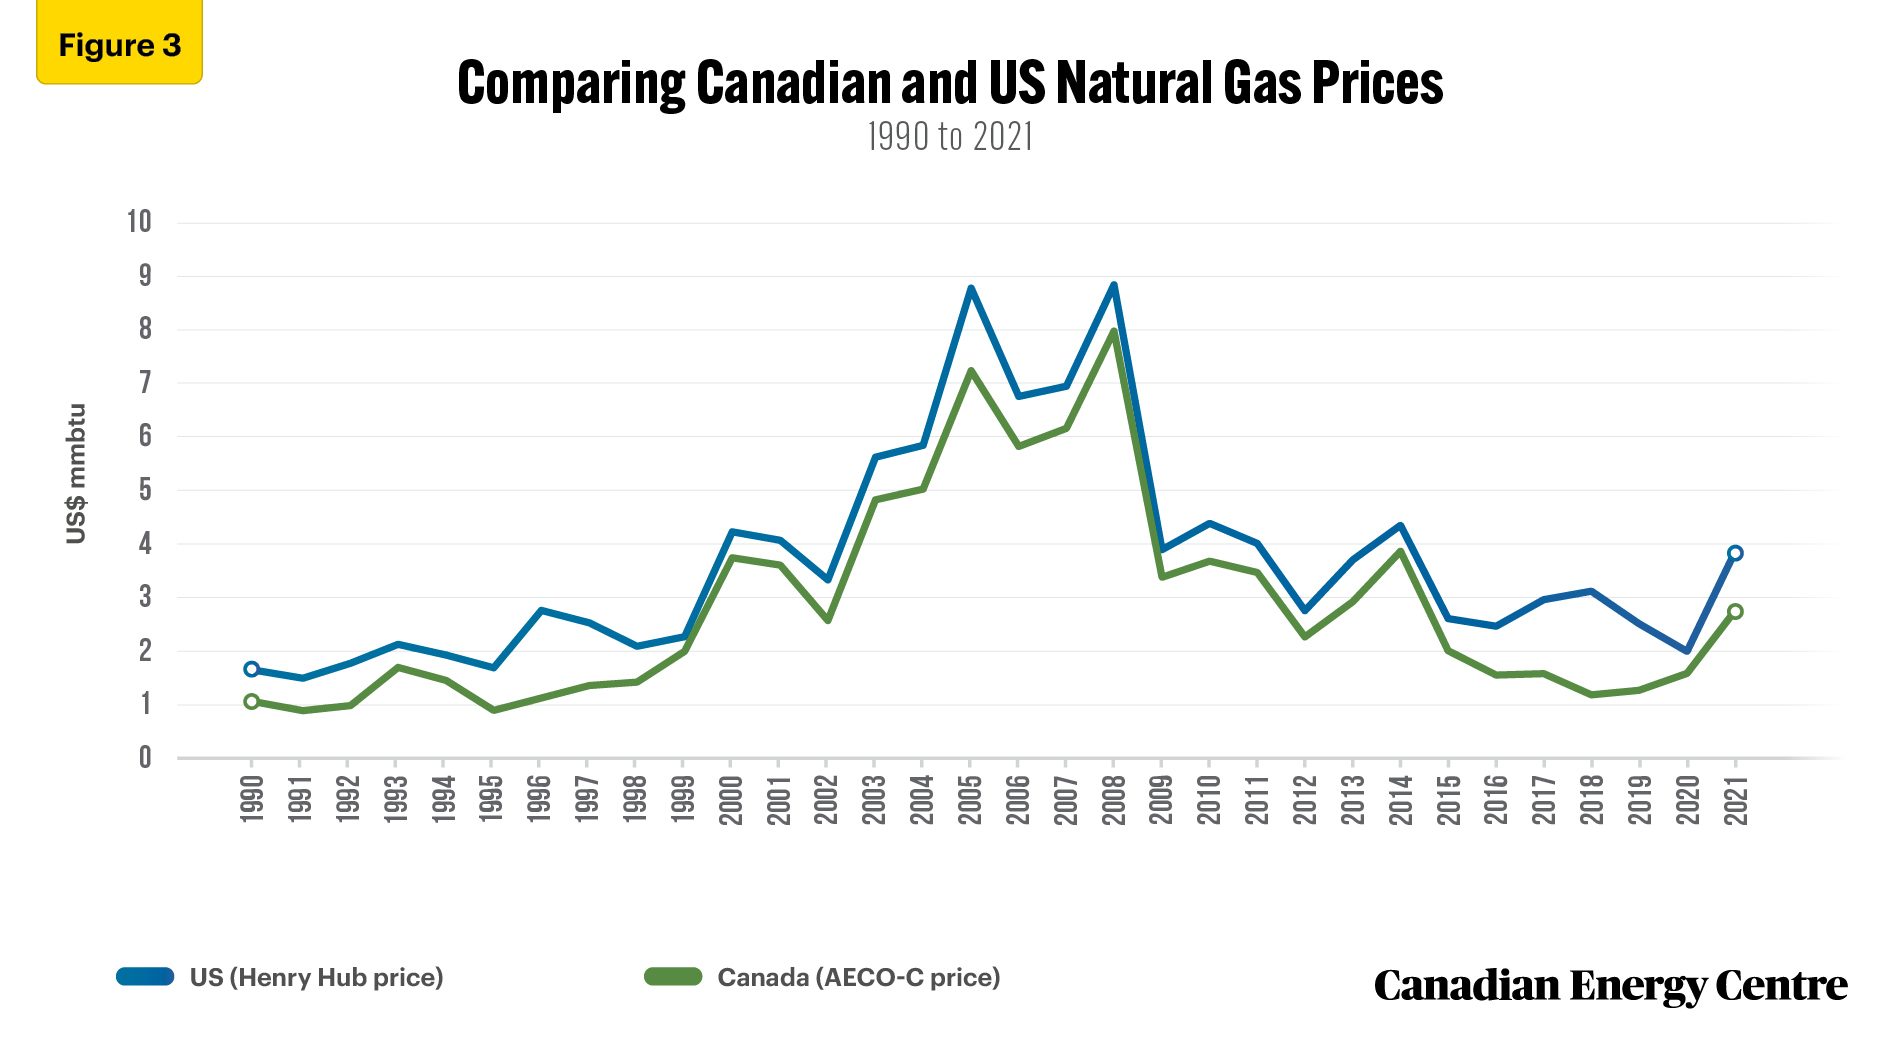
Between 1990 and 2021, US Henry Hub and Canadian AECO-C natural gas spot trading prices closely tracked each other. However, short-term price differences can be significant and advantageous to the U.S. (see Figure 3).²
- For example, the prices were closest to each other in 2008 when U.S. natural gas sold for US$8.85 per million British thermal units (mmbtu), just 11 per cent higher than the US$7.99 per mmbtu that Canadian (AECO-C) natural gas fetched that year.
- In contrast, the price gap was widest in 2018 when U.S. natural gas sold for US$3.13 per mmbtu, 179 per cent higher than the US$1.12 per mmbtu average price for AECO-C natural gas that year.
- Between 2019 and 2021, the price gap between US Henry Hub and AECO-C natural gas fluctuated from a high of 98 per cent in 2019 to a low of 26 per cent in 2020. In 2021, U.S. natural gas sold for US$3.84 per mmbtu, 40 per cent higher than the US$2.75 per mmbtu average price for AECO-C natural gas that year.
According to Alberta’s Energy Regulator (AER), many factors cause the observed price differences between AECO-C and Henry Hub natural gas, infrastructure constraints being among the most significant. Other factors include demand and supply, the exchange rate, and transportation costs. The AER estimates that the AECO-C and Henry Hub price differential will increase to US$0.98 per mmbtu by 2031 (AER, undated)
2. According to the EIA, most of the spot price volatility in Canada’s AECO-C trading hub is due to regulatory changes for Western Canada’s pipeline operations.
Sources: BP Statistical Review of World Energy (2022)
Natural Gas Prices in Asia and Comparisons with Henry Hub and AECO-C
In contrast to the relatively close tracking between U.S. and Canadian natural gas prices over time, the opposite is true when comparing the Canadian with the Asian average price over the years, and in country-specific comparisons with Japan and South Korea.
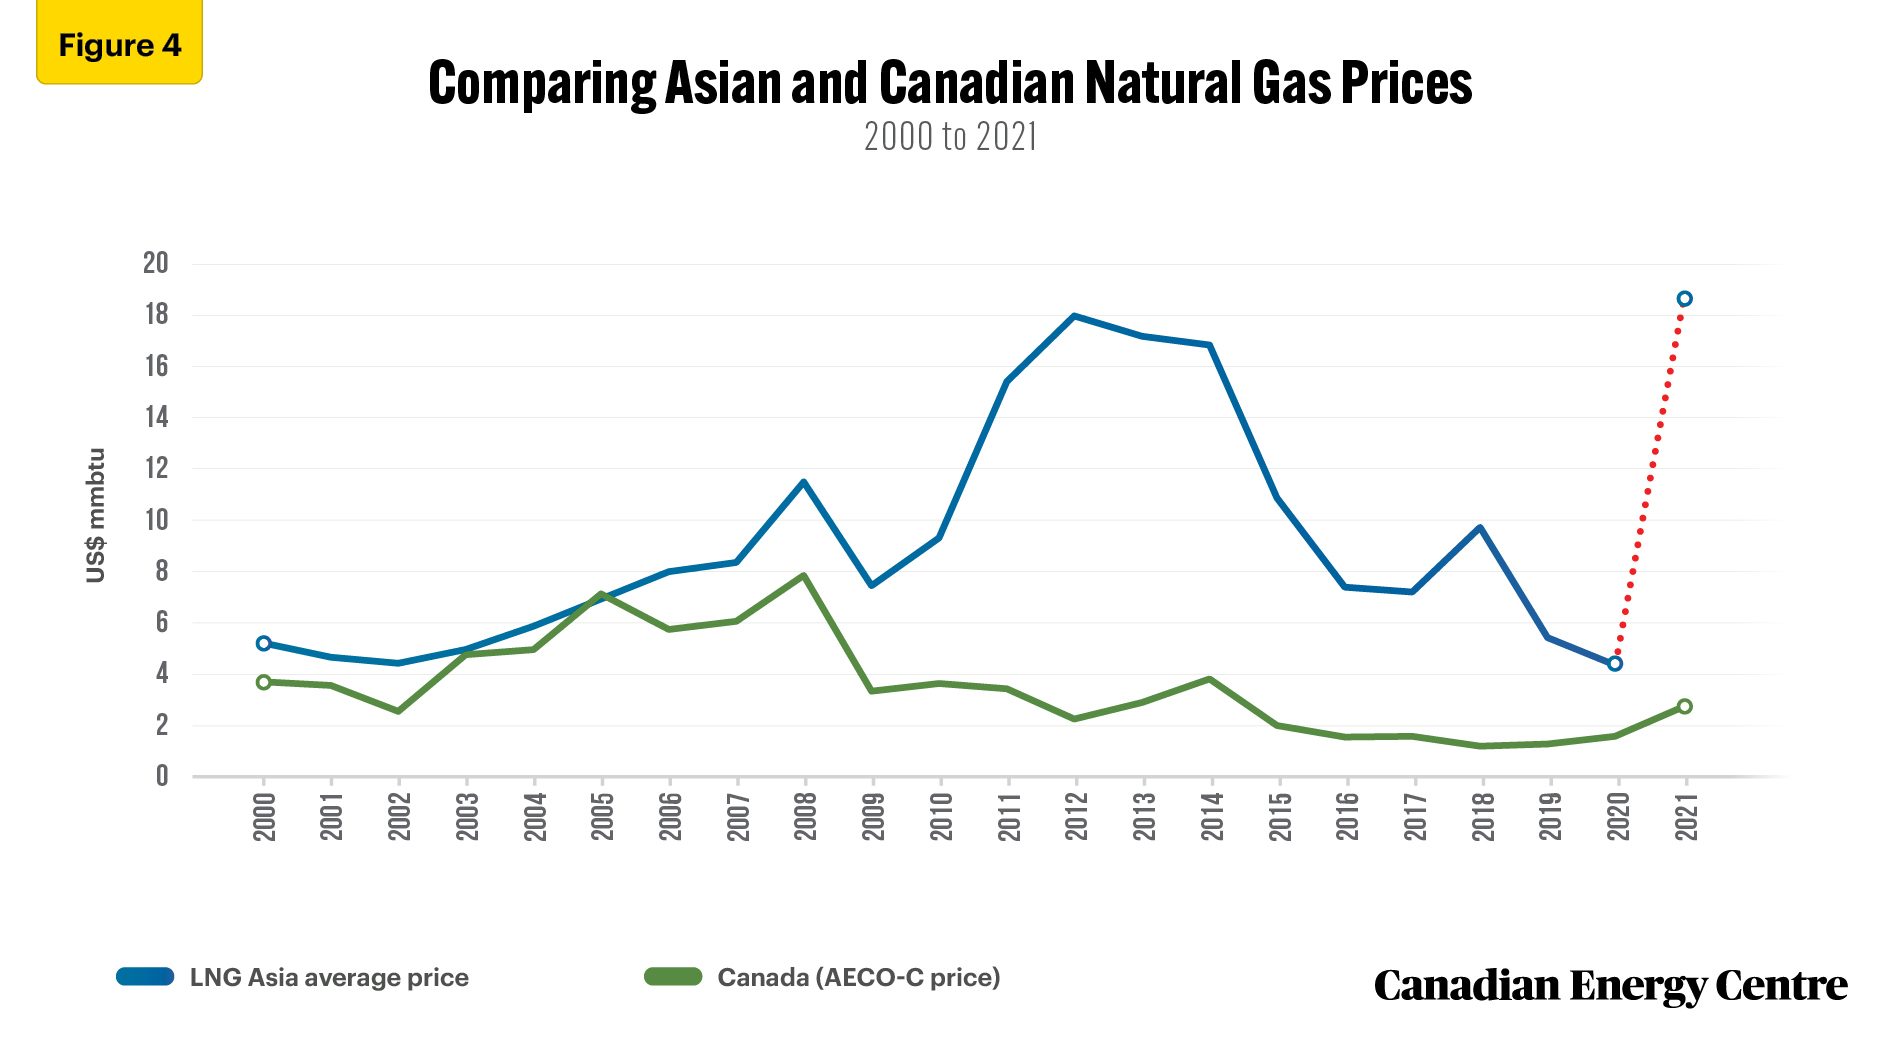
Natural gas prices skyrocketed worldwide in the last two years, and Asia was no exception. In 2021, the Asian natural gas price was US$18.60 per mmbtu, compared to US$4.40 mmbtu in 2020, an increase of 323 per cent (see Figure 4).
Historically, natural gas prices in Asia on average have been much higher than in Canada. The exceptions were in 2003, when Asian spot prices were just three per cent higher, and in 2005, when they were three per cent lower than in Canada. In most other years, the percentages and prices for natural gas sold in Asia have been significantly higher than in Canada.
For example,
- In 2021, natural gas sold for US$2.80 per mmbtu on the AECO-C trading hub and for US$18.60 per mmbtu in Asia; US$15.88 per mmbtu more, or 564 per cent higher.
- The trend since 2009 has been for Asian natural gas prices to be higher than Canadian natural gas prices by triple percentages, i.e., selling for between 122 and 775 per cent more in Asia than in Canada, depending on the year.
Sources: BP Statistical Review of World Energy (2022) and International Monetary Fund (2023)
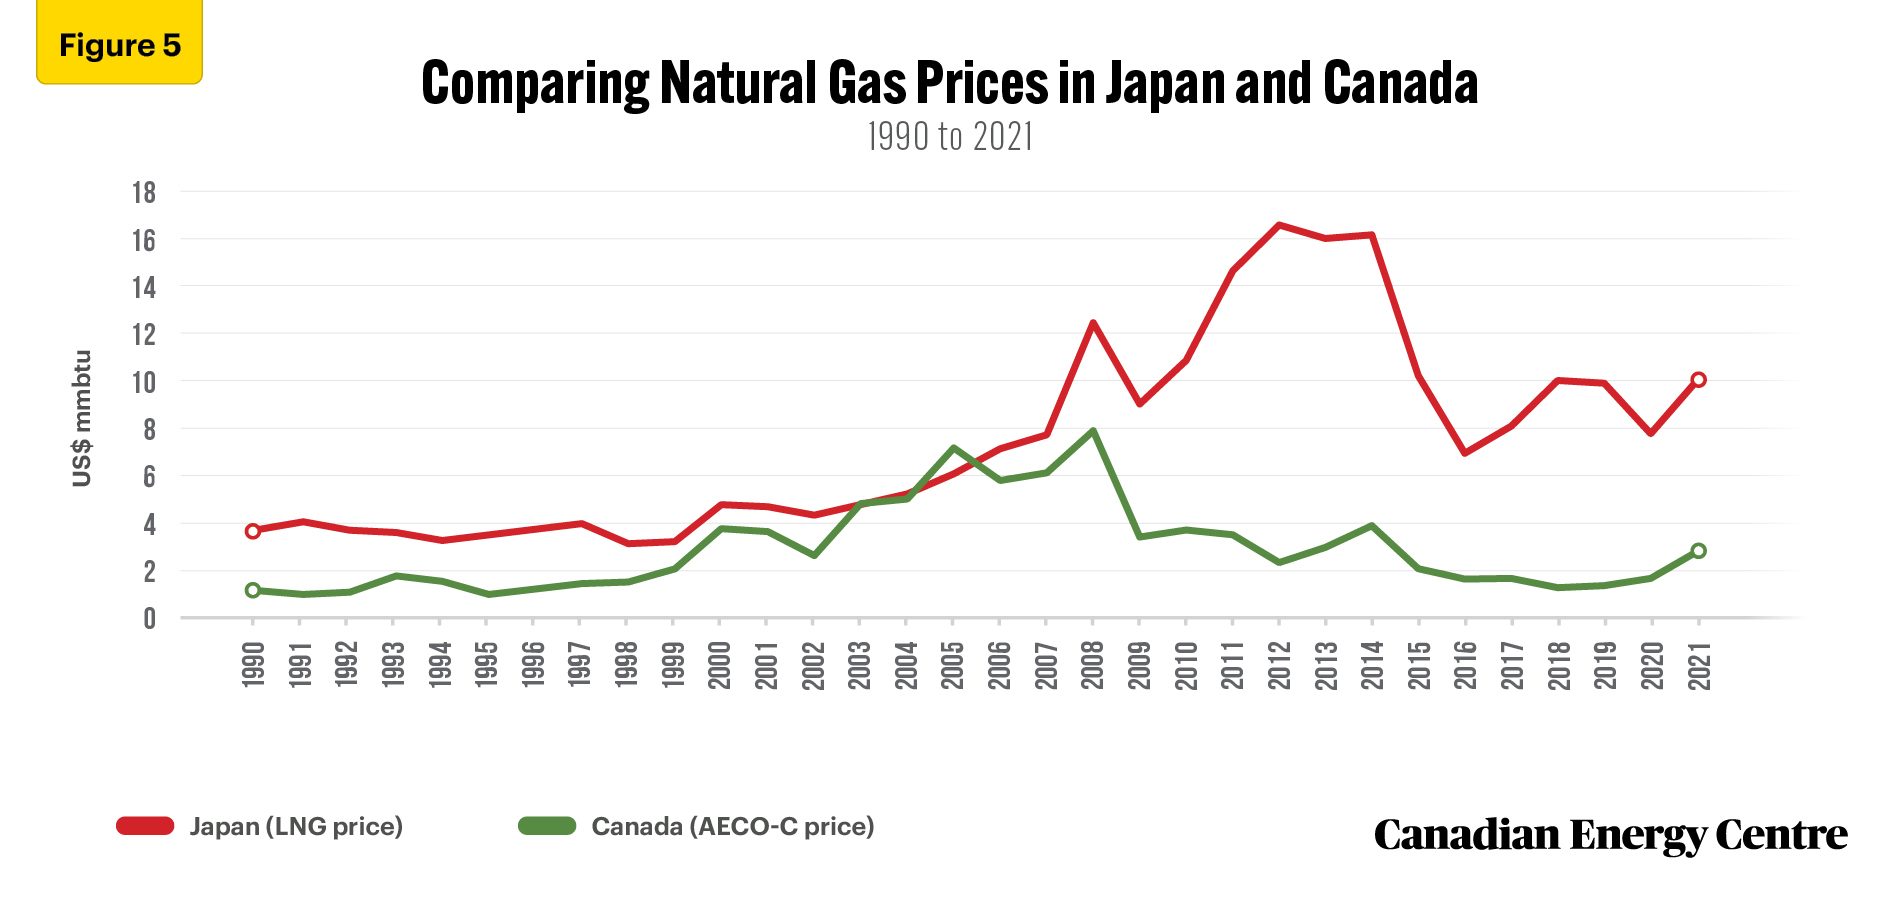
Price comparisons between Canada and Japan generally follow the same pattern; since 2009, price differences between Canada and Japan have been substantial (see Figure 5).
- Price divergence between Japan and Canada began to increase in 2006. Every year after 2006, prices for natural gas in Japan were higher, from 22 per cent more (in 2006) to 751 per cent more (in 2018).
- In 2021, the dollar gap between prices in Canada and Japan was US$7.27 per mmbtu; natural gas sold for US$2.80 per mmbtu in Canada and US$10.07 mmbtu in Japan that year, or 260 per cent more.
Sources: BP Statistical Review of World Energy (2022)
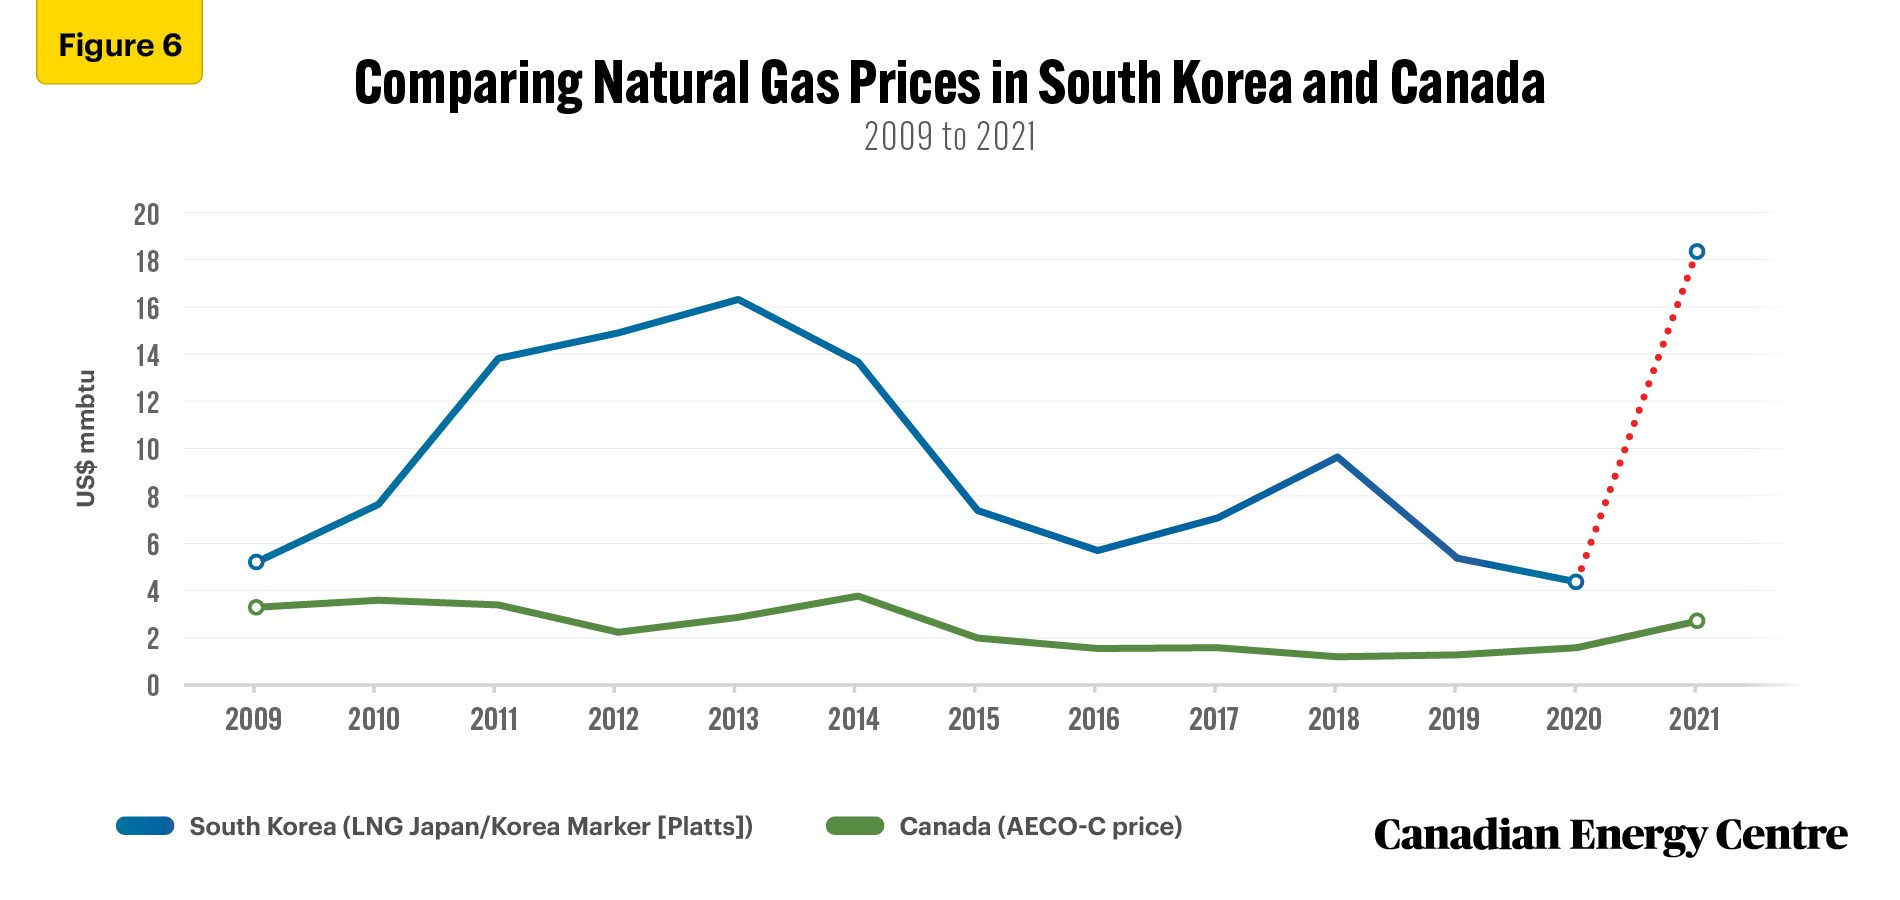
In a comparison with South Korea, where data is available only from 2009 onward, prices for natural gas in that country have always been above those in Canada with the difference ranging from US$1.90 per mmbtu in 2009 to US$15.80 per mmbtu in 2021.
Sources: BP Statistical Review of World Energy (2022)
Natural Gas Pricing in Recent Years
Many factors influence global natural gas prices, including supply and demand, production and exploration levels, the location and size of storage facilities, weather patterns, and buyers’ and sellers’ views of future trends.
In the last two years, two factors have had a profound impact on gas prices. First, Russia’s invasion of Ukraine disrupted global gas supplies and resulted in skyrocketing global gas prices. Second, as the world economy opened up after the COVID lockdown, the demand for natural gas in both developed and developing countries increased.
Benchmark oil prices, such as Brent crude or West Texas Intermediate (WTI), are available for global markets. However, there are no comparable significant international benchmark prices for natural gas. Spot prices for natural gas are region-centric. For example, Henry Hub is the benchmark price for North American natural gas. In Alberta, it is AECO-C; in the U.K., it is the National Balancing Point (NBP); in the Netherlands, it is the Title Transfer Facility (TTF); and in the Asian-Pacific LNG market, it is the Japan/Korea Marker (JKM).
The AECO-C is the spot trading price for Alberta gas. The AECO-C hub is Canada’s largest natural gas trading hub, and the AECO-C price serves as a benchmark for Alberta wholesale natural gas transactions.
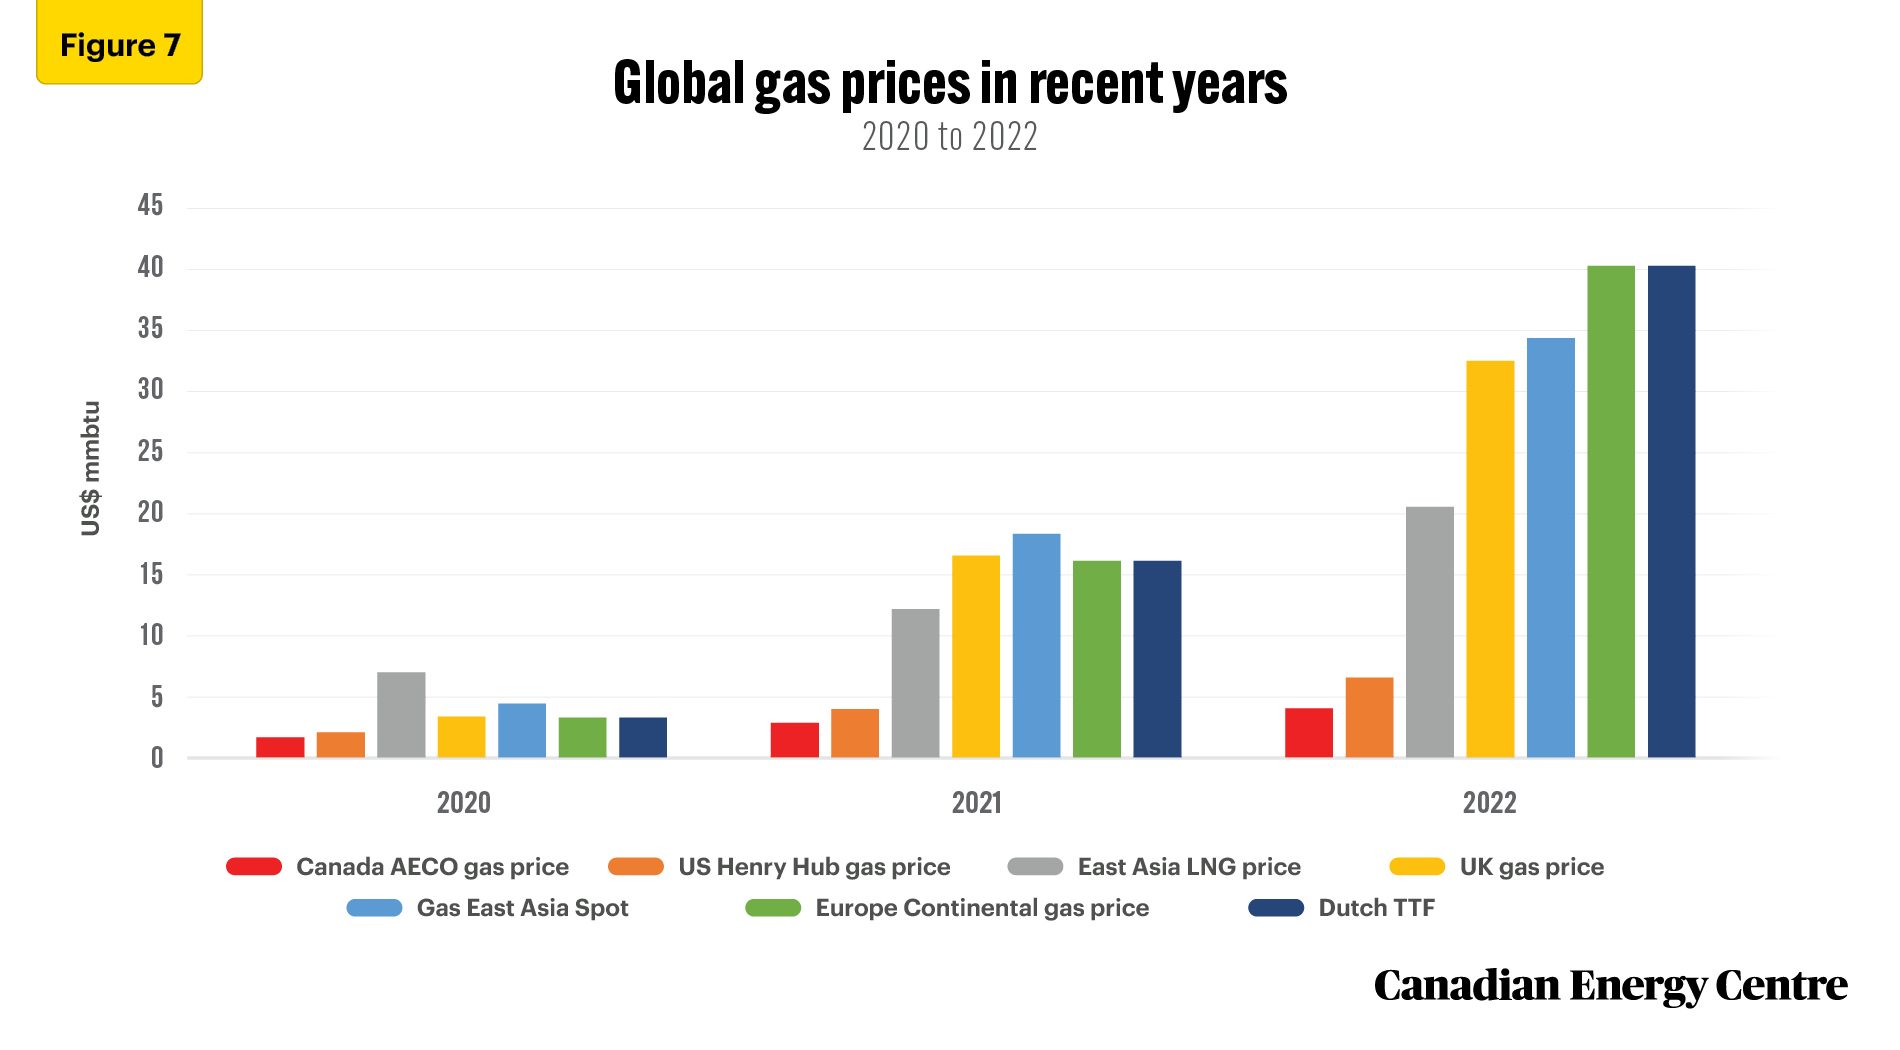
The AECO-C natural gas price is discounted compared to the benchmark price for natural gas in North America, the Henry Hub price. Henry Hub is the central pricing point for natural gas produced in the United States. The AECO-C and Henry Hub price differential increased in 2022 to more than US$2.00 per mmbtu (see Figure 7).
Source: Derived from the Rystad Energy UCube (2023)
The discount for Canadian natural gas relative to Henry Hub exists partly because Alberta and other western Canadian natural gas fields are further away from U.S. markets than American suppliers, and Canadian transportation costs are thus higher.
This, combined with the fact that the U.S. is currently the only market for Canada’s natural gas (Canada has yet to complete a single LNG export terminal, though one is under construction at Kitimat, British Columbia) means that AECO-C natural gas has traded at a discount of more than US$2.00 per mmbtu in recent years, or about 60 per cent of the Henry Hub price.
However, lower natural gas prices in Western Canada can benefit from upcoming liquefied natural gas (LNG) projects designed to transport natural gas to Asia-Pacific markets because they will reduce an LNG plants’ input costs.
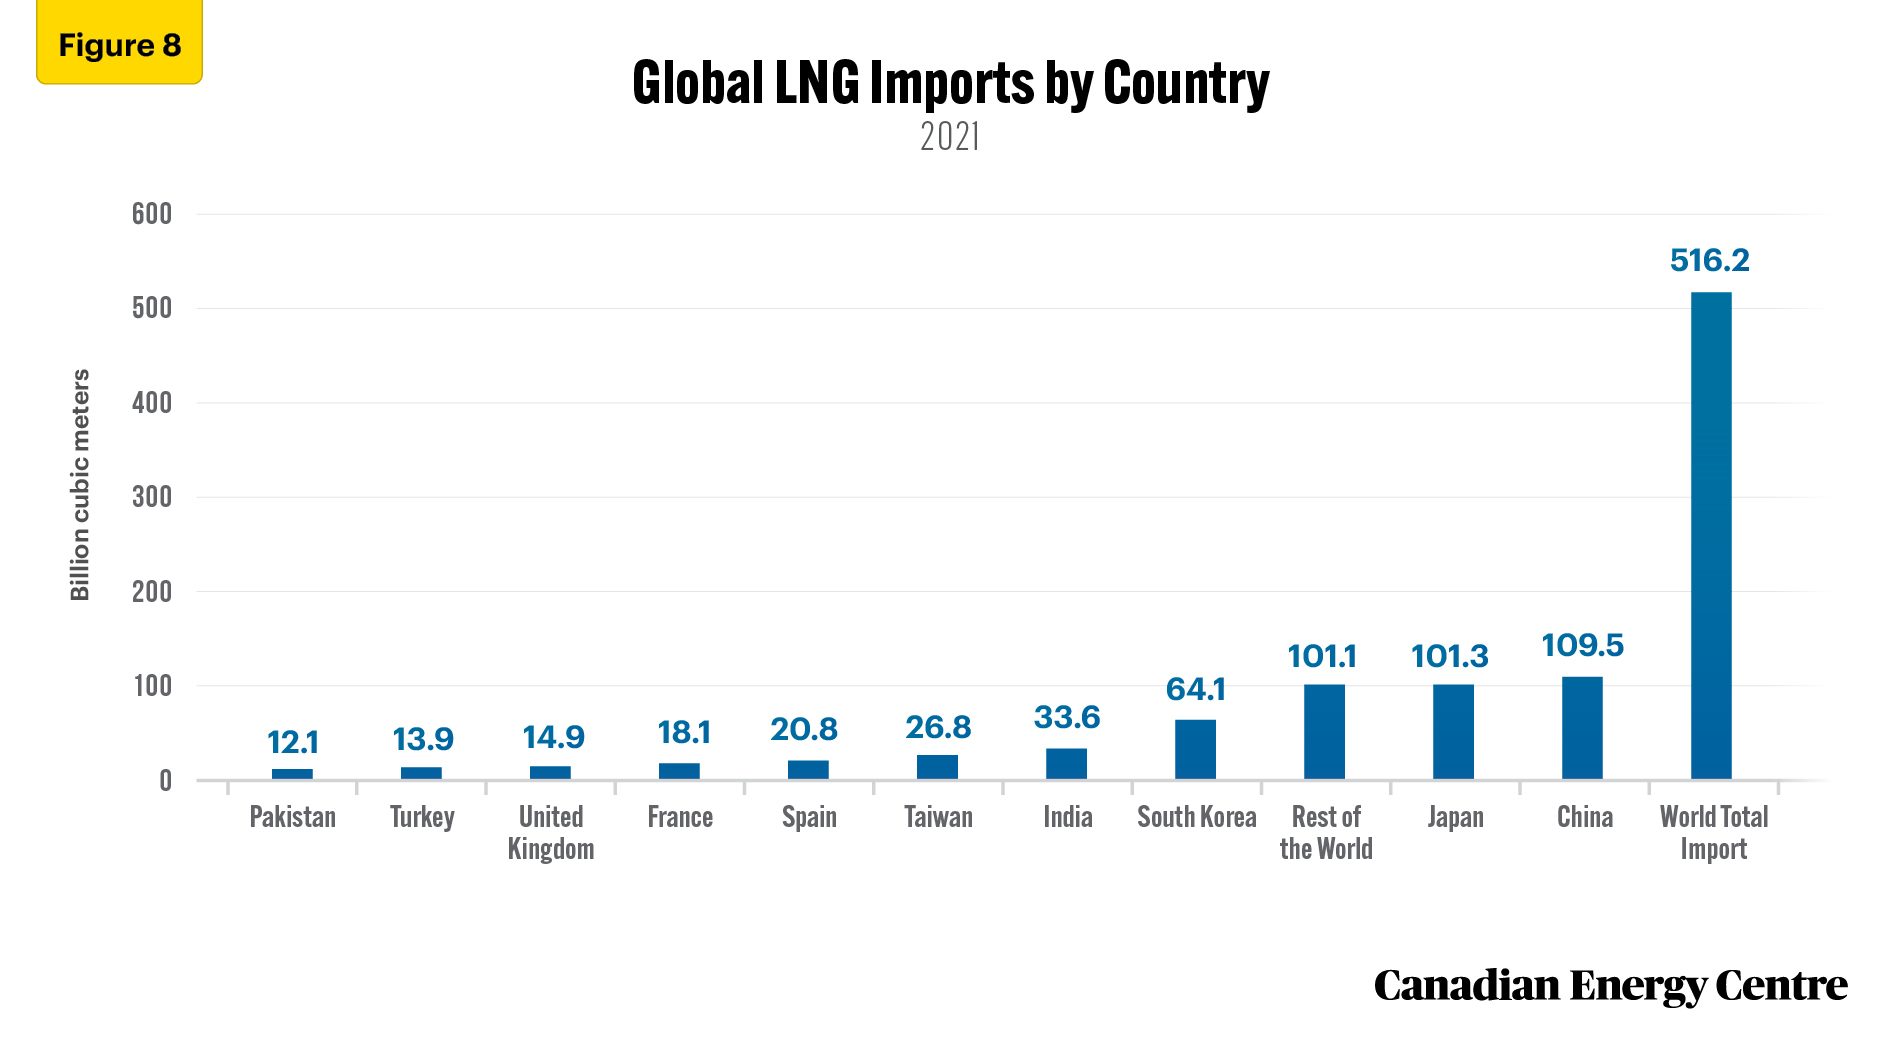
As noted earlier, in recent years, a new benchmark has been developed for LNG in Asia-Pacific markets—the Platts Japan/Korea Marker (JKM)—which is now the benchmark price for LNG deliveries in Japan and Korea. Japan and Korea are among the largest global importers of LNG accounting for 41 per cent of the world’s LNG imports (see Figure 8).
Canada is a late entrant into the LNG market. At one point, 18 LNG projects were proposed. One, LNG Canada, is under construction in B.C. Four additional facilities are proposed in the province: Woodfibre LNG, Tilbury LNG, Cedar LNG and Ksi Lisims LNG.
Given that the demand for LNG in the Asia-Pacific market is currently being filled by traditional players such as Qatar and Australia, the entry of new players, such as Canada, will create a different dynamic in the coming years. The AECO-C benchmark natural gas price is lower than the Asia-Pacific benchmark LNG price, which could mean that buyers in the Asian-Pacific might turn to Canadian LNG for supply, assuming the near- to medium-term completion of LNG projects in Canada.
Source: BP Statistical Review of World Energy (2022)
Canada’s Natural Gas Advantage
Western Canada currently has a cost advantage over other LNG-exporting countries such as the U.S. and Australia.
- This is partly due to lower ambient temperatures in Canada’s western provinces (cooler temperatures help lower liquefaction costs). Specifically, British Columbia’s temperature is cooler than other major LNG-producing regions such as Qatar, Australia, and the U.S. Gulf Coast. British Columbia has an energy efficiency advantage of 34 per cent over Australia, 32 per cent over Qatar, and 26 per cent over the U.S. Gulf Coast for LNG liquefication.
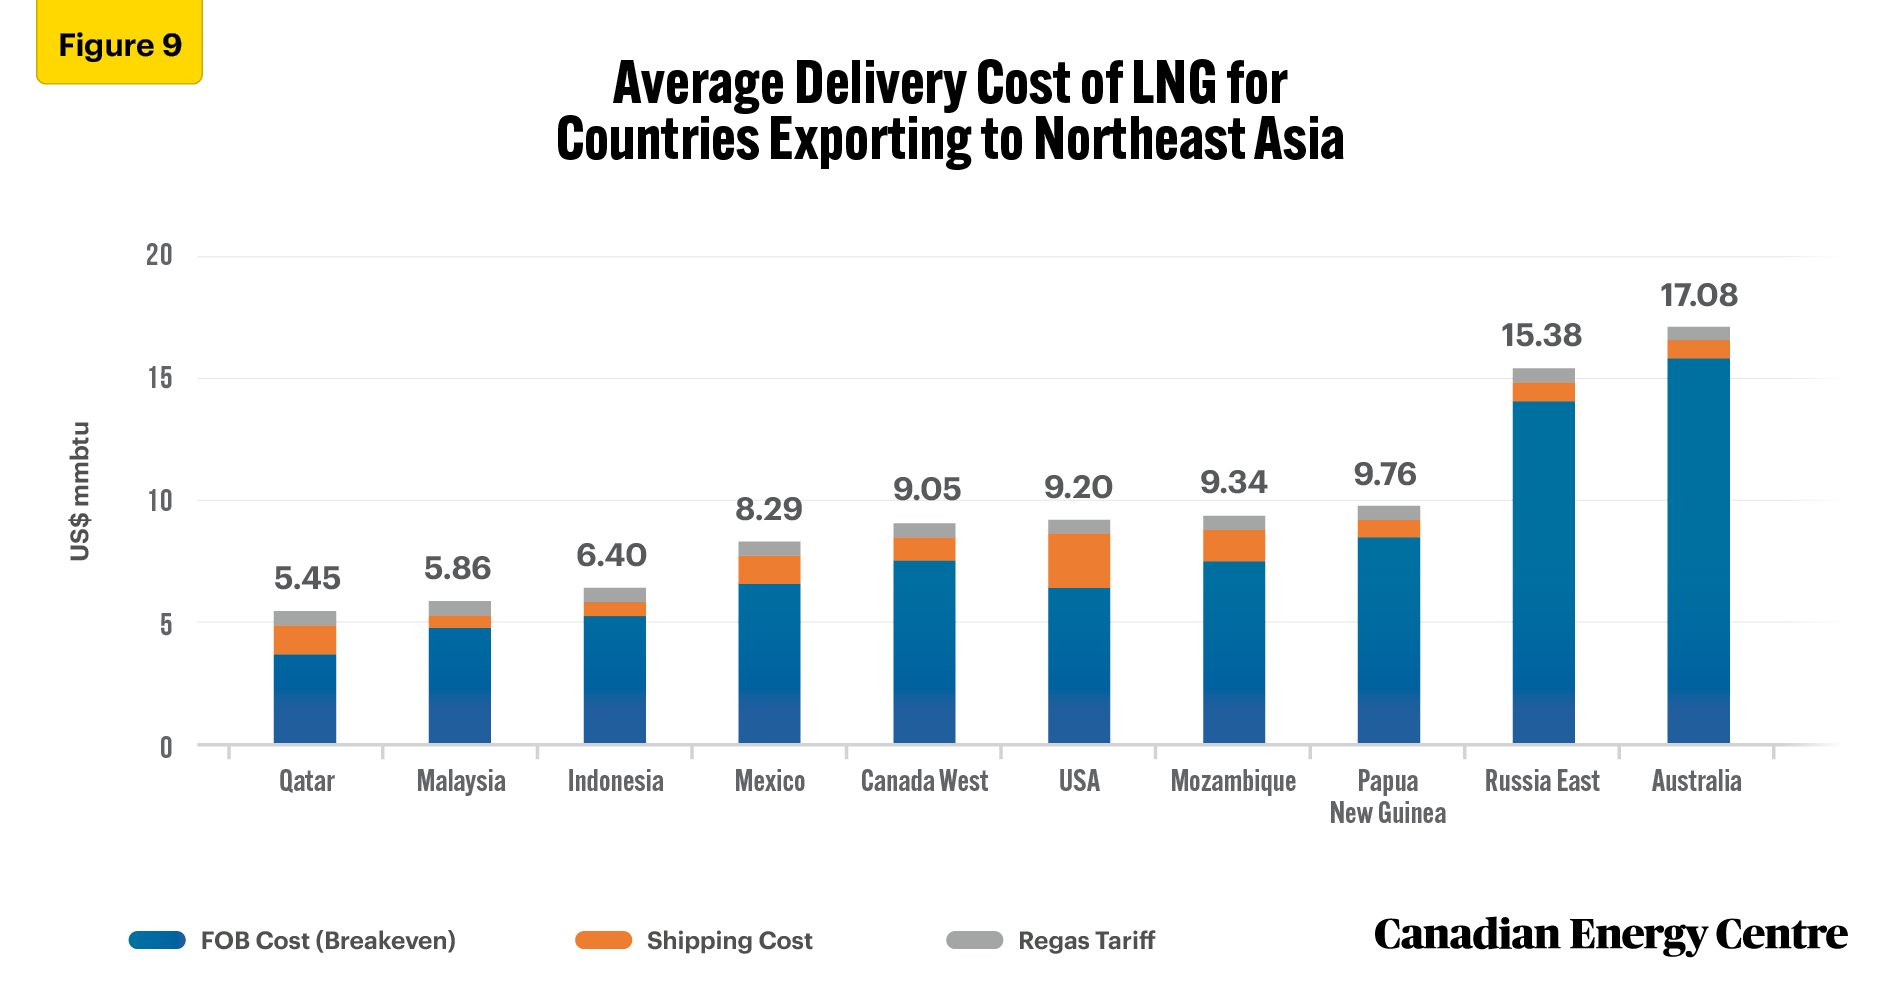
- Qatari LNG is the most competitive from a cost perspective. However, LNG buyers have concerns about becoming overly dependent on one country. Shipping costs to Northeast Asia from Canada are estimated at about 96 cents per mmbtu. In comparison, shipping costs to Northeast Asia from the U.S. Gulf of Mexico are estimated at US$2.22 per mmbtu (see Figure 9). Further, Canada’s West Coast is closer to Japan than Qatar is to Japan; Qatar is 11,773 kilometres from the Japanese port of Himeji and 12,056 kilometres away from the port at Sodegaura. Meanwhile, Canada’s westernmost port (Kitimat) in British Columbia is 7,698 kilometres from Himeji and 7,322 kilometres from Sodegaura.
Source: Wood Mackenzie (2022)
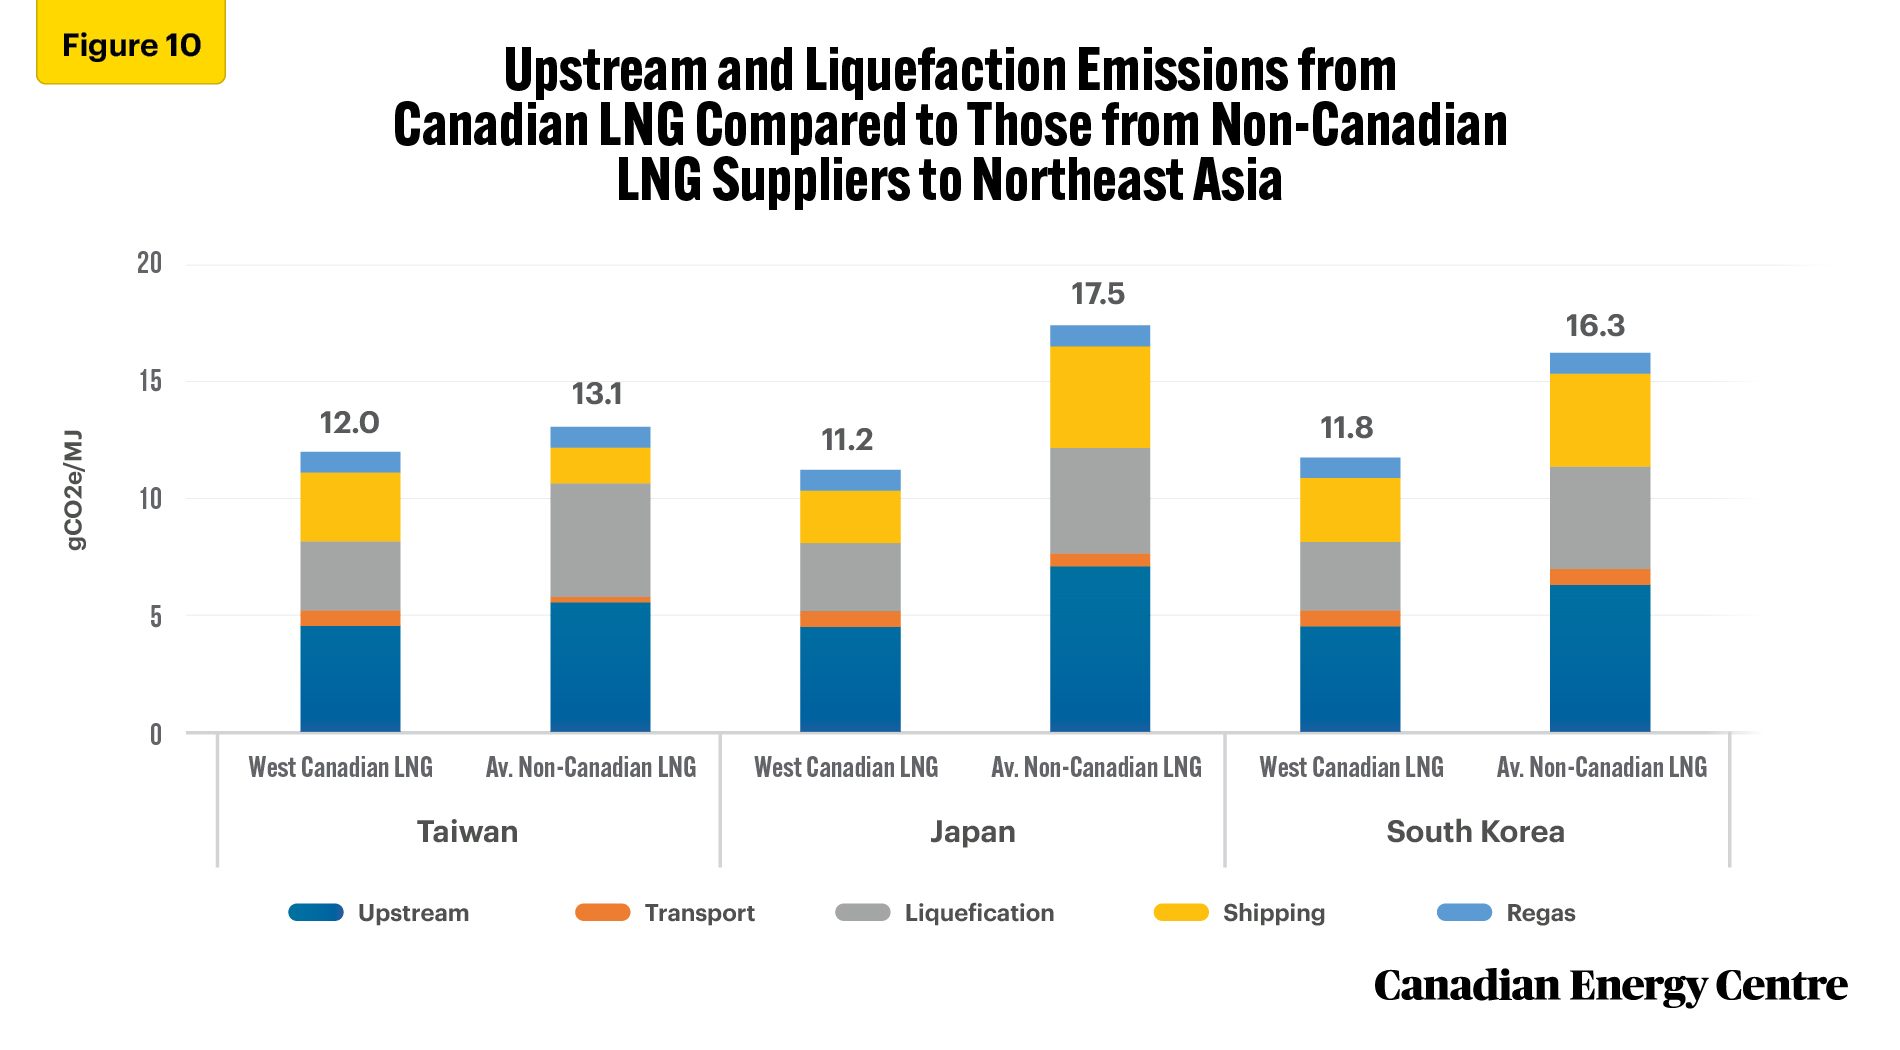
• Canadian LNG going to Northeast Asia is also among the lowest emitting sources of LNG. Canadian LNG has fewer upstream and liquefaction emissions than the average Northeast Asia LNG supplier (see Figure 10).
These distinct advantages of Canadian LNG offer a compelling case for Canadian liquefied natural gas exports to the Asia-Pacific.
Source: Wood Mackenzie (2022)
Conclusion
Comparing the market for natural gas in the form of LNG between Western Canada and the Asia-Pacific shows that the price difference between Canada and Asia provides an opportunity for natural gas produced in Canada to be exported to Asia Pacific markets.
The Russian invasion of Ukraine and the after-effects of the COVID pandemic have rekindled the debate about global energy policies. The world is looking for energy security and every country wants to reduce its dependence on one country for the majority of its energy needs.
The lower liquefaction and shipping costs coupled with the lower cost of the natural gas itself in Western Canada translate into lower LNG prices in Canada. Those advantages will help make Canadian LNG very competitive and attractive to the Asia Pacific market.
The price differentials, along with Canada’s natural advantages, give Western Canada an excellent opportunity to supply natural gas to the Asia-Pacific markets at competitive prices while also bolstering energy security for countries such as Japan and Korea. Canadian LNG could be a strong competitor to the traditional natural gas exporting countries now serving the Asia-Pacific LNG market.
References (All links live as of February 25, 2023)
Alberta Energy Regulator (Undated), Natural Gas Prices, <https://www.aer.ca/providing-information/data-and-reports/statistical-reports/st98/prices-and-capital-expenditure/natural-gas-prices>.
BP (2023), Energy Outlook, 2023 edition, <https://www.bp.com/en/global/corporate/energy-economics/energy-outlook.html>.
BP (2022), Statistical Review of World Energy 2022 (71st edition), <https://www.bp.com/en/global/corporate/energy-economics/statistical-review-of-world-energy.html>.
Canadian Energy Regulator (2017), Market Snapshot: LNG Projects have an Energy Efficiency Advantage Compared to Other LNG Producers in Warmer Locations, Government of Canada, <https://www.cer-rec.gc.ca/en/data-analysis/energy-markets/market-snapshots/2017/market-snapshot-lng-projects-have-energy-efficiency-advantage-compared-other-lng-producers-in-warmer-locations.html>.
Claudio Steuer (2019), Outlook for Competitive LNG Supply, Oxford Institute of Energy Studies, <https://www.oxfordenergy.org/publications/outlook-competitive-lng-supply/>.
International Energy Agency (IEA) (2022), World Energy Outlook 2022 <https://www.iea.org/reports/world-energy-outlook-2022>.
IEA (2022), Gas Market Report Q4-2022, <https://www.iea.org/reports/gas-market-report-q4-2022>
International Monetary Fund (IMF) (2023), Global price of LNG, Asia (PNGASJPUSDM), Retrieved from FRED, Federal Reserve Bank of St. Louis, <https://fred.stlouisfed.org/series/PNGASJPUSDM>.
J. Peter Findlay (2019), Canadian LNG Competitiveness, Oxford Institute of Energy Studies, <https://www.oxfordenergy.org/wpcms/wp-content/uploads/2019/12/Canadian-LNG-Competitiveness-NG-156.pdf>.
Natural Resource Canada (Undated), Energy Facts, Government of Canada, <https://natural-resources.canada.ca/science-and-data/data-and-analysis/energy-data-and-analysis/energy-facts/20061>.
Rystad Energy UCube (2023), Upstream Solution, <https://www.rystadenergy.com/services/upstream-solution>.
U.S. Energy Information Administration (Undated), Natural Gas Imports and Exports, Natural Gas Explained <https://www.eia.gov/energyexplained/natural-gas/imports-and-exports.php>.
Wood Mackenzie (November 2022), The Role of Canadian LNG in Asia, Public Report (November), <https://www.canadianenergycentre.ca/wp-content/uploads/2022/11/WM-CEC-Role-of-Canadian-LNG-in-Asia-Public-Report.pdf>
CEC Research Briefs
Canadian Energy Centre (CEC) Research Briefs are contextual explanations of data as they relate to Canadian energy. They are statistical analyses released periodically to provide context on energy issues for investors, policymakers, and the public. The source of profiled data depends on the specific issue.
About the authors
This CEC Research Brief was compiled by Ven Venkatachalam, Chief Research Analyst, Canadian Energy Centre and Lennie Kaplan, Executive Director of Research, Canadian Energy Centre. The authors and the Canadian Energy Centre would like to thank and acknowledge the assistance of two anonymous reviewers in reviewing the data and research for the initial edition of this Research Brief.
Creative Commons Copyright
Research and data from the Canadian Energy Centre (CEC) is available for public usage under creative commons copyright terms with attribution to the CEC. Attribution and specific restrictions on usage including non-commercial use only and no changes to material should follow guidelines enunciated by Creative Commons here: Attribution-NonCommercial-NoDerivs CC BY-NC-ND.