Social
To sign up to receive the latest Canadian Energy Centre research to your inbox email: research@canadianenergycentre.ca
Download the PDF here
Download the charts here
Overview
As news reports and interest about the Canadian oil sands continues, it is a good time to evaluate the sector’s progress in reducing carbon dioxide (CO2) emissions intensity.
In this CEC Fact Sheet, we use data on projected direct upstream CO2 emissions intensity drawn from Rystad Energy’s UCube and EmissionsCube to assess trends in the CO2 emissions intensity of Canada’s oil sands sector between 2000 and 2022.
Background on Rystad Energy’s UCube and EmissionsCube
Rystad Energy is an independent energy research company providing data, analytics, and consultancy services to clients around the globe.¹
UCube is Rystad Energy’s global upstream database. It includes production and economics (costs, revenues, and valuations) for more than 85,000 assets covering the portfolios of more than 3,500 companies. Policymakers use the UCube dataset to study all parts of the global exploration and production (E&P) activity value chain, including operational costs, investment (capex and opex), fiscal terms, and net cash flows for projects and companies, both globally and by country (Rystad, 2023b).
Rystad’s EmissionsCube enables the study of CO2e emissions from upstream activity down to the asset level.
Through the EmissionsCube, countries, companies, assets, basins, and fields can be compared with each other on their upstream emissions and emissions intensity. Specifically, EmissionsCube can help policymakers:
- Compare companies in order to understand their emission performance and assess risks.
- Understand the relative ranking of countries, operators, and companies (taking ownership into account) globally, and the changes or initiatives that will improve emission performance.
- Identify the high-emitting parts of an operation and, from that, develop ESG strategies to both meet increasing demands for disclosure and emission reduction goals.
- Assess the impact of emissions on various companies’ competitiveness (Rystad, 2023a).
1. The written content in this report was prepared by the authors at the Canadian Energy Centre (CEC) and does not represent the views of Rystad Energy
Examining oil sands CO2 emissions intensity
This Fact Sheet defines upstream CO2 emissions as those originating from on-site emissions, both extraction and flaring. Extraction includes production drilling; all emissions related to on-site processing; and gathering and boosting.
This Fact Sheet defines CO2 emissions intensity as the amount of CO2 emitted, expressed in kilograms (kg), per barrel of oil equivalent (boe) produced (i.e., kg CO2 per boe produced). A declining CO2 emission intensity figure means that less CO2 is being created per boe produced.
Focusing on emissions per boe produced is a realistic means of establishing a meaningful target for the oil sands industry in Canada.
Average CO2 emissions per oil sands barrel produced in Canada has declined by over 32% since 2000
Canada’s oil sands sector has made considerable progress in reducing its CO2 emissions intensity since 2000.
The overall rate fell from 101.7 kg CO2 per boe produced in 2000 to 68.7 kg CO2 per boe produced in 2022, a decline of 32.4 per cent (see Figure 1).
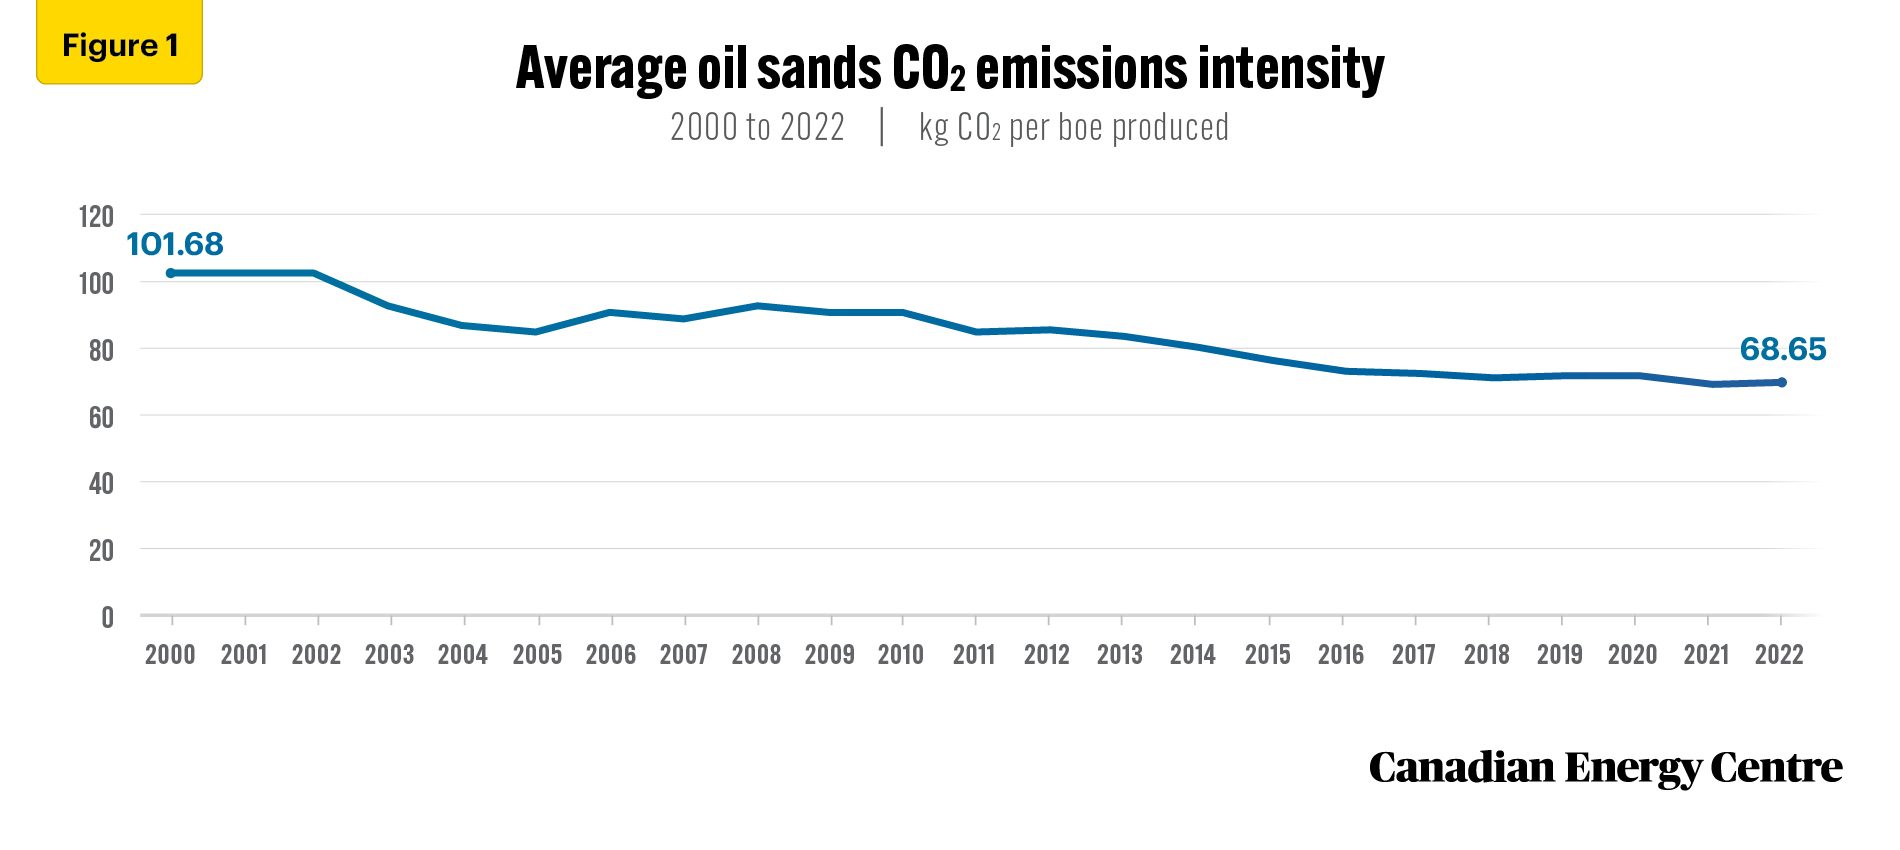
Source: Derived from the Rystad Energy UCube and EmissionsCube
Average oil sands (mining) CO2 emissions per barrel produced in Canada declines by over 40% since 2000
An examination of upstream oil sands CO2 emissions intensity by type reveals some interesting trends.
The average emissions intensity of oil sands (in-situ) fell from 89.2 kg CO2 per boe produced in 2000 to 72.9 kg CO2 per boe produced in 2022, a decline of 18.3 per cent.
Meanwhile, the average emissions intensity of oil sands (mining) fell from 107.0 kg CO2 per boe produced in 2000 to 63.8 kg CO2 per boe produced in 2022, a decline of 40.4 per cent (see Figure 2).
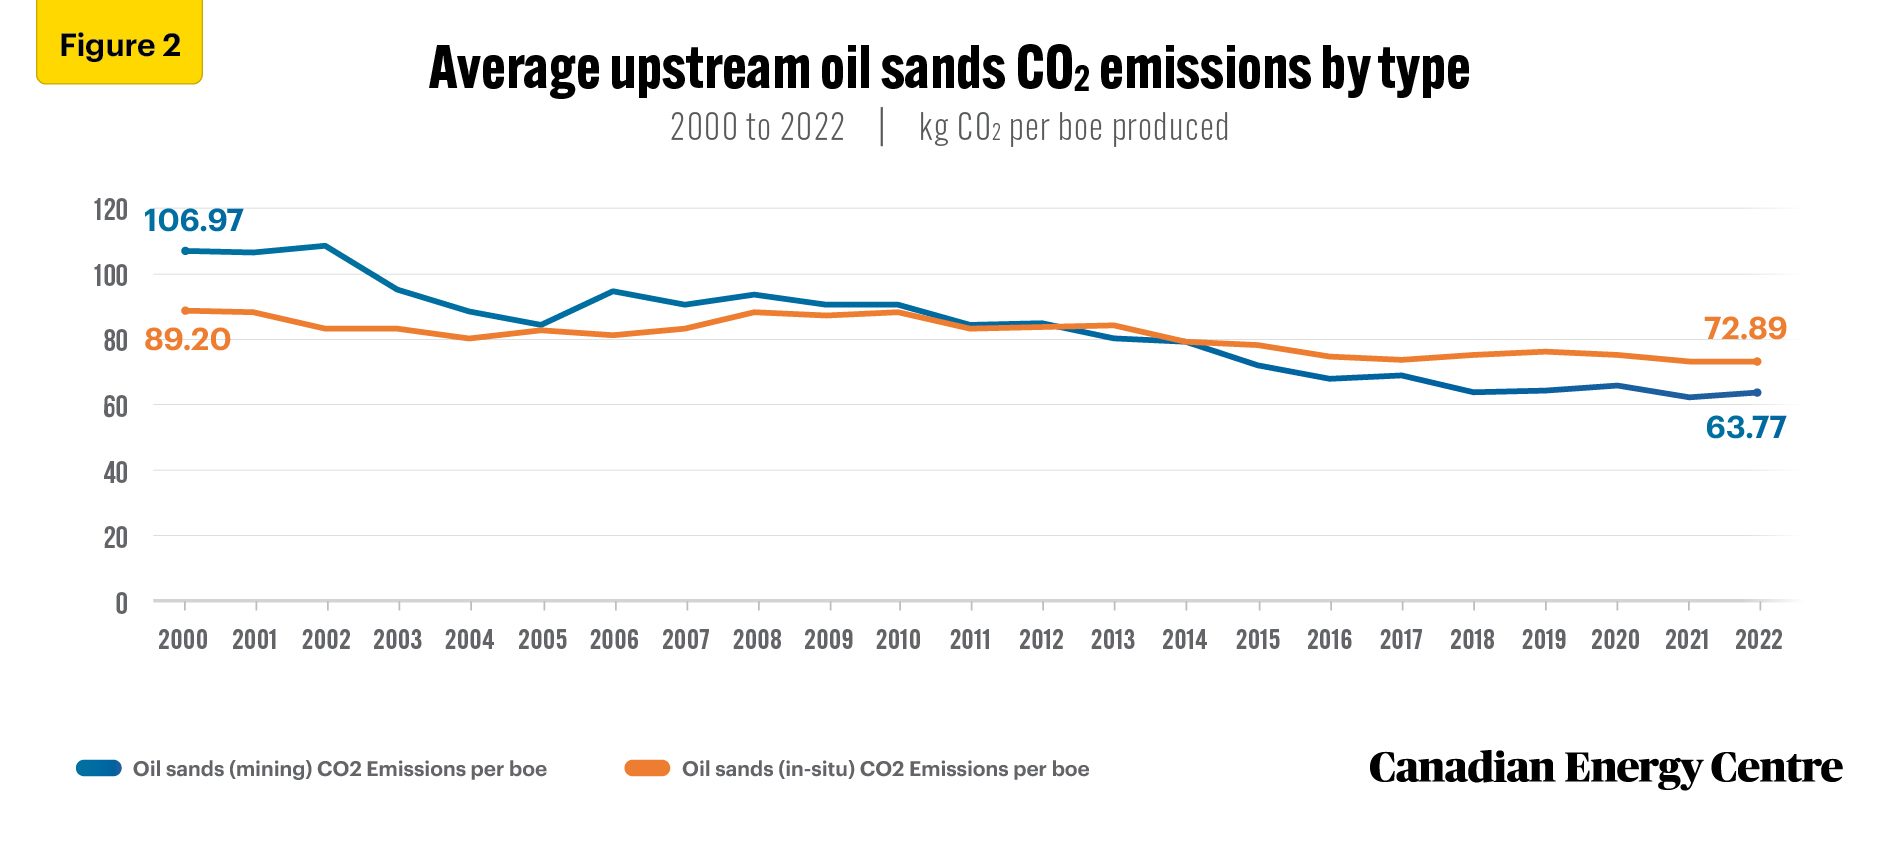
Source: Derived from the Rystad Energy UCube and EmissionsCube
Notes
This CEC Fact Sheet was compiled by Lennie Kaplan at the Canadian Energy Centre (www.canadianenergycentre.ca). The author and the Canadian Energy Centre would like to thank and acknowledge the assistance of two anonymous reviewers in reviewing the original data and research for this Fact Sheet.
References (All links live as of August 28, 2023)
Rystad Energy (2023a). EmissionsCube. Emissions Solution. <https://bit.ly/3eAyIAs>; Rystad Energy (2023b). UCube. Upstream Solution. <https://bit.ly/3JTk2JK>; S&P Global Commodity Insights (2023). Canadian Oil Sands Continue Their Trend of GHG Intensity Reductions in 2022 — Down 23% Since 2009. <https://bit.ly/3sobIeV>.
Creative Commons Copyright
Research and data from the Canadian Energy Centre (CEC) is available for public usage under creative commons copyright terms with attribution to the CEC. Attribution and specific restrictions on usage including non-commercial use only and no changes to material should follow guidelines enunciated by Creative Commons here: Attribution-NonCommercial-NoDerivs CC BY-NC-ND.