Social
To sign up to receive the latest Canadian Energy Centre research to your inbox email: research@canadianenergycentre.ca
Download the PDF here
Download the charts here
Overview
Building new oil export pipeline infrastructure over the long-term, such as the Trans Mountain Expansion (TMX), Keystone XL, Northern Gateway and Energy East, is critical to enhancing North American energy security and diversifying markets, especially to emerging and developing economies in the Asia-Pacific region.
Market diversification will result in Canadian oil fetching higher prices, reducing the discount on diluted bitumen prices (expressed as Western Canadian Select blend or WCS) relative to global benchmarks such as West Texas Intermediate (WTI) and Brent.
In this CEC Fact Sheet, we examine key metrics associated with the addition of new export pipeline capacity, including how this impacts market access, the oil price discount, global oil demand, and the accrual of benefits to the Canadian economy.
Canadian export pipeline expansion is needed for oil producers to meet rising global oil demand, particularly from emerging and developing economies
Additional Canadian export pipeline infrastructure is needed for oil producers and citizens to benefit from rising oil demand from emerging and developing economies over the next three decades.
According to the International Energy Agency (IEA), global crude oil demand is expected to rise from 96.6 million barrels per day (mb/d) in 2019 to 103 mb/d in 2050, an increase of 6.4 mb/d (IEA, 2021b).
Most of the increased crude oil demand growth is expected to come from emerging and developing economies, where consumption is projected to increase from 45.6 mb/d in 2019 to 63.2 mb/d in 2050, an increase of 17.6 mb/d, or nearly 39 per cent (see Figure 1) (IEA, 2021b).
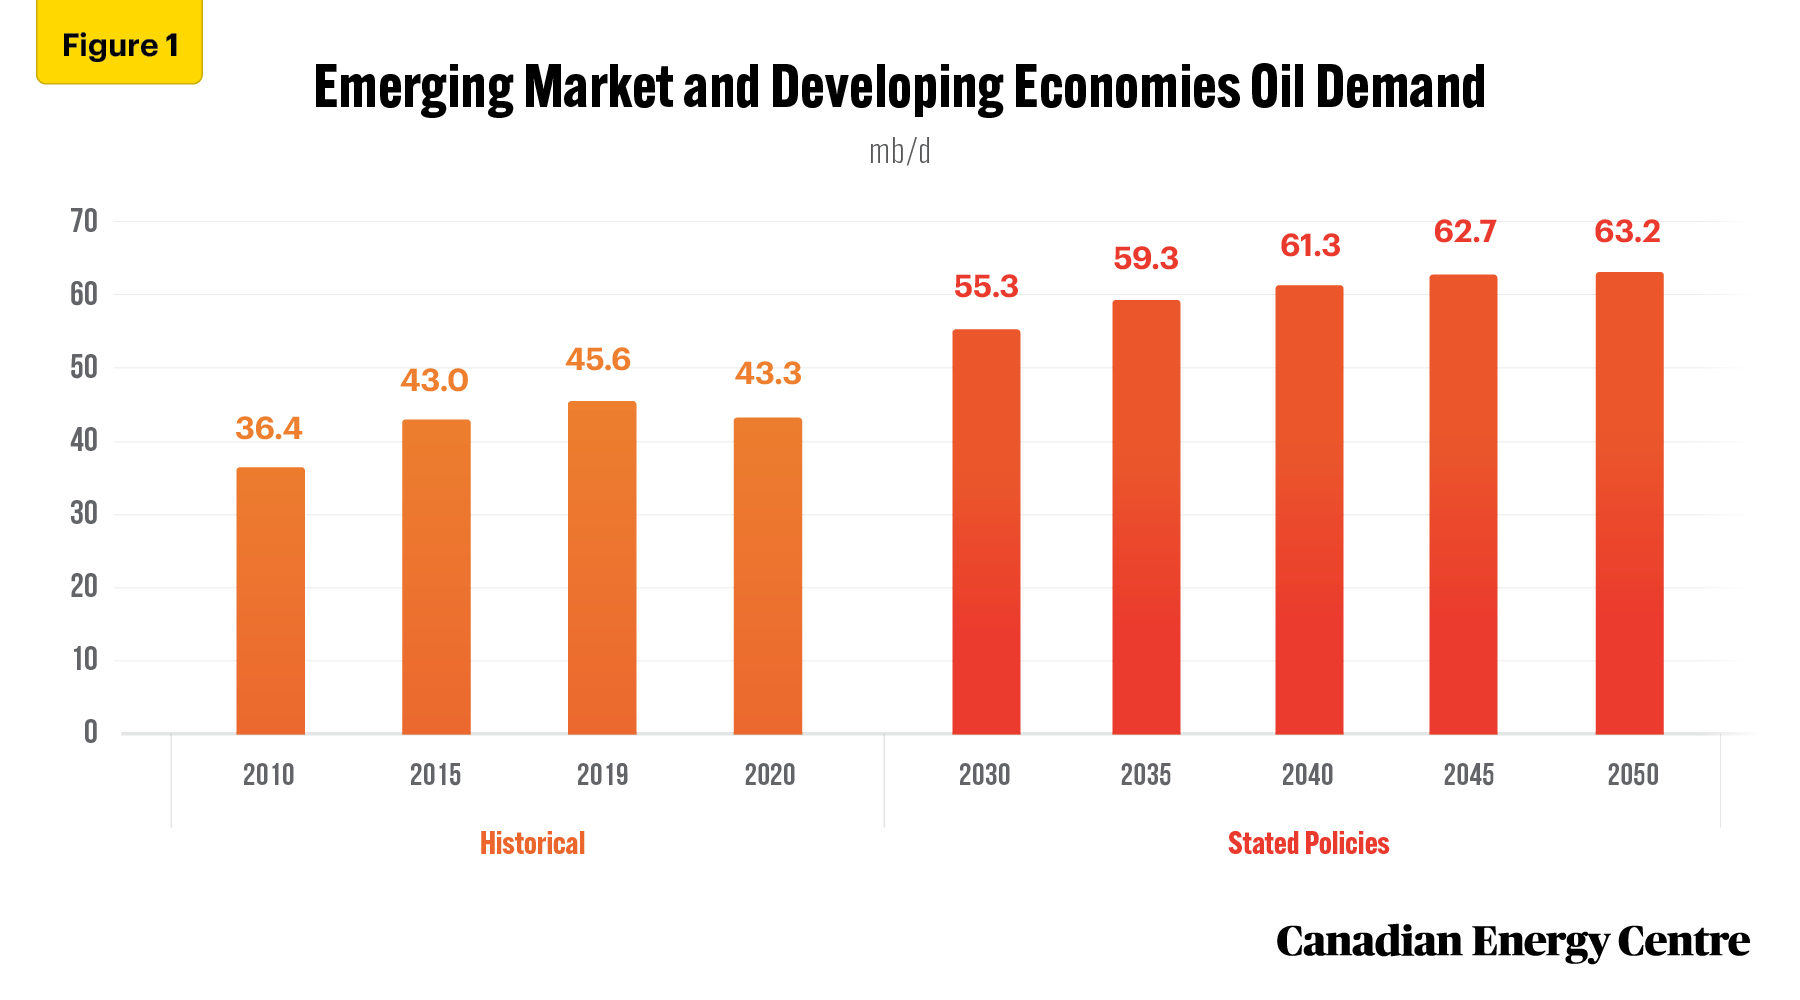
Source: IEA, 2021(b)
Canadian crude oil production has the potential to take advantage of growing global oil demand
Canadian crude oil production is projected to rise over the next 30 years and has the potential to meet growing global oil demand.
According to the Canada Energy Regulator (CER), crude oil production under its Current Policies Scenario grows from 4.9 mb/d in 2019 to 6.6 mb/d in 2050, an increase of 1.7 mb/d, or nearly 35 per cent (see Figure 2) (CER, 2021).
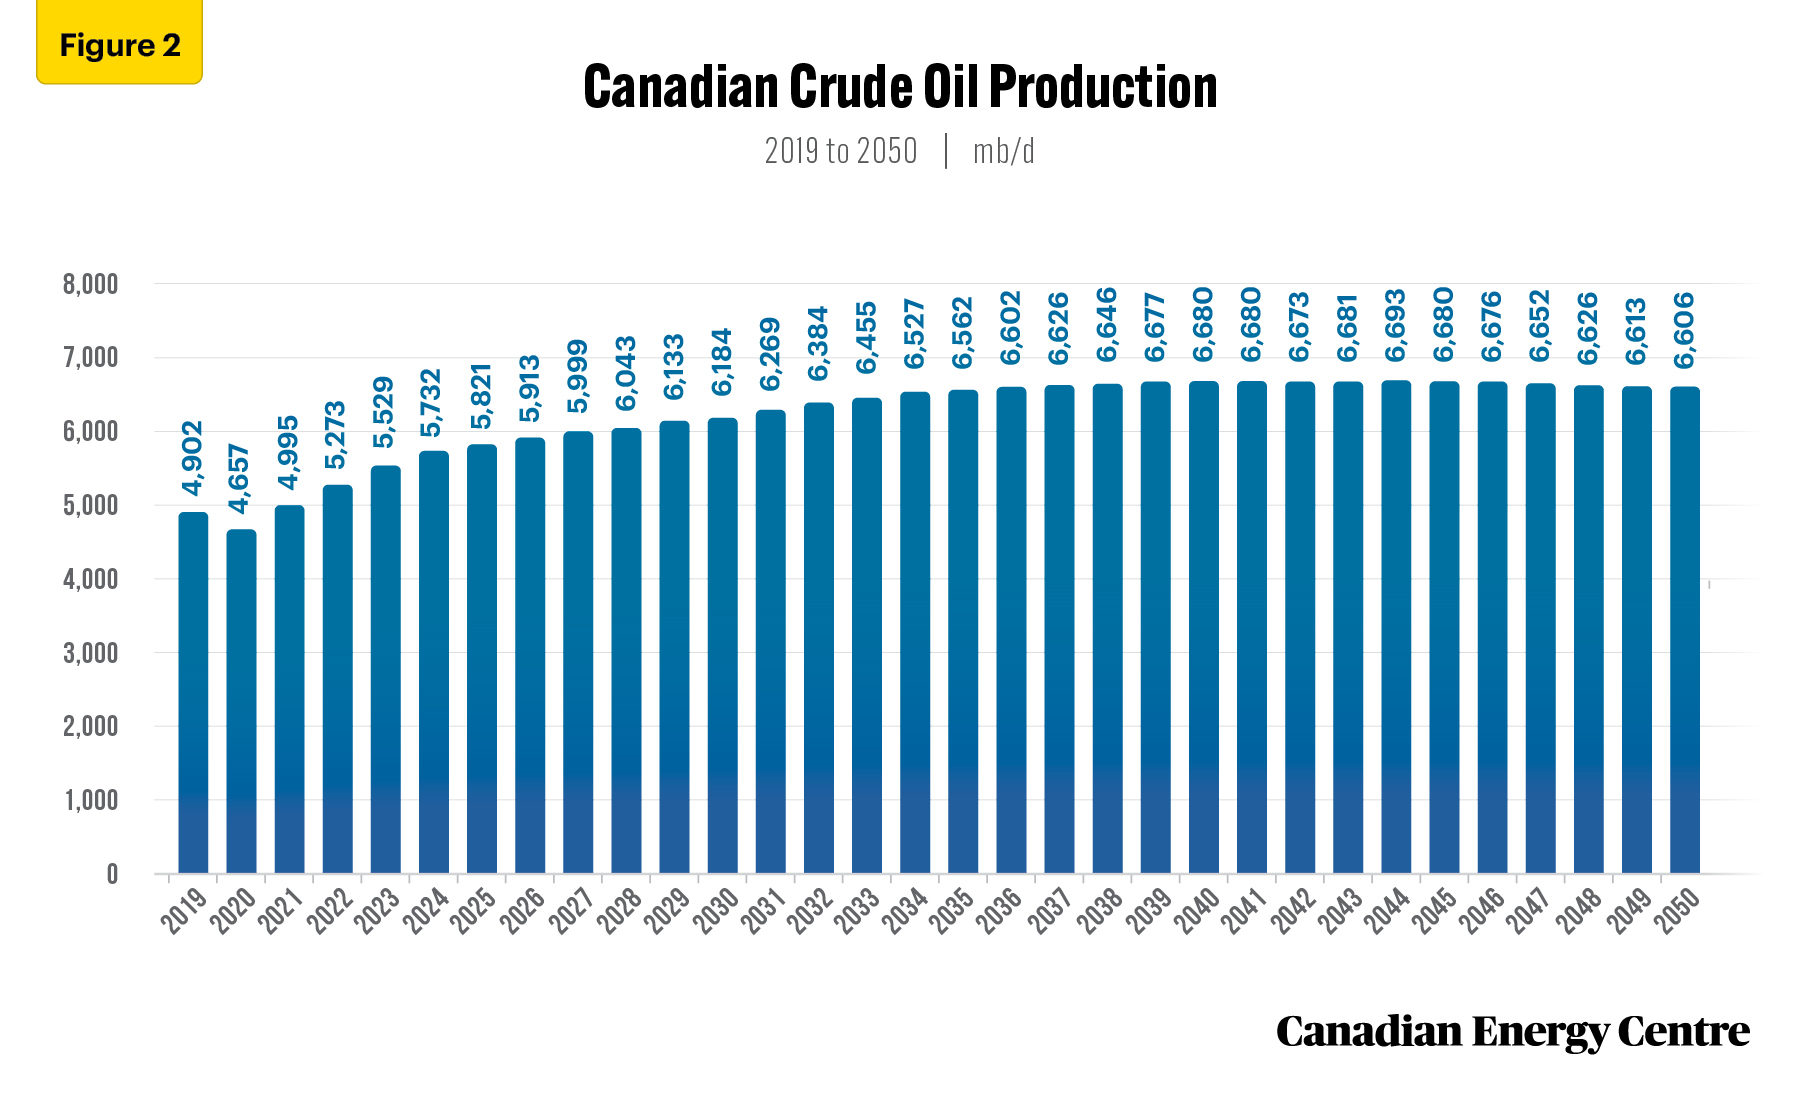
Source: CER, 2021
Canadian crude oil pipeline exports continue to be strong
In 2020, the use of export pipelines to transport crude oil to U.S. markets continued to be strong, even in the face of COVID-19 and pipeline constraints, establishing the opportunity for new export pipeline infrastructure.
According to the Canada Energy Regulator (CER), in 2020, total crude oil exports from Canada were nearly 3.7 mb/d (CER, 2021).Nearly 88 per cent of those crude oil exports moved by pipeline – 3.21 mb/d in 2020, even with effects of COVID-19 lockdowns (CER, 2021).
Between 2010 and 2020, crude oil exports by pipeline grew from over 1.7 mb/d to over 3.2 mb/d, an increase of over 1.4 mb/d or 84 per cent (see Figure 3) (CER, 2021).
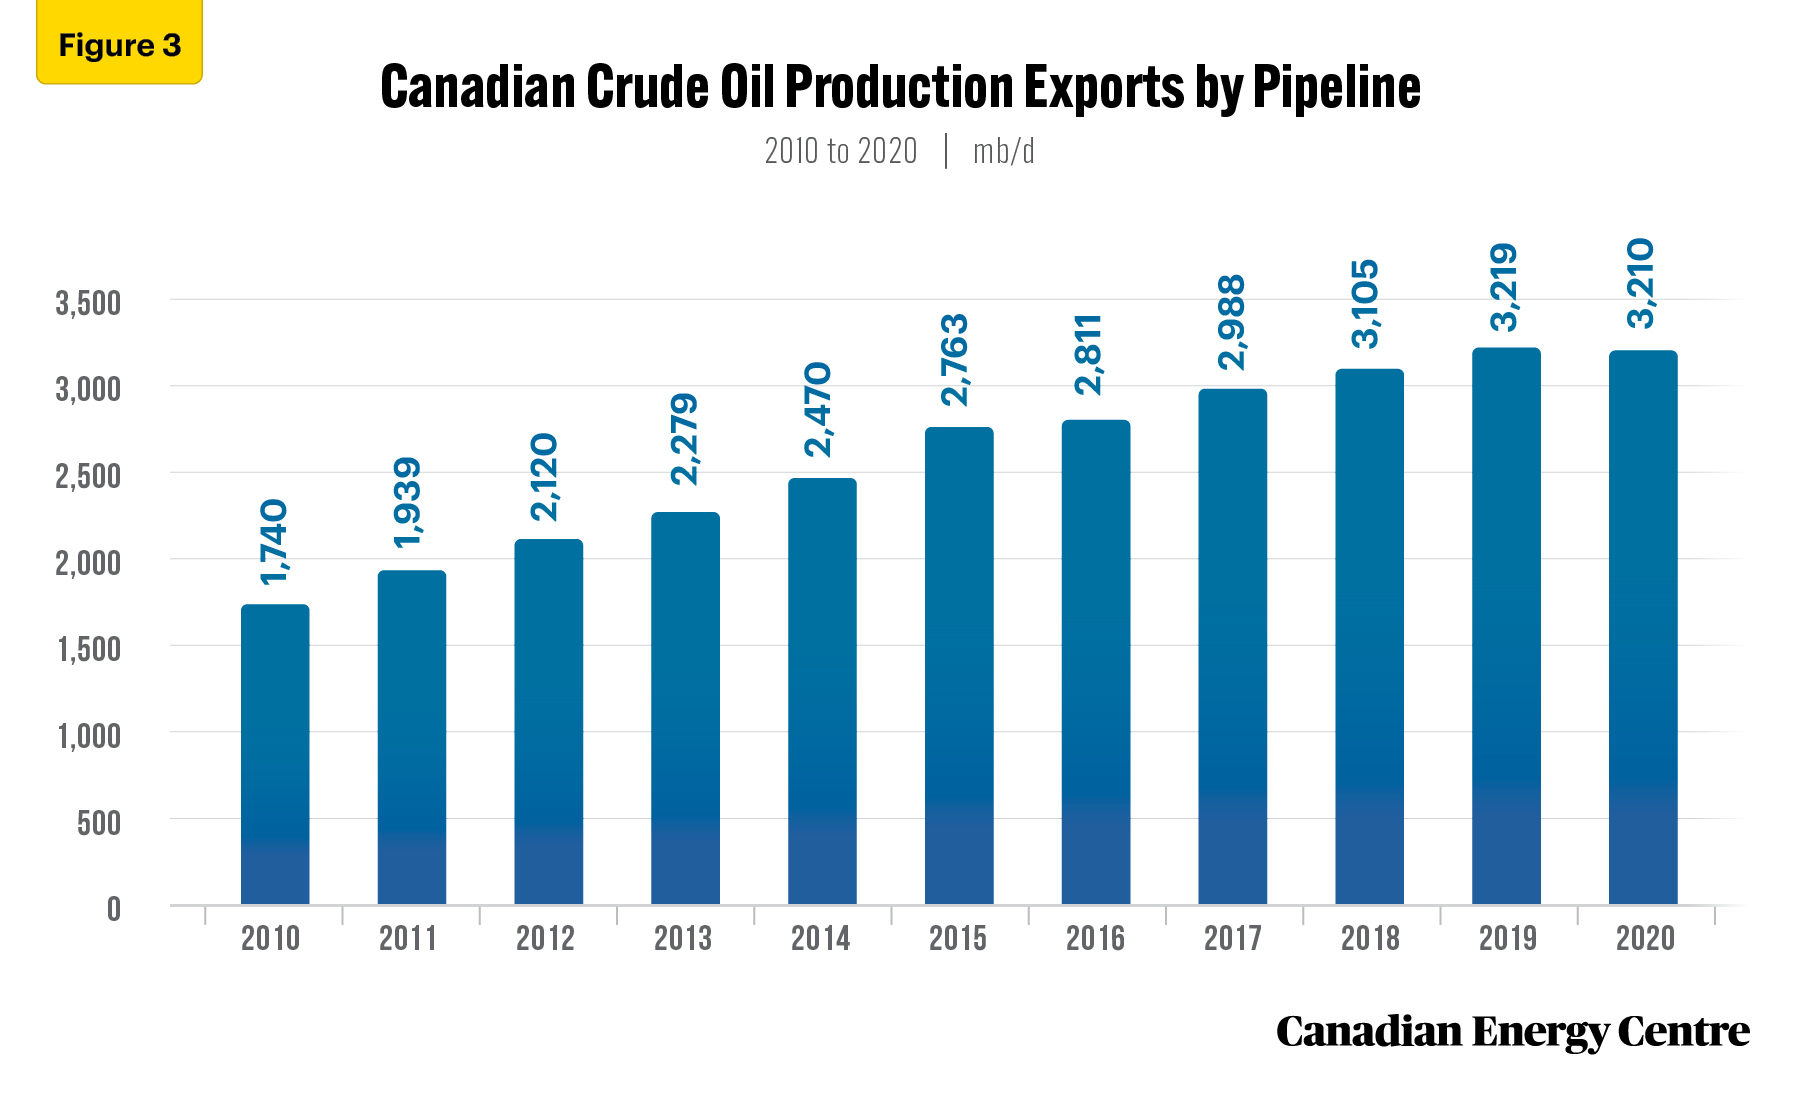
Source: CER, 2021
Canadian export pipeline expansion projects positioned to meet the needs of target U.S. and offshore international markets
Canadian export pipeline infrastructure expansion is needed to increase market share in target U.S. markets, which are hungry for heavy oil feedstock like WCS.
U.S. refineries are growing increasingly reliant on Canadian crude oil, including heavy oil from the oil sands. The total percentage of heavy oil that the U.S. imports from Canada as a share of all imports of Canadian oil has increased from 25.1 per cent in 2000 to 55.8 per cent in 2019 (see Figure 4).
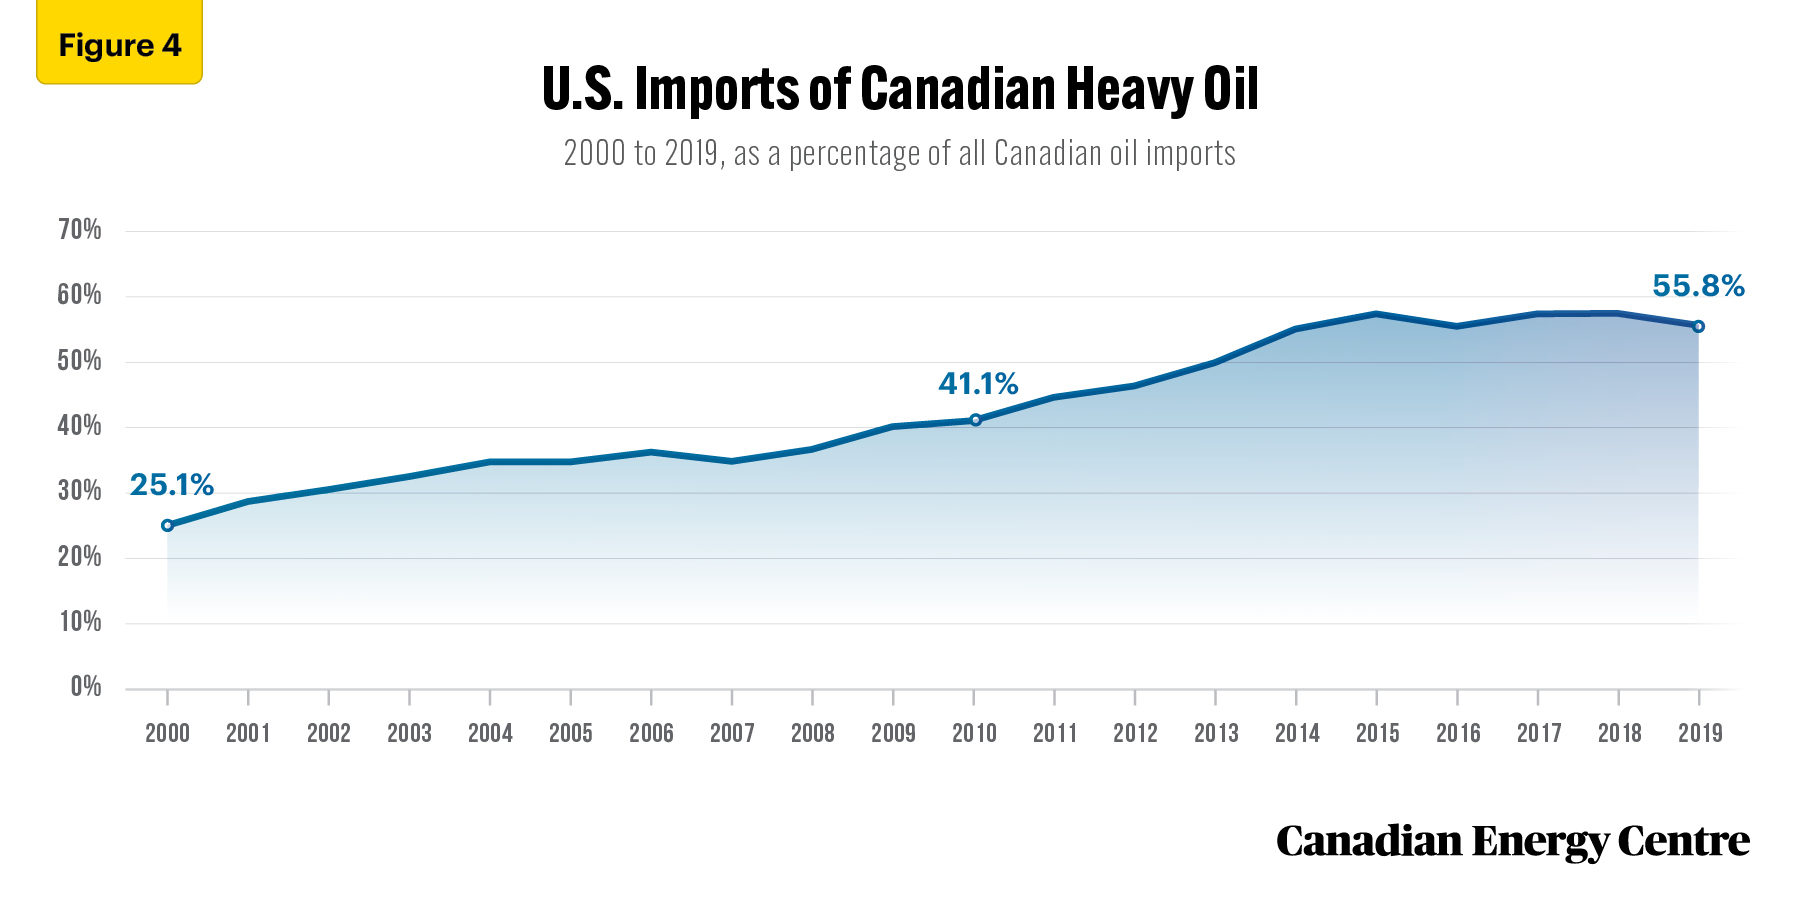
Source: U.S. Energy Information Administration, 2021a
New export pipelines mean higher prices for Canadian oil on world markets
There is a price discount between the U.S. benchmark West Texas Intermediate (WTI) crude oil price and the Canadian benchmark Western Canada Select (WCS). This differential reflects the heavier quality of WCS relative to WTI and the additional costs associated with transportation of WCS oil to U.S. refining hubs in the Gulf Coast. Wider discounts occur when Canada is not able to get its oil to United States and Asian markets because of pipeline constraints.
New export pipeline capacity will reduce oil price discounts, diversify markets and see refiners compete for supply.
Additional export pipeline capacity would allow oil producers to receive up to US$7.00 per barrel more for their product. This could lift capital investment by an estimated $10 billion and impact real GDP by an estimated 1.5 per cent to 2 per cent. Higher production and prices would boost provincial royalties by up to $10.5 billion over six years (Government of Alberta, 2018).
Achieving world market access through new export pipelines has positive impacts on the Canadian economy
With market access achieved through the building and completion of export pipelines, new oil production will be able to be transported to export markets in the United States and emerging and developing economies, resulting in more jobs, higher labour incomes, and more royalties and income taxes for the federal government and the provinces.
In 2019, the Government of Alberta estimated that with market access achieved through the completion of Keystone XL, Line 3 and TMX, Canadian GDP would increase by about $19 billion annually, employment would be 50,000 jobs higher, and Canadian producers and governments would achieve $43 billion in increased income due to increased production and investment over five years (Government of Alberta 2019).
According to the Conference Board of Canada, the TMX project’s construction and first 20 years of operation would boost the Canadian economy by $160 billion and result in over $46 billion to government revenues. This includes $19.4 billion in Alberta, $5.7 billion in British Columbia and $21.6 billion shared by the rest of Canada (Conference Board of Canada, 2016).
Construction and completion of Keystone XL would have seen nearly 15,000 jobs created in Canada and the U.S., including jobs in associated trades, retail, and hospitality services. Keystone XL would have contributed approximately $2.4 billion to Canada’s GDP, and generated $30 billion in tax and royalty revenues for governments (Government of Alberta, 2021b).
The Canadian Association of Petroleum Producers (CAPP) estimated that over the first 20 years of construction and operation, the Energy East Pipeline would have generated over 14,000 jobs, $55 billion to Canada’s GDP, and $10 billion in federal and provincial taxes (Canadian Association of Petroleum Producers, 2016).
Northern Gateway was estimated to increase Canadian GDP by more than $300 billion over 30 years, increase government tax and royalty revenues by over $80 billion, with an estimated 5,500 on-site jobs during the construction phase, and about 1,150 long-term jobs during operations (Our Great Minds, 2014).
Conclusion
Recognized as a responsible and secure energy provider on the world stage, Canada is in a good position to benefit from the increased global demand for oil in the post-COVID-19 recovery.
While all oil is not of the same quality, Canada has an opportunity to reduce heavy oil differentials and make its oil more profitable by moving forward expeditiously with new pipeline projects such as TMX, Keystone XL, Northern Gateway and Energy East.
Appendix: Explaining the WCS-WTI Differential and its Impact on the Canadian Economy
WCS-WTI differential
There is a natural price discount between the U.S. benchmark West Texas Intermediate (WTI) crude oil price and the Canadian benchmark Western Canada Select (WCS) price. This differential reflects the heavier quality of WCS relative to WTI and the additional costs associated with transportation of this oil to U.S. refining hubs in the Gulf Coast. But even wider discounts occur when Canada is not able to get its oil to markets in the United States and the Asia-Pacific because of pipeline constraints.
The lack of pipeline capacity has meant and means a higher price differential between U.S. and world oil (West Texas Intermediate and Brent) and Canadian oil (Western Canadian Select). Without new pipelines, Canadian oil must be shipped by other methods such as rail, which means higher shipping costs and thus lower returns for producers. Without sufficient pipeline access, producers incur higher transportation costs shipping their crude by rail – about US$5.00 to $10.00 per barrel higher than pipelines. Without new pipelines to the west and east coasts for oil exports, Canada is still largely subject to one main export market, the United States.
Impact on the Canadian economy
This WTI-WCS price discount means that Canada is getting lower revenues per barrel for each barrel of heavy crude exported. The discount negatively impacts federal government corporate tax revenues, producers’ revenues, and provincial government royalty revenues.
The impact of the differential in oil prices between U.S. and world oil (West Texas Intermediate and Brent) and Canadian oil (Western Canadian Select) has been estimated by different organizations in recent years. The following have all accounted for quality differences in the oil (light versus heavy, for example) and other reasons a “natural” differential would exist, and then subsequently arrived at estimates of what pipeline constraints cost Canadian producers.
The Alberta Royalty Review Advisory Panel noted in its January 2016 report that discounts on Canadian oil prices due to constrained market access led to the loss of more than $6 billion in provincial royalties between 2010 and 2016. (Alberta Royalty Review Advisory Panel, 2016).
In February 2018, Scotiabank estimated that large price discounts in the range of $25 to $30 per barrel could cost the Canadian economy roughly C$15.6 billion per year, or 0.75 per cent of GDP, and even at $18 per barrel annual losses associated with transporting marginal crude by rail rather than pipeline would be in the range of $7 billion or about 0.3 per cent of GDP (Scotiabank, 2018).
The Fraser Institute estimated from 2013 to 2017, after accounting for quality differences and transportation costs, the depressed price for Canadian heavy crude oil resulted in $20.7 billion in foregone revenues for the Canadian energy industry. This loss, associated with an average price differential of U.S.$16.60 per barrel, was equivalent to almost 1 per cent of Canada’s national GDP in 2017. In 2018, depressed prices for Canadian heavy crude oil resulted in $20.6 billion in foregone revenues alone for the Canadian energy industry. This loss associated with an average price differential of U.S. $26.50 per barrel, was approximately one per cent of Canada’s national GDP (Fraser Institute, 2019).
The Government of Alberta estimated that, without sufficient market access, the Canadian economy lost almost $19 billion in 2018 due to steep price discounts. If no additional pipelines come online, Canada stood to forgo more than $43 billion in lost income due to reduced production and investment between 2019 and 2023, or almost $9 billion per year. The lost income translates into the loss of about 35,000 jobs per year across Canada. Steep discounts for Canadian crude also mean that Canadian consumers lose out. When domestic oil is sold at steep discounts compared with foreign crudes, domestic producers take a hit through lower revenue. Meanwhile consumers, and refineries importing foreign crude, pay higher prices based on international crudes. Money flows out of the country and lowers income for the entire nation. (Government of Alberta, 2019).
In 2020, IHS Markit noted:
that pipeline export constraints have contributed to larger differentials, and lower returns for Canadian crude oil, than otherwise would have been expected. Although the impact on differentials has been sporadic, had there not been any transportation constraints over the past half decade (2015–19), IHS Markit estimates that western Canadian heavy crude oil would have obtained, on average, at least $3.00 per barrel more compared with WTI, Cushing. The impact of this lost value over millions of barrels produced each day during the last past half decade is significant—about $14 billion (U.S. dollars). Moreover, this estimate is likely conservative, since it is based on differentials only in excess of the uppermost bound of the anticipated range and only considers the impact on heavy, sour crude oil (IHS Markit, 2020).
According to the Government of Alberta, under a scenario of no additional pipeline access, foregone resource revenues are estimated to be $4.9 billion between 2021-22 and 2023-24 (Government of Alberta, 2021).
Notes
This CEC Fact Sheet was compiled by Lennie Kaplan at the Canadian Energy Centre (www.canadianenergycentre.ca). The author and the Canadian Energy Centre would like to thank and acknowledge Dennis Sundgaard and an anonymous reviewer in reviewing the original data and research for this Fact Sheet. Photo credits: Coastal GasLink
References (all links live as of February 14, 2022)
Alberta Royalty Review Advisory Panel Report. <https://bit.ly/3o5ihxQ>; Canadian Association of Petroleum Producers (2016). Energy East: Everything you need to know. <https://bit.ly/3uPxMy8>; Canada Energy Regulator. (2021). Canada’s Energy Future, 2021. <https://bit.ly/3o5Mn47>; Canada Energy Regulator. (2021). Crude Oil Annual Export Summary – 2020. <https://bit.ly/3KSiBJS>; Canadian Energy Research Institute. (2020). Market Access – Oil Export Pipelines in Western Canada, 2020. <https://bit.ly/3rRfnfg>; Conference Board of Canada. (2016). Who Benefits? A Summary of the Economic Impacts that Result from the Trans Mountain Expansion Project. <https://bit.ly/3cRoNCZ>; Fraser Institute (2019). The Cost of Pipeline Constraints in Canada. <https://bit.ly/3u6ODw2>; Government of Alberta. (2018). Budget 2018. <https://bit.ly/3sRIbFF>; Government of Alberta. (2019). Budget 2019. <https://bit.ly/3cSAyJs>; Government of Alberta. (2020). Budget 2020. <https://bit.ly/3fHb4Rd>; Government of Alberta. (2021a). Budget 2021. <https://bit.ly/3fIsVY3>; Government of Alberta. (2021b). Investing in Keystone XL pipeline. <https://bit.ly/3sSc0Wp>; International Energy Agency (IEA). (2021a). World Energy Outlook (WEO), 2021. <https://bit.ly/3IHIMkH>; International Energy Agency (IEA), 2021(b). 2021 WEO Extended Dataset. <https://bit.ly/3D0OdZv>; IHS Markit. (2020). What is different about differentials? Understanding the price of oil in Western Canada. <https://bit.ly/3miVWuC>; Oil Sands Magazine. (2020). Market Insights, Assessing America’s Appetite for Canada’s Crude: Canadian Crude Usage by U.S. Refineries. <http://bit.ly/3aSWAtl>; Our Great Minds. (2014). The Northern Gateway Pipeline: Transporting Energy in a Transformative Direction. <https://bit.ly/3HT9Opa>; Scotiabank. (2018) Pipeline Approval Delays: The Costs of Inaction. <https://bit.ly/3o3UCxC>; U.S. Energy Information Administration (2021a). Percentages of Total Imported Crude Oil by API Gravity. <https://bit.ly/3n9zSD4>.
Creative Commons Copyright
Research and data from the Canadian Energy Centre (CEC) is available for public usage under creative commons copyright terms with attribution to the CEC. Attribution and specific restrictions on usage including non-commercial use only and no changes to material should follow guidelines enunciated by Creative Commons here: Attribution-NonCommercial-NoDerivs CC BY-NC-ND.