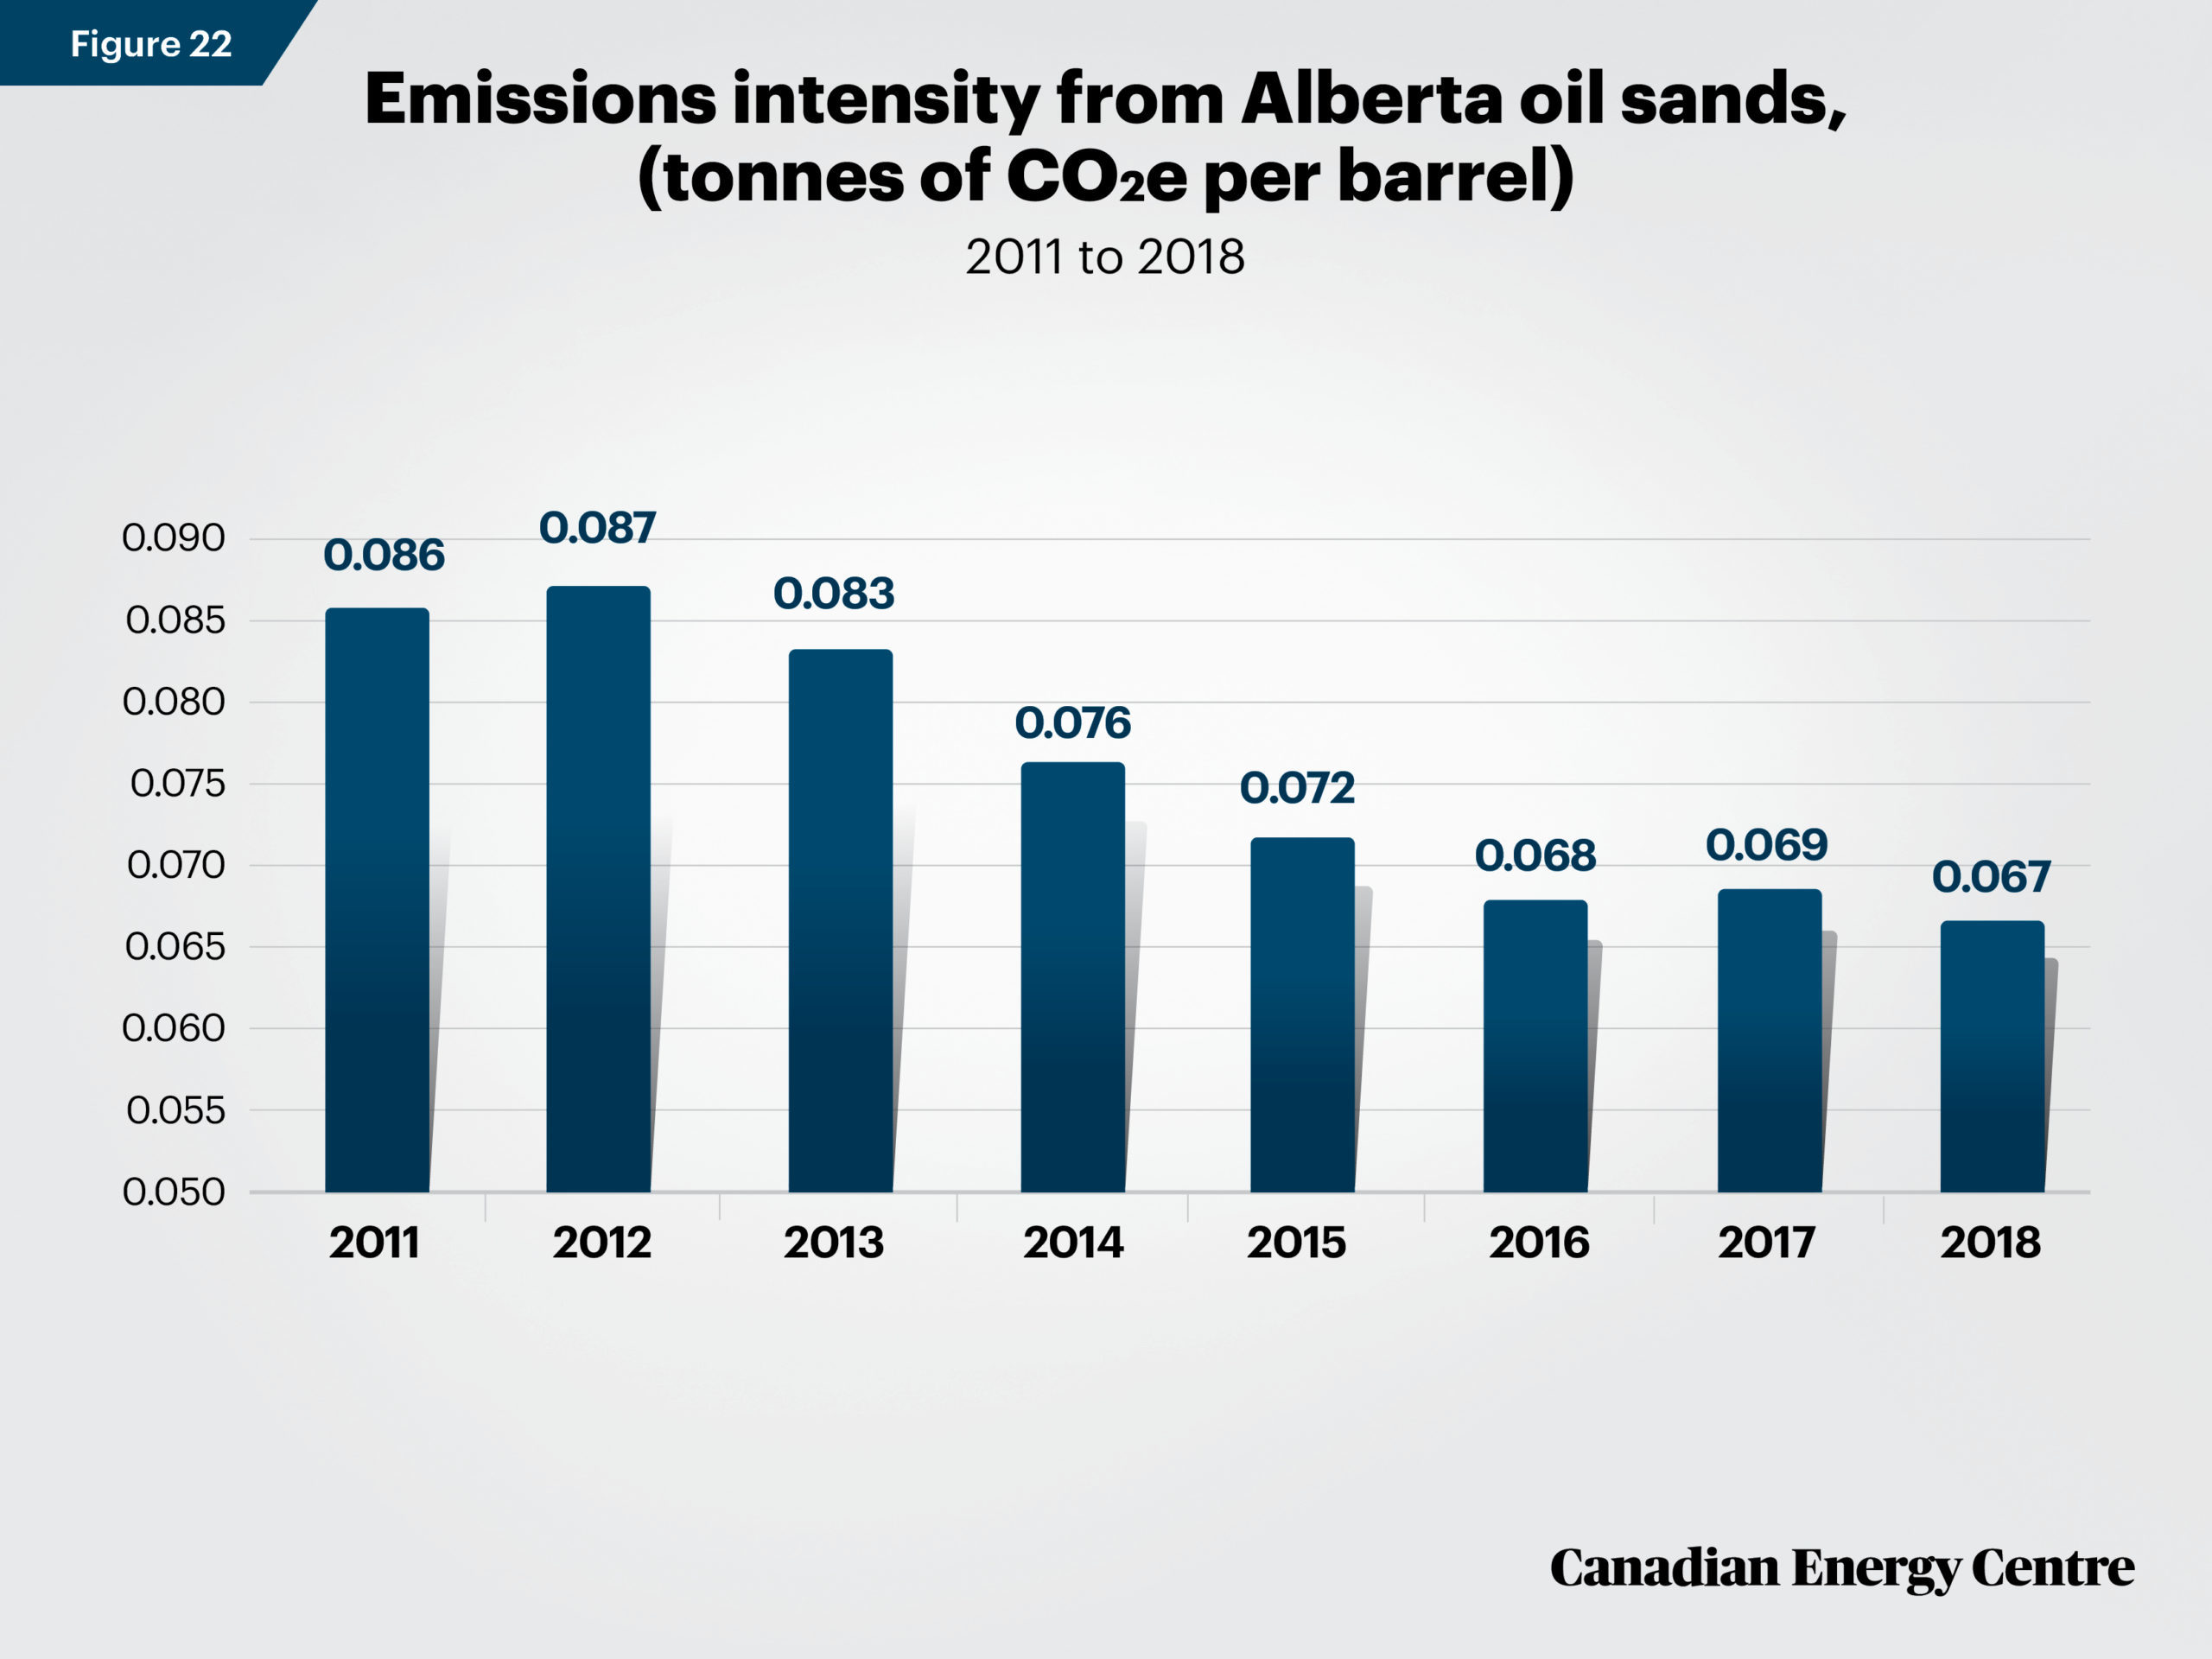
GRAPHIC: Oil sands emissions intensity 2011-2018 By CEC Staff on February 2, 2023, 11:56 am MST Social Related Stories Video | June 2, 2025 WATCH: LNG Shipping Times Video | June 2, 2025 WATCH: “We should be making it easier for all Canadians to share our oil and gas resources” Natural Gas and LNG | June 2, 2025 GRAPHIC: Arrival of first modules at Woodfibre LNG marks new milestone for Canadian LNG.
Video | June 2, 2025 WATCH: “We should be making it easier for all Canadians to share our oil and gas resources”
Natural Gas and LNG | June 2, 2025 GRAPHIC: Arrival of first modules at Woodfibre LNG marks new milestone for Canadian LNG.