
Social
To sign up to receive the latest Canadian Energy Centre research to your inbox email research@canadianenergycentre.ca
Overview
This Research Brief (which can be downloaded here as a pdf) estimates the gross revenue contribution that Canada’s energy sector, broadly speaking, and the oil and gas sector, specifically, made to federal, provincial, and municipal governments between 2000 and 2018. Gross revenues include personal and corporate federal and provincial income taxes, indirect taxes, royalties, and crown lease payments. This Research Brief updates previous research that the Canadian Energy Centre undertook on this subject.¹
In brief, on an inflation-adjusted basis,
- The energy sector’s cumulative fiscal contribution to federal, provincial, and municipal government revenue was nearly $672.1 billion between 2000 and 2018, an average of nearly $35.4 billion per year.
- The gross revenue contribution to federal, provincial, and municipal governments exclusively from the oil and gas sector is $493.3 billion between 2000 and 2018, an average of $26 billion per year.
Background
The broad energy sector in Canada is composed of oil and gas extraction and support activities, utilities (including renewables such as hydro, wind, and solar), petroleum and coal product manufacturing, and pipeline transportation. The oil and gas sector is composed of oil and gas extraction and related support activities.
This Research Brief also makes some broad comparisons between the gross revenue contributions of the energy sector and the oil and gas sector with two other sectors, namely, construction and real estate. The reader should be aware that:
- Numbers for the oil and gas sector are included in the broad energy sector.² The reason for displaying both is that separating out “oil and gas” from “energy” answers the question of how large Canada’s oil and gas sector is visà-vis the broad energy category (which also includes, for example, hydro).
- We do not compare the energy sector or the oil and gas sector to manufacturing.³ The reason for that is related to North American Industry Classification (NAICS) categories, where manufacturing includes some oil and gas (manufacturing) activity. (For example, petroleum refining is part of both the energy and the manufacturing sectors.) They are thus not distinct data sets that can be compared side by side, given the overlap.
- We also do not compare energy or oil and gas to the automotive sector or the aerospace sector. The reason is again related to (NAICS) classifications that make such comparisons difficult, as well as limitations with the data from Statistics Canada beyond personal income taxes.⁴
The revenue estimates for the energy sector and the oil and gas sector are low
The $672.1 billion figure from the broad energy sector and the $493.3 billion figure from the more specific oil and gas sector are conservative estimates of government gross revenues. (For more detail, see Appendix A: Explaining “Gross Revenues.”) They exclude:
- Federal and provincial personal income taxes or direct taxes from persons paid by employees who worked in Canada’s energy sector between 2000 and 2006, as the data is unavailable;
- Income effects resulting from spending on goods and services by Canadians who benefitted from the energy
sector;⁵ and - Taxes, fees, and revenues from benefit agreements paid to First Nations governments.
Summary of key findings
Revenues to governments from the broad energy sector: $672 billion
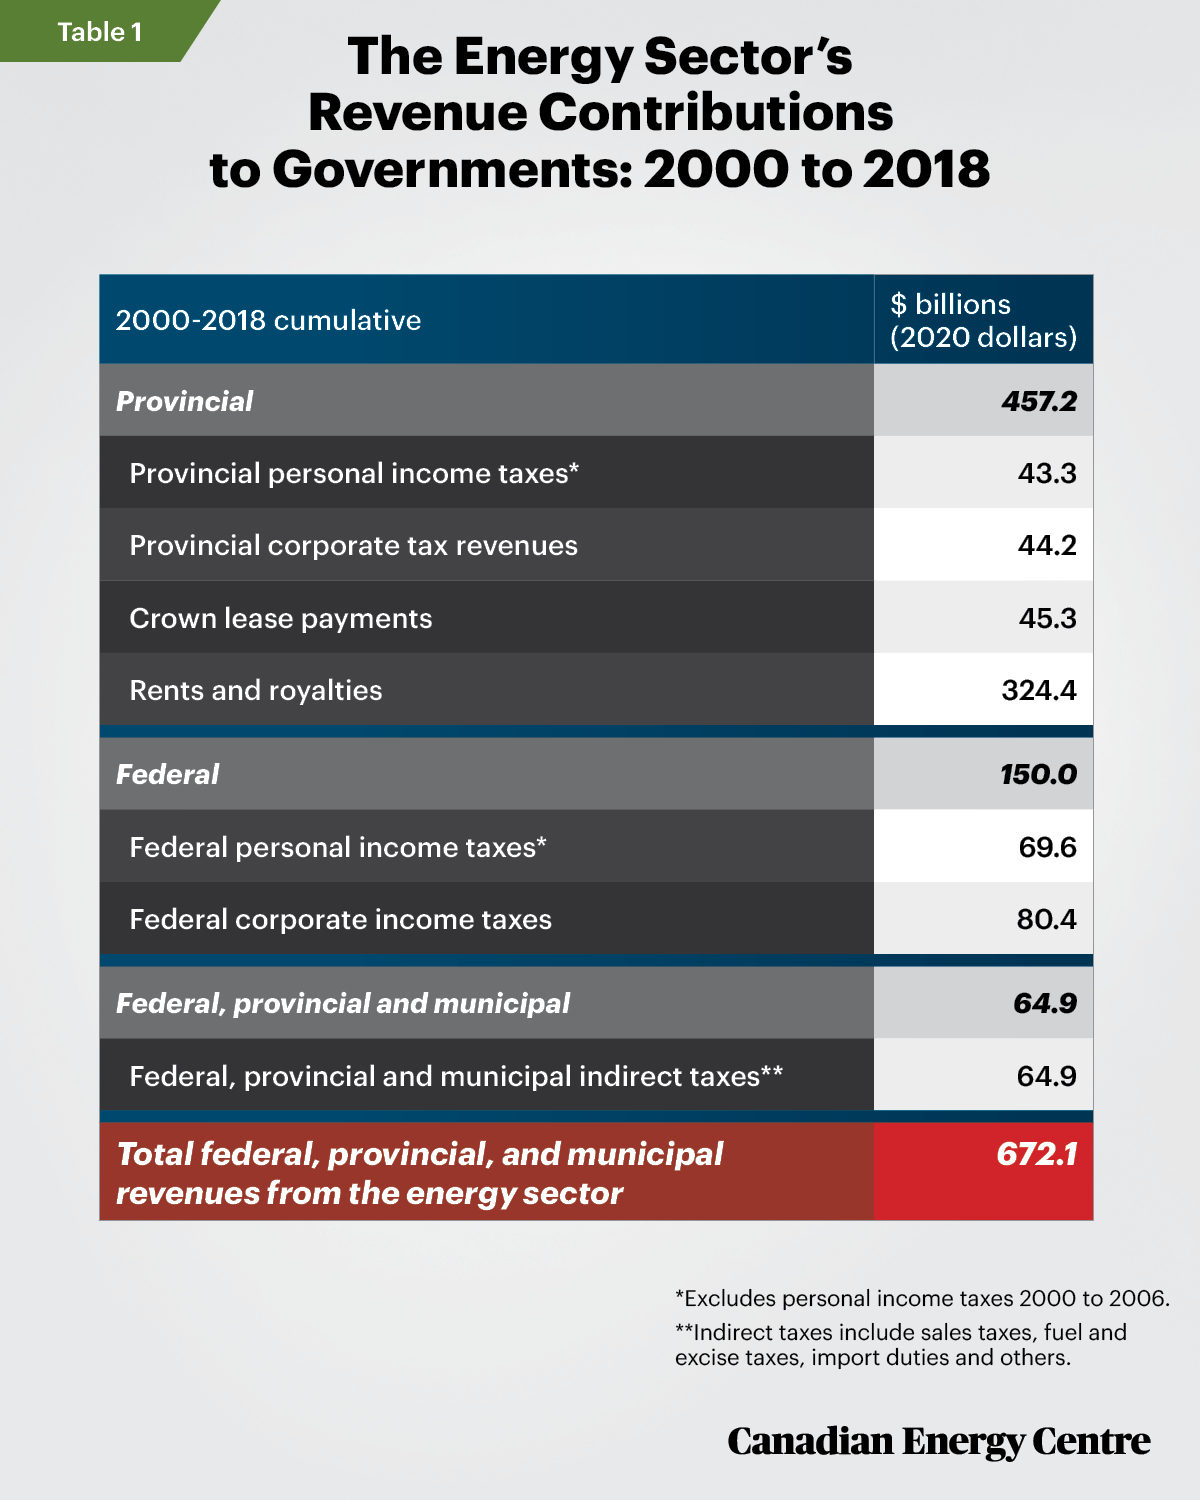
On an inflation-adjusted basis to 2020 dollars, the Canadian energy sector’s cumulative fiscal contribution to federal, provincial, and municipal government revenue was nearly $672.1 billion between 2000 and 2018, an average of $35.4 billion per year.⁶
The $672.1 billion figure includes $457.2 billion in direct provincial revenues, $150 billion in direct federal revenues, and $64.9 billion in indirect federal, provincial, and municipal taxes (see Table 1).
Sources: Statistics Canada 2020 (a, b, d, e, f, g) and CAPP 2020.
The contribution from the oil and gas sector alone: $493 billion
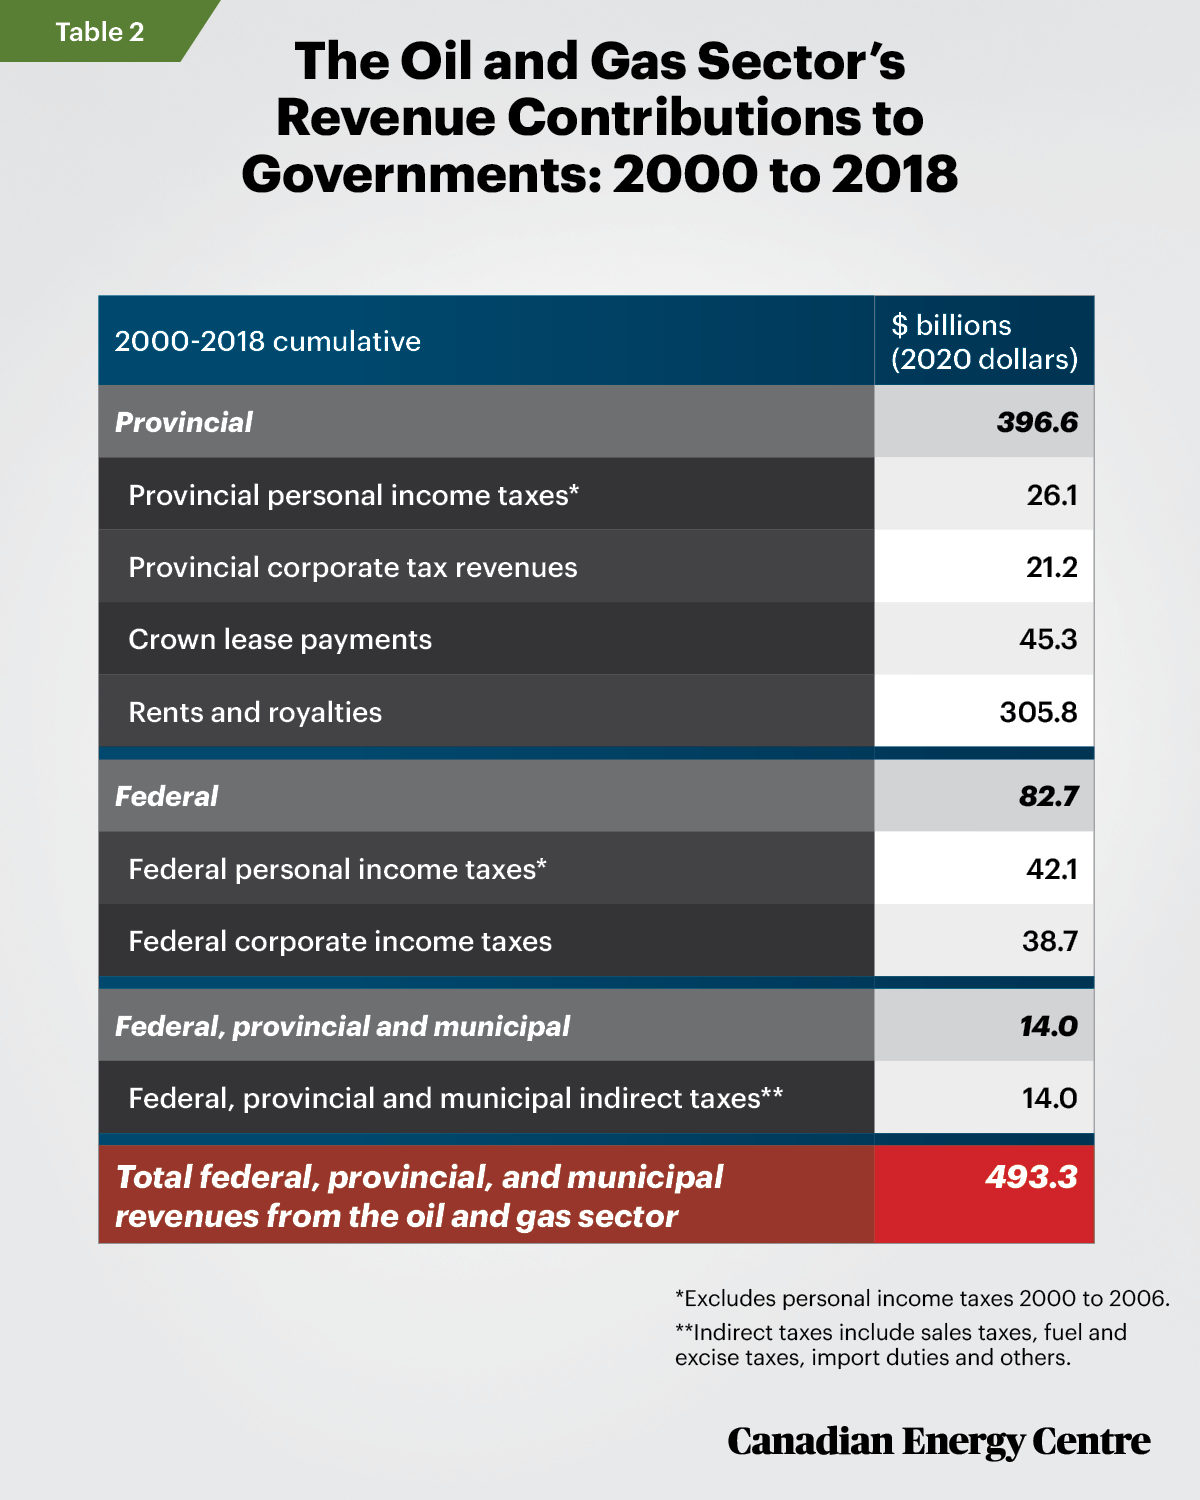
The gross revenue contribution to federal, provincial, and municipal governments exclusively from the oil and gas sector was $493.3 billion between 2000 and 2018, an average of $26 billion per year.
The $493.3 billion figure includes $396.6 billion in direct provincial revenues, $82.7 billion in direct federal revenues, and $14.0 billion in indirect federal, provincial, and municipal taxes (see Table 2).
Sources: Statistics Canada 2020 (a, b, d, e, f, g) and CAPP 2020.
Placing $672 billion and $493 billion in context
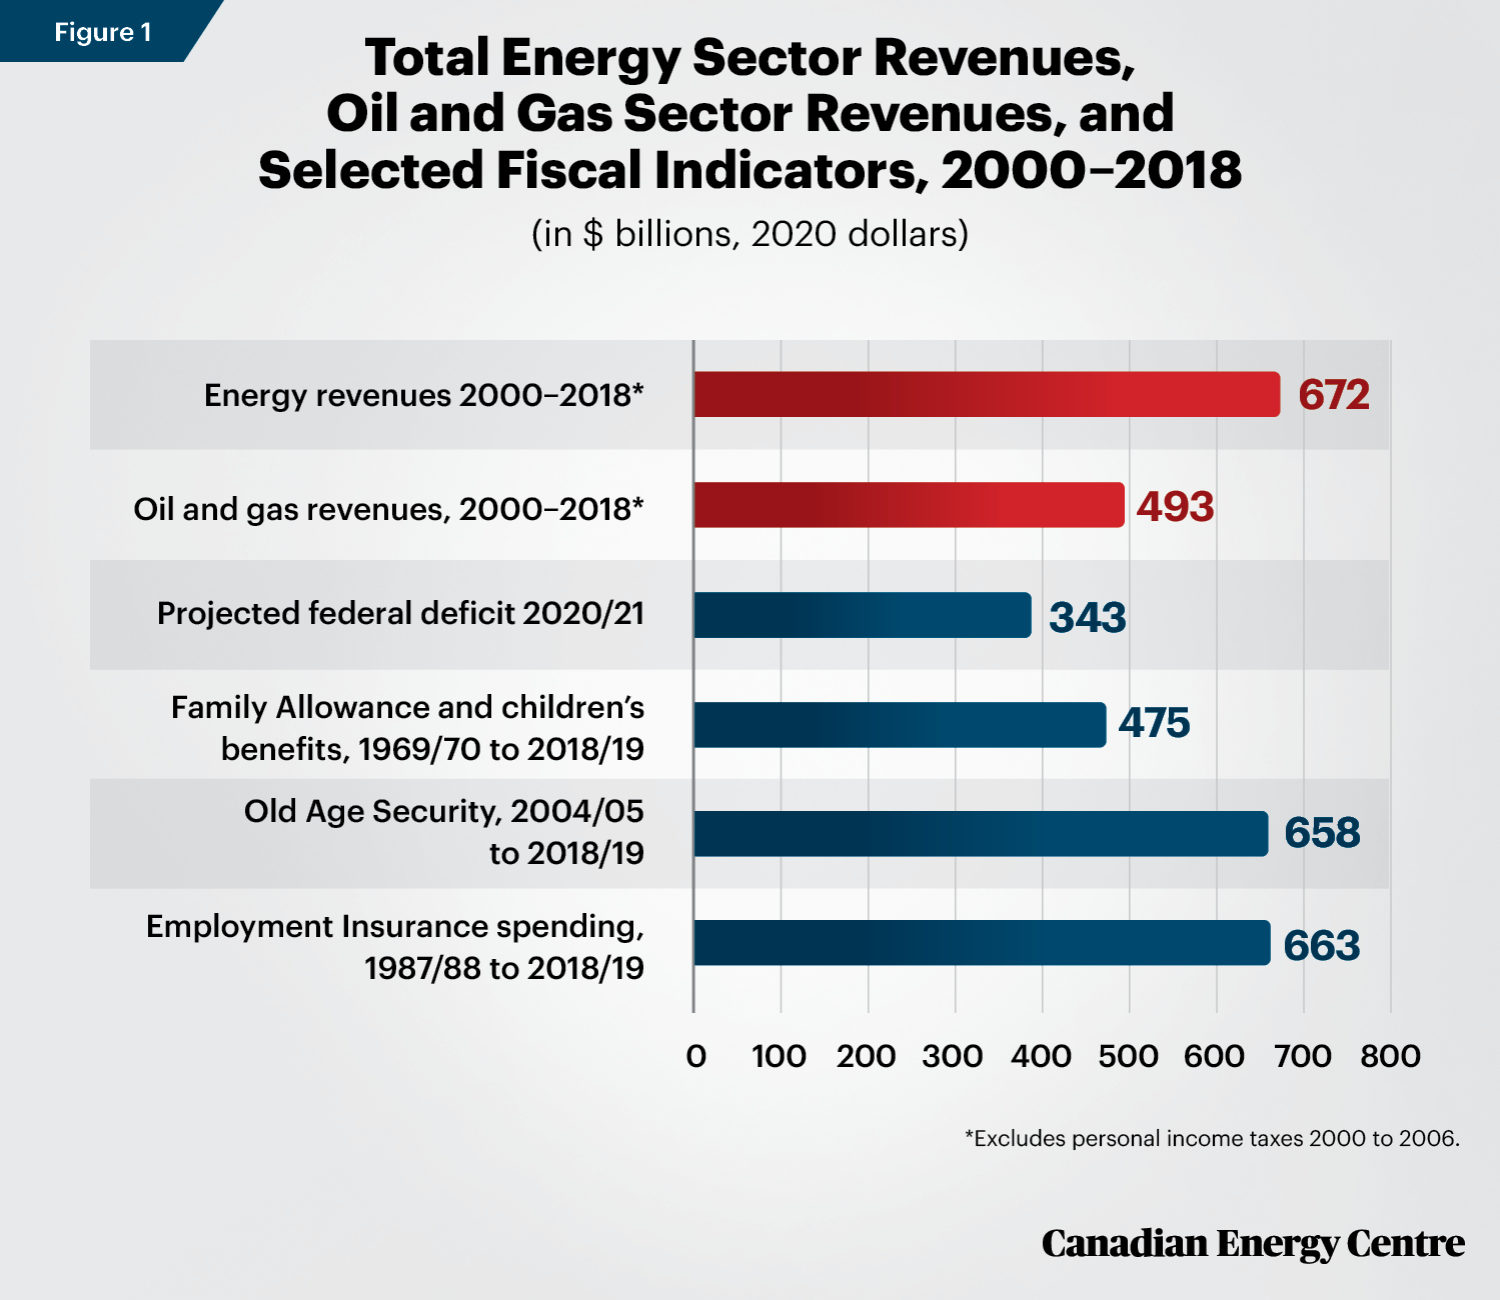
To put the $672.1 billion in energy revenues (or the $493.3 billion in oil and gas revenues) into context, we compare those figures with recent expenditures or other recent figures, all adjusted for inflation.
The $672 billion in energy revenue is:
- About twice the latest forecast of the federal budget deficit of $343 billion for 2020/21;
- More than the $658 billion paid out in old age security (OAS) benefits between 2004/05 and 2018/19; and
- More than the $663 billion in Employment Insurance benefits paid out between 1987/88 and 2018/19.
The $493 billion in oil and gas revenue is:
- More than the $475 billion in Family Allowance and children’s benefits paid out between 1969/70 and 2018/19 (see Figure 1).
Sources: Statistics Canada, 2020 (a, b, c, d, e, f, g); CAPP, 2020.
A breakdown of revenues from the energy sector
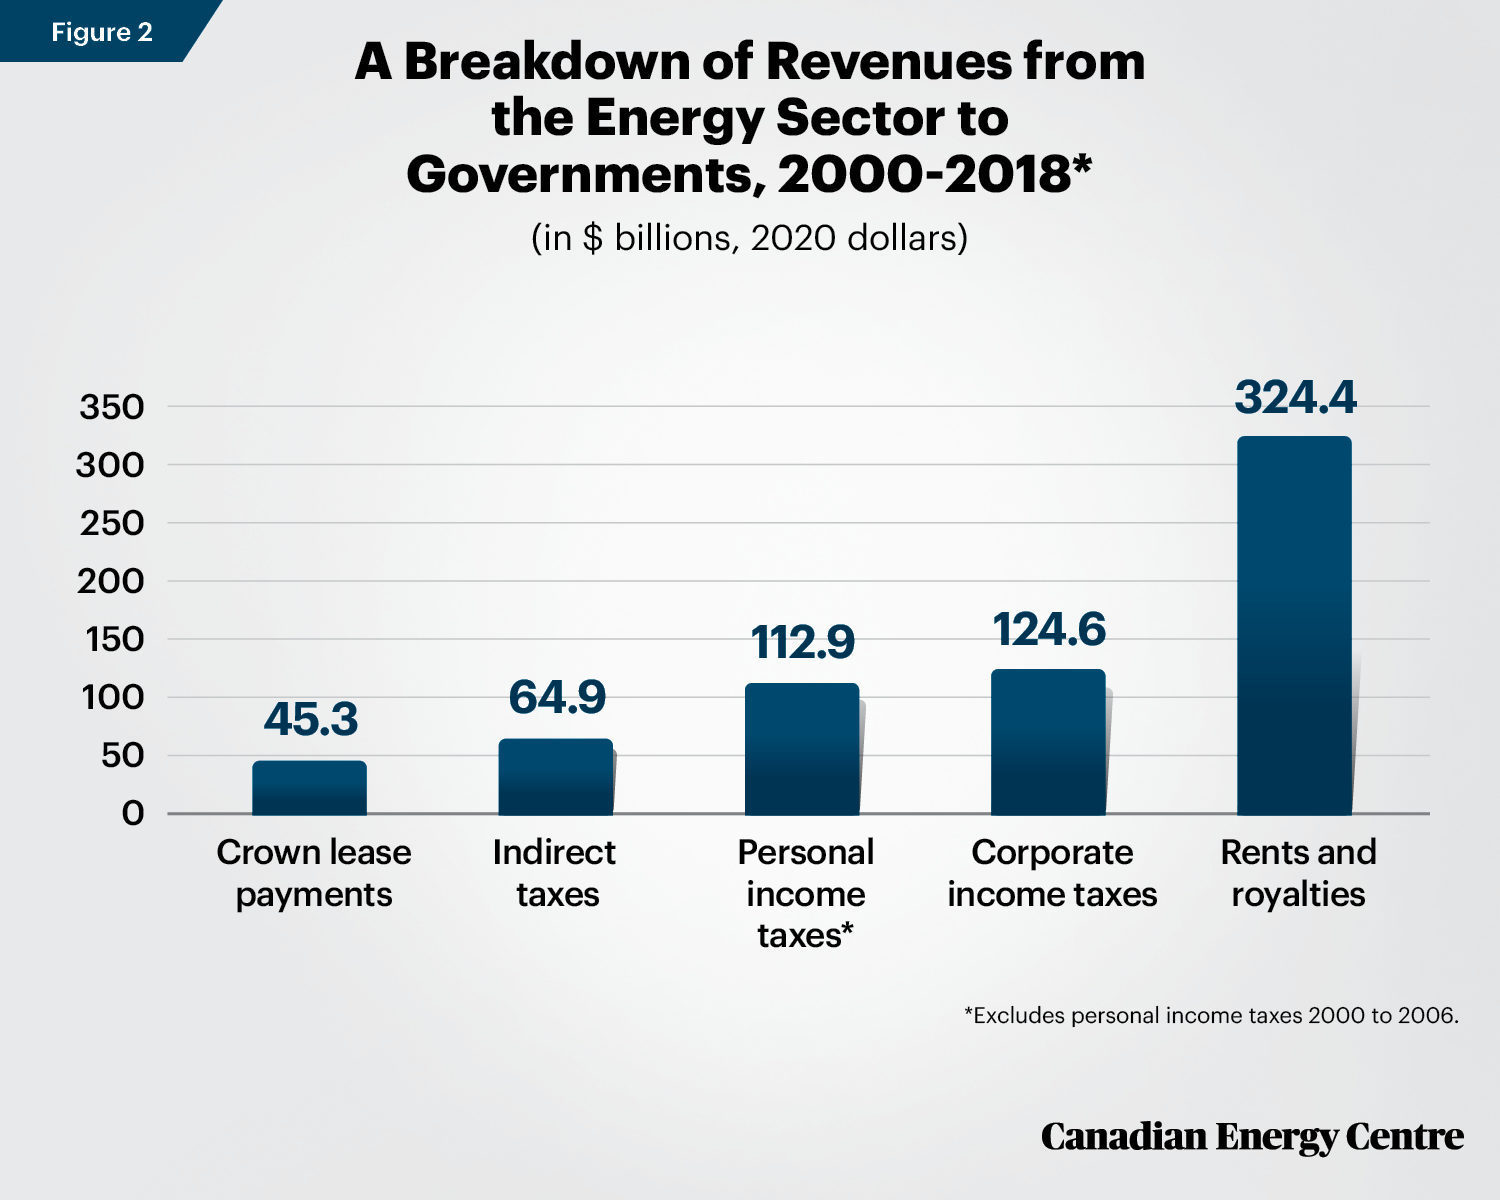
The energy sector pays revenues into government in five main ways: crown lease payments, indirect taxes, personal income taxes, corporate income taxes, and rents and royalties (see Figure 2).
Crown lease payments: $45 billion
The Canadian energy sector makes crown leases payments for the leasing of rights that enable companies to explore for and develop petroleum and natural gas resources.
Between 2000 and 2018, the Canadian energy sector made over $45.3 billion in crown lease payments to provincial governments, an average of $2.4 billion per year.
Indirect taxes: $65 billion
The Canadian energy sector pays indirect taxes annually as a result of its activities. Those indirect taxes include federal and provincial sales taxes, federal and provincial gas taxes, federal excise taxes, federal import duties, and others.
Between 2000 and 2018, Canada’s energy sector paid $64.9 billion, an average of $3.4 billion per year in indirect taxes to the federal government, the provinces, and municipalities.
Personal income taxes: $113 billion
Canadians employed in the energy sector pay federal and provincial income taxes, primarily on annual income earned from salaries, wages, and commissions. (For more information, see Appendix B: Personal Income Tax Revenue Comparisons.)
Between 2007 and 2018, Canadians employed in the energy sector paid $112.9 billion in federal and provincial personal income taxes on salaries, wages, and commissions – about $9.4 billion per year. Note that this does not include federal and provincial personal income taxes collected from the energy sector between 2000 and 2006, which are not available from Statistics Canada at this time.
Of that $112.9 billion, federal personal income tax revenues were $69.6 billion and provincial personal income tax revenues were $43.3 billion.
Corporate income taxes: $125 billion
Corporations and business enterprises in Canada’s energy sector pay federal and provincial corporate taxes on their annual net profits. (For more information, see Appendix C: Corporate Income Tax Revenue Comparisons.)
Between 2000 and 2018, the energy sector paid $124.6 billion, or $6.6 billion per year in federal and provincial corporate income taxes.
Of that $124.6 billion, Canada’s energy sector paid $80.4 billion in federal corporate income taxes and over $44.2 billion in provincial corporate income taxes.
Rents and royalties: $324 billion
The Canadian energy sector pays rents and royalties to provincial governments on the production of natural resources such as conventional oil and natural gas, oil sands, and hydro.
Between 2000 and 2018, the energy sector paid $324.4 billion, or an average of $17.1 billion per year in rents and royalties to provincial governments.
Sources: Statistics Canada, 2020 a, b, d, e, f, g; and CAPP, 2020.
A breakdown of revenues from the oil and gas sector
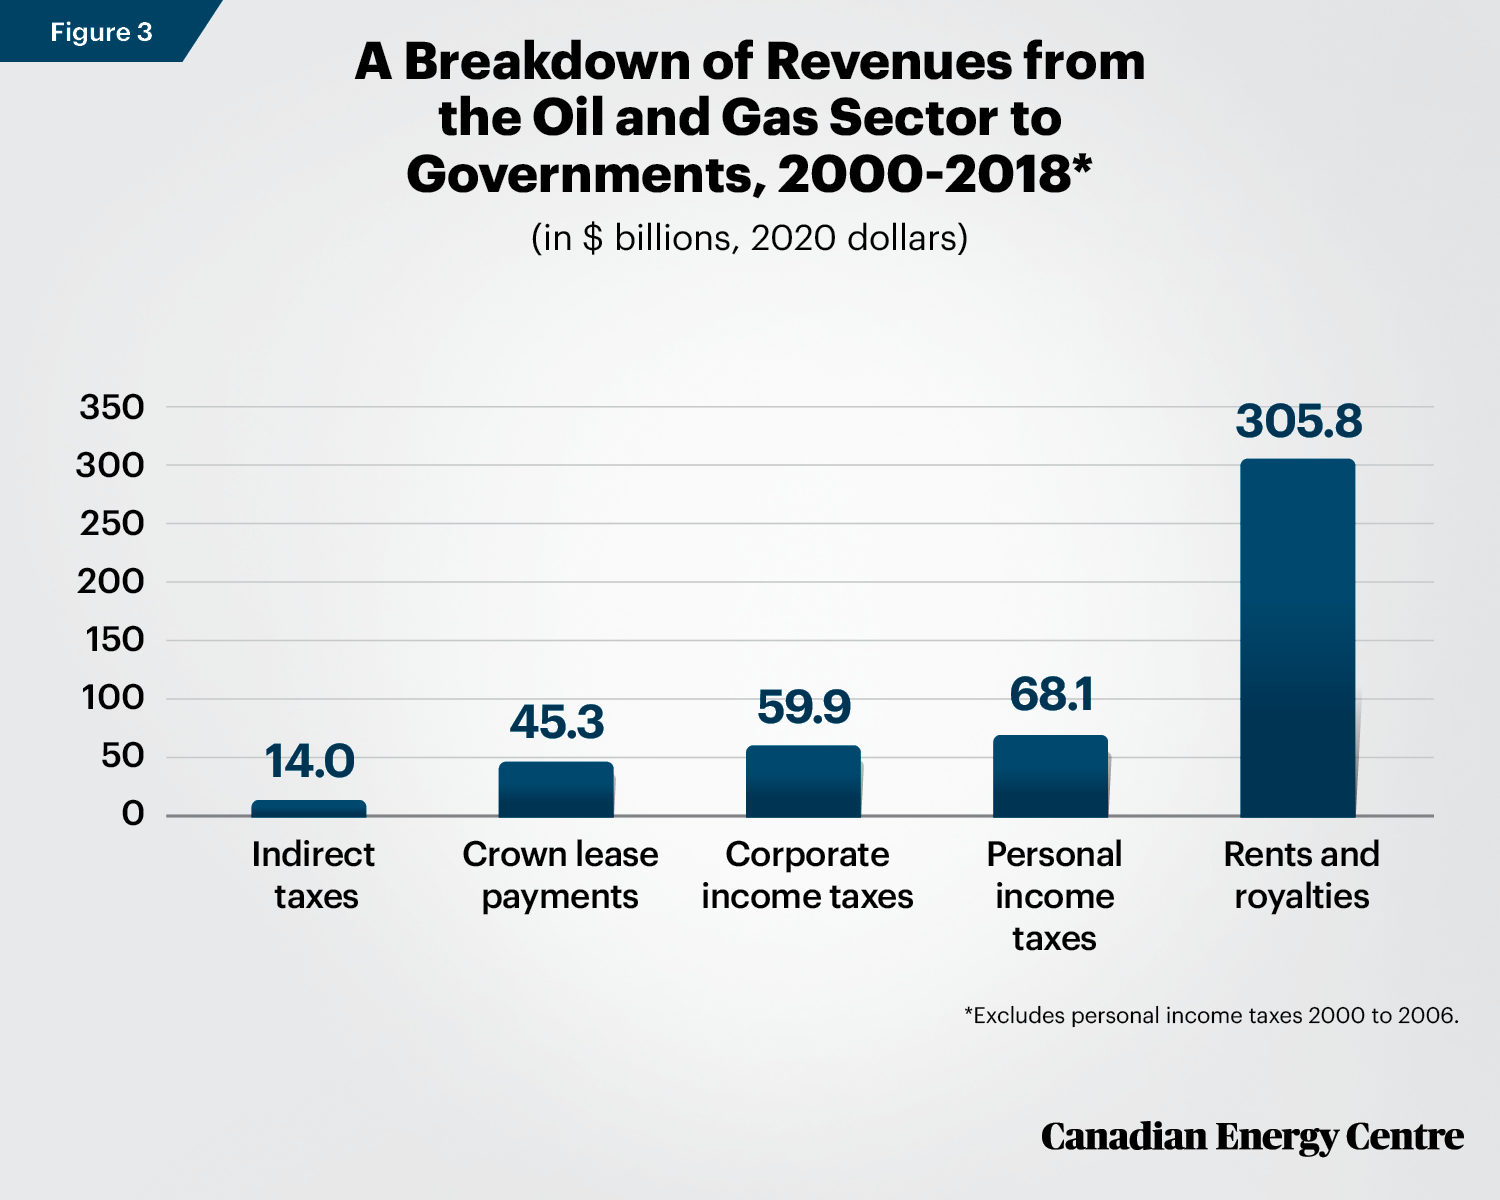
Just as the broad energy sector does, the oil and gas sector pays revenue into government in five main ways: indirect taxes, crown lease payments, personal incomes taxes, corporate income taxes, and rents and royalties (see Figure 3).
Indirect taxes: $14 billion
The Canadian oil and gas sector pays indirect taxes annually as a result of its activities. Those indirect taxes include federal and provincial sales taxes, federal and provincial gas taxes, federal excise taxes, federal import duties, and others.
Between 2000 and 2018, Canada’s energy sector paid nearly $14 billion, an average of over $730 million per year in indirect taxes to the federal government, the provinces, and municipalities.
Crown lease payments: $45 billion
The Canadian oil and gas sector is the sole contributor of the crown lease payments that accrue to governments. Between 2000 and 2018, the Canadian oil and gas sector made $45.3 billion, or an average of $2.4 billion per year, in crown lease payments to provincial governments.
Federal and provincial corporate incomes taxes: $60 billion
Between 2000 and 2018, the oil and gas sector paid federal and provincial corporate income taxes of over $59.9 billion, or $3.2 billion per year.
Of that $59.9 billion, $38.7 billion was paid in federal corporate income taxes and $21.2 billion in provincial corporate income taxes.
Federal and provincial personal income taxes: $68 billion
Between 2007 and 2018, Canadians employed in the oil and gas sector paid $68.1 billion, or $5.7 billion per year, in federal and provincial income taxes on salaries, wages, and commissions. Note that this figure does not include federal and provincial personal income tax collected from the sector between 2000 and 2006, as those data are not available from Statistics Canada at this time.
Of that $68.1 billion, federal personal income tax revenues were $42.1 billion and provincial personal income tax revenues were $26.1 billion.
Rents and royalties: $306 billion
Canada’s oil and gas sector pays rents and royalties to provincial governments on the production of natural resources such as conventional oil, natural gas, and oil sands.
Between 2000 and 2018, the oil and gas sector paid $305.8 billion, or an average of $16.1 billion per year, in rents and royalties to provincial governments.
Sources: Statistics Canada, 2020 a, b, d, e, f, g; CAPP, 2020.
Revenue comparisons with other key sectors
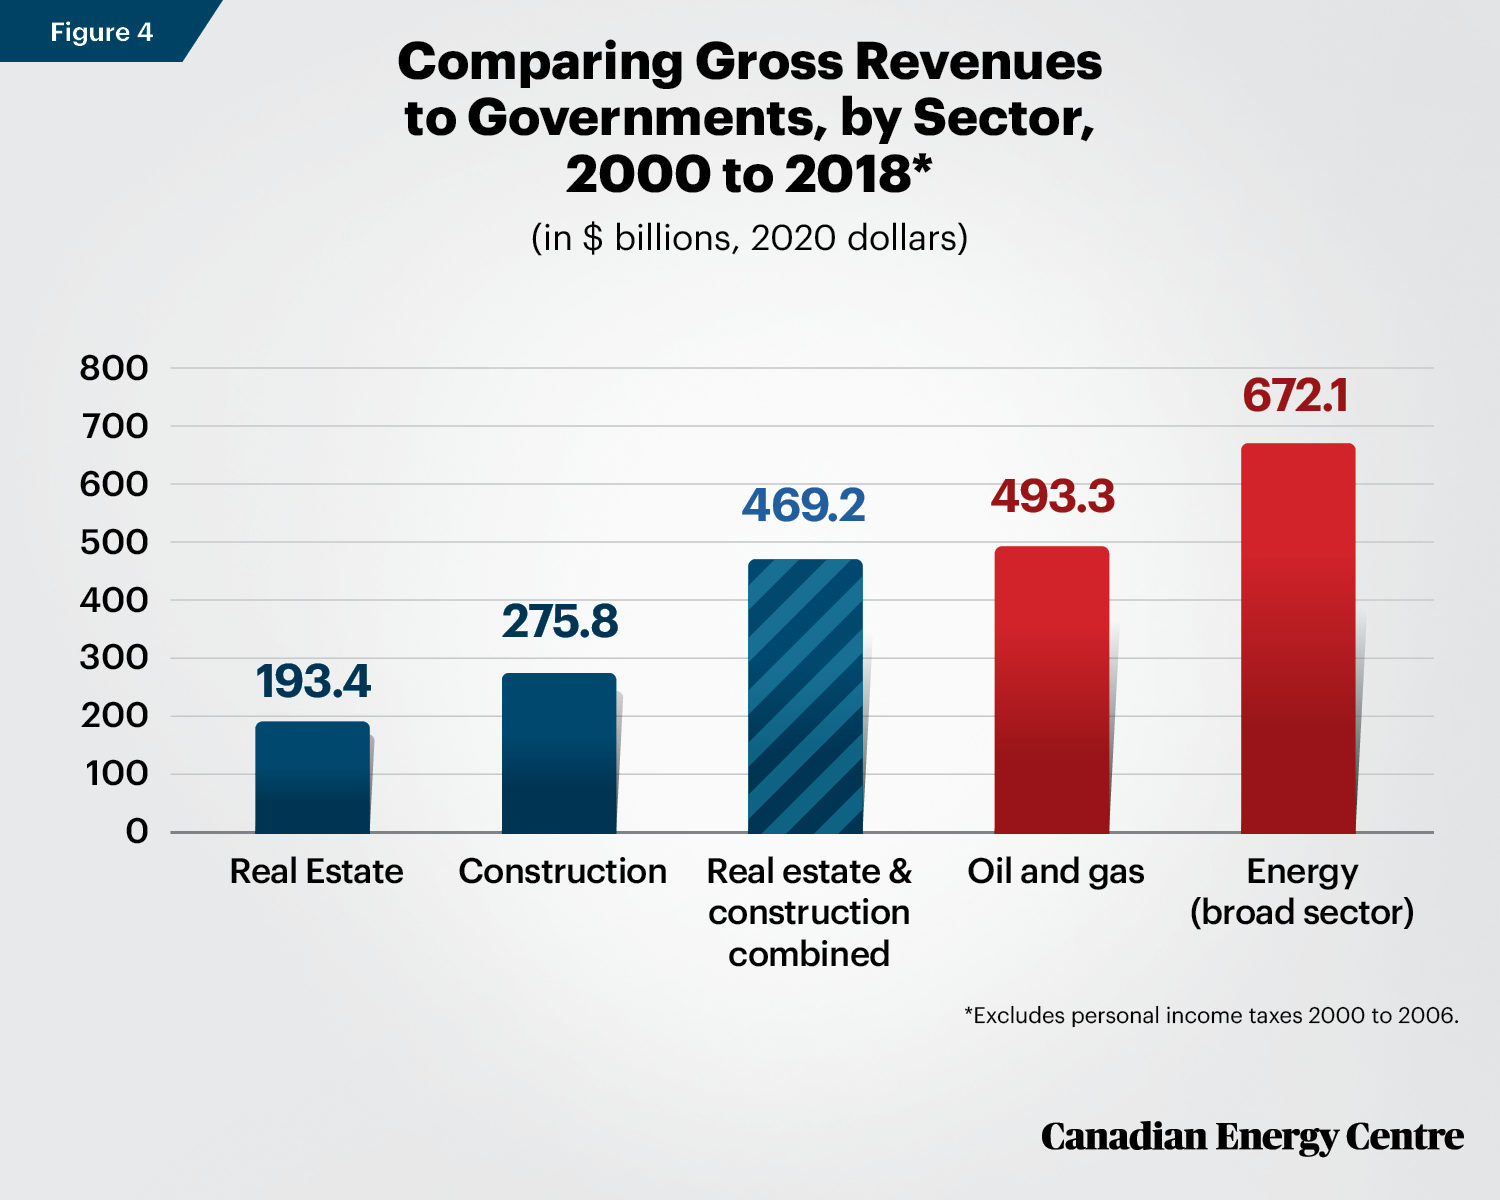
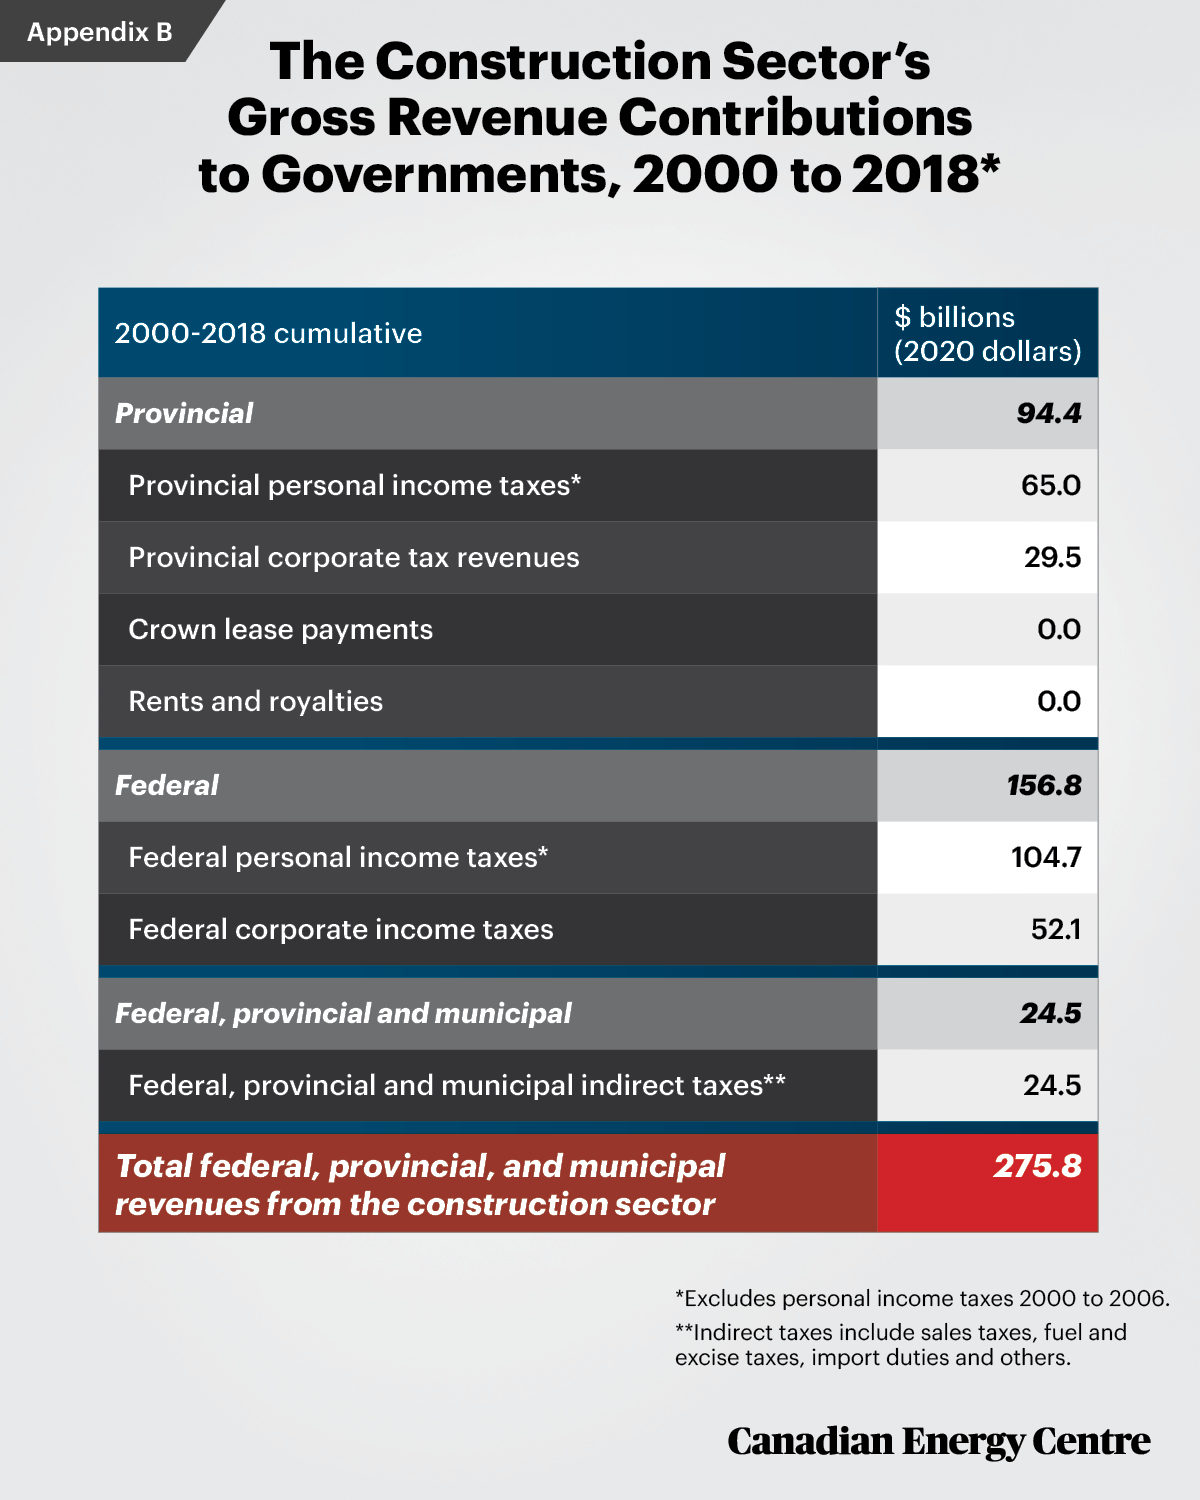
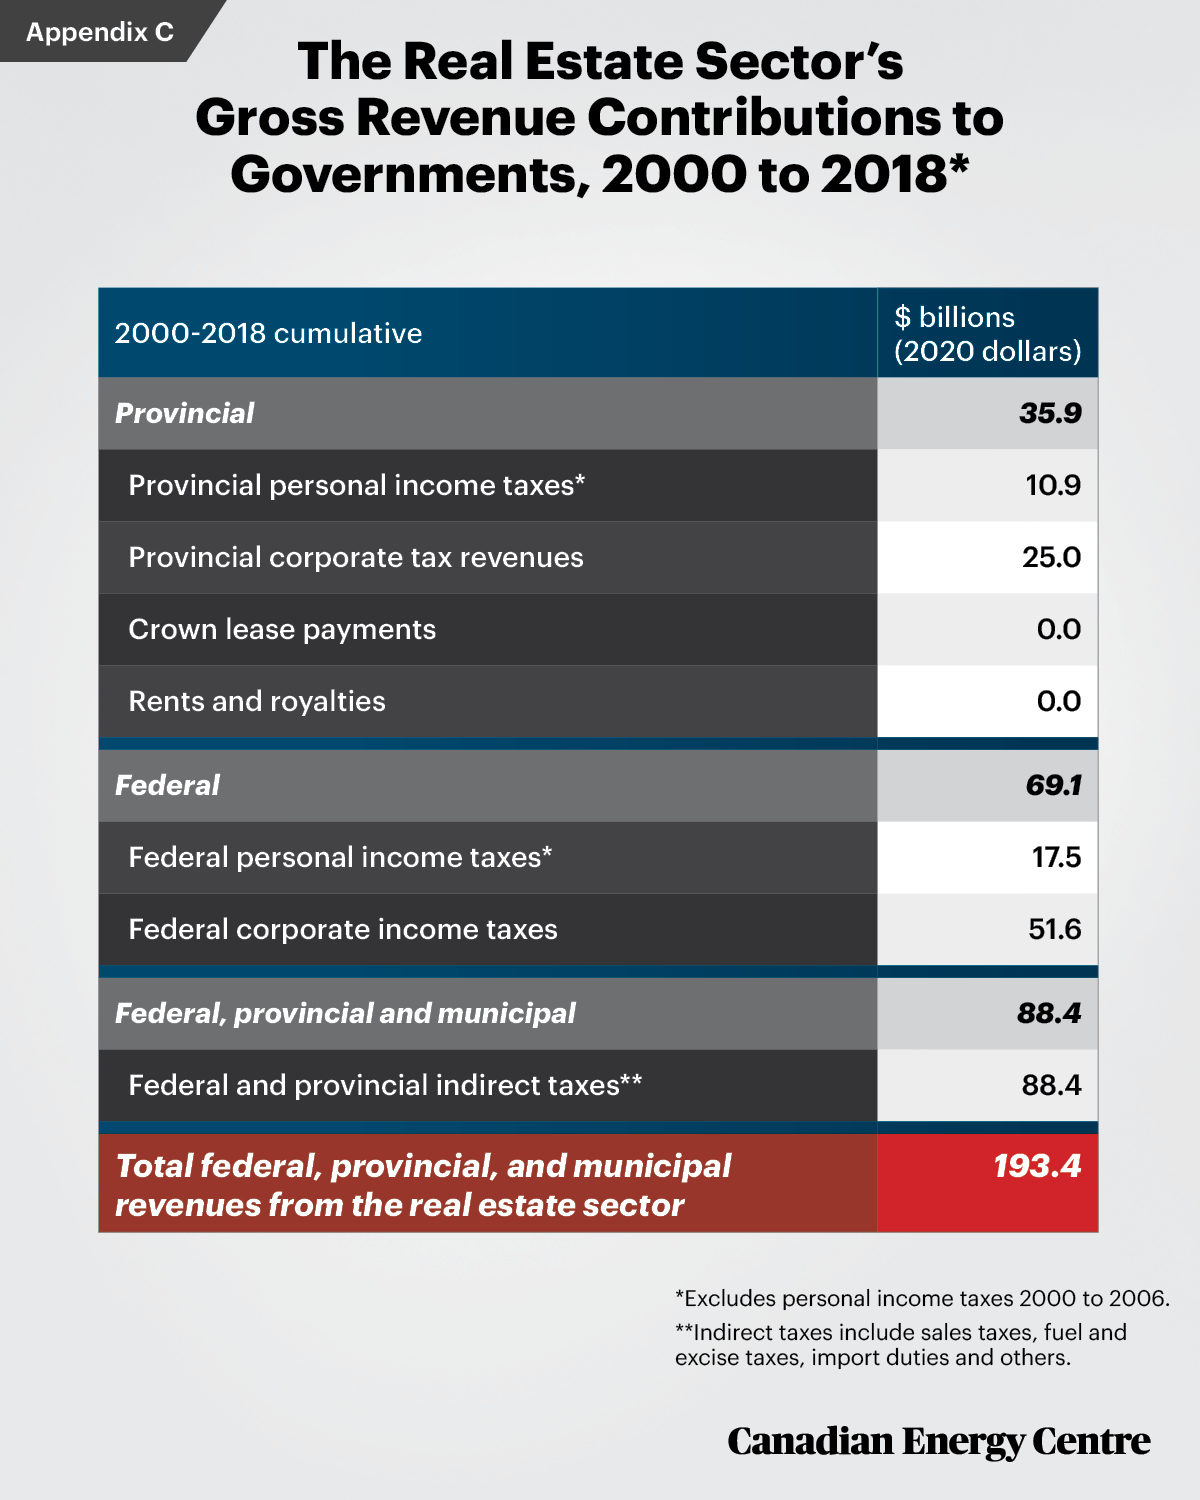
The gross revenue contributions of the oil and gas sector ($493.3 billion) and the broader energy sector ($672.1 billion) between 2000 and 2018 (see Figure 4) are significantly higher than other key sectors such as construction (see Appendix B: Construction Sector Gross Revenues) and real estate (see Appendix C: Real Estate Sector Gross Revenues).
Between 2000 and 2018, revenues from those sectors were as follows:
- Real estate: $193.4 billion;
- Construction: $275.8 billion;
- Oil and gas: $493.3 billion; and
- Energy (broad sector): $672.1 billion.
Of note, the combined revenues of the real estate and construction sectors ($469.2 billion) was still less than revenues from the oil and gas sector alone ($493.3 billion) — over $24 billion less — between 2000 and 2018 inclusive.
Sources: Statistics Canada, 2020 (a, b, d, e, f, g) and CAPP, 2020.
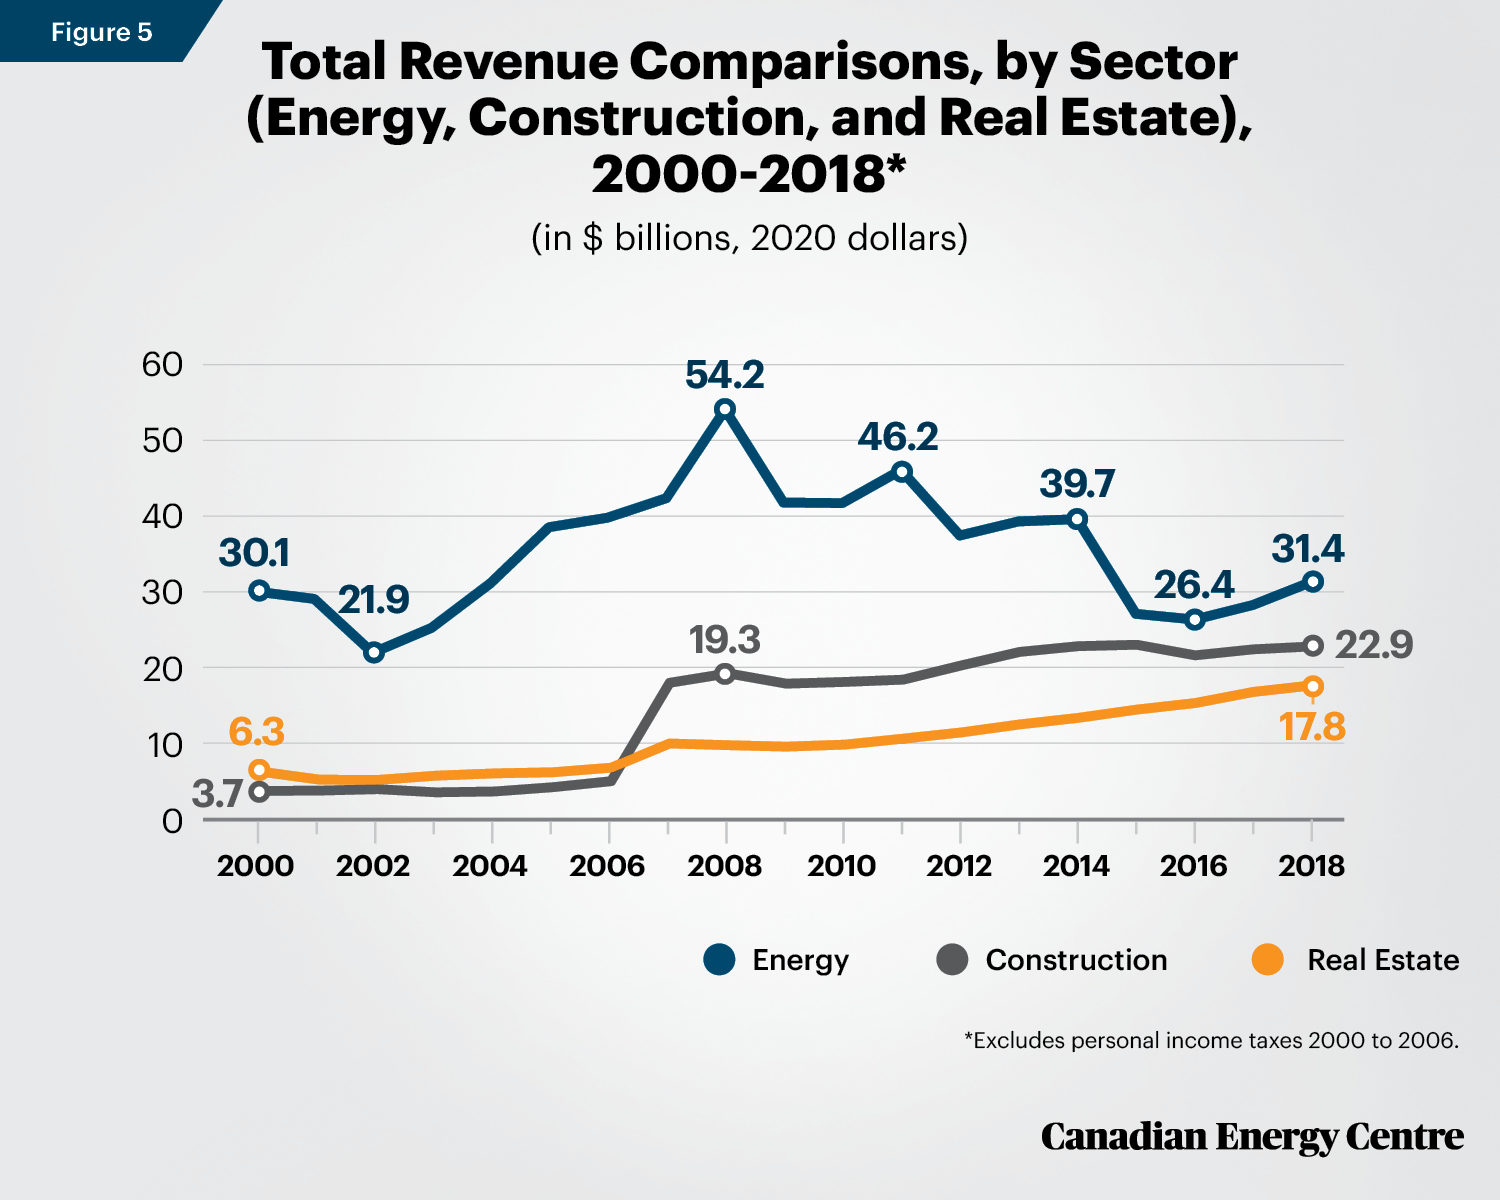
Tracking energy revenues over two decades
Figure 5 compares the revenues between 2000 and 2018 by sector: energy, construction and real estate. The broad, overall energy sector has been the biggest contributor to government revenues in every year, ranging from a low of $21.9 billion in 2002 to a high of $54.2 billion in 2008. In the most recent year of available data (2018), the energy sector contributed $31.4 billion to federal, provincial, and municipal governments.
Sources: Statistics Canada, 2020 (a, b, d, e, f, g) and CAPP, 2020.
Tracking oil and gas revenues over two decades
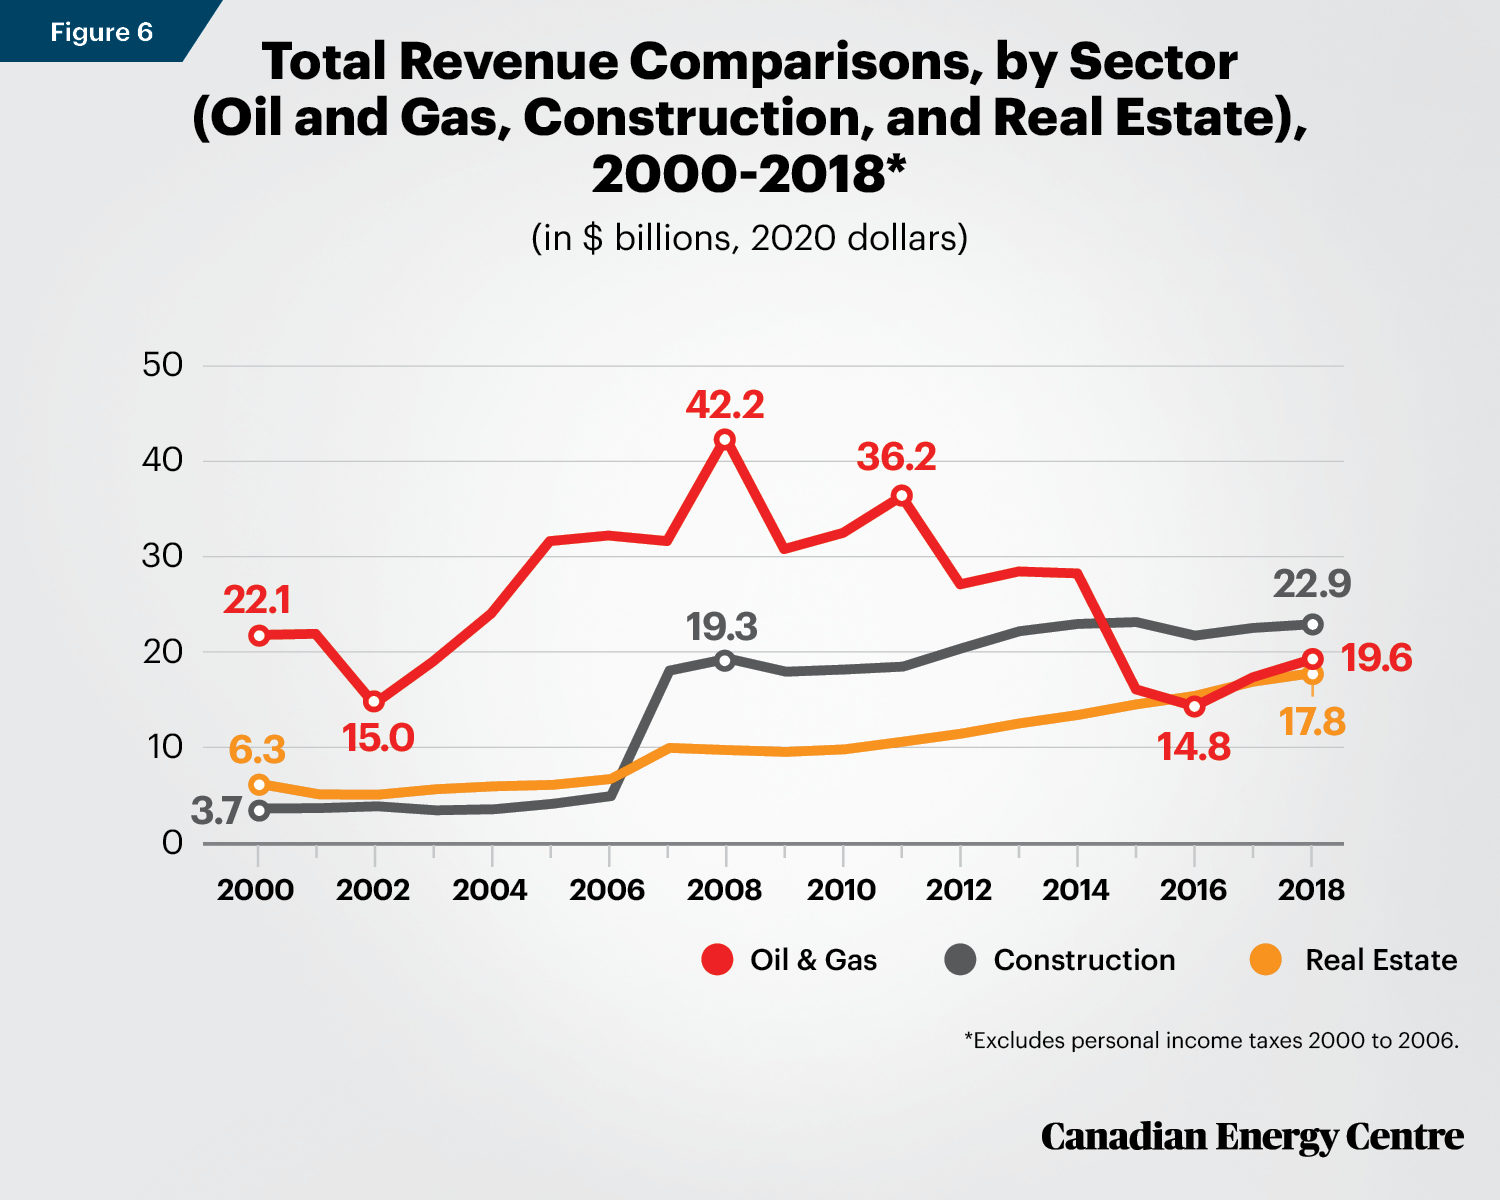
Figure 6 compares the revenues between 2000 and 2018 by sector, contrasting the narrower oil and gas sector (which is part of the broad energy sector) with the construction and real estate sectors.
Of the three industries, the oil and gas sector was the biggest contributor to federal, provincial, and municipal government revenues every year until 2015, supplying as much as $42.2 billion in 2008 with a low of $14.8 billion recorded in 2016.
Between 2015 and 2018, the construction sector contributed more revenue than did oil and gas in only those four years, with a range between $21.8 billion (2016) and $23.2 billion (2015); the other two years lay between those totals. The real estate sector contributed more than oil and gas in one year, in 2016, with $15.4 billion in revenues that year.
The contribution of the oil and gas sector in those four years ranged from a low of $14.8 billion in 2016 to a high of $19.6 billion in 2018.
Sources: Statistics Canada, 2020 (a, b, d, e, f, g) and CAPP, 2020.
Conclusion
The broad energy sector generally, and the oil and gas sector specifically, have made a significant contribution to federal, provincial, and municipal government coffers over the past two decades.
A conservative estimate of the gross revenues that Canada’s energy sector has paid to those three levels of government between 2000 and 2018 is $672.1 billion, an average of nearly $35.4 billion per year.
The gross revenues contributed by the oil and gas sector ($493.3 billion) between 2000 and 2018 are significantly higher than those from other key sectors such as construction and real estate.
Appendices
Appendix A:
Explaining “Gross Revenues”
Gross revenues from the broad energy sector and the narrower oil and gas sector are composed of direct and indirect taxes, royalties, and crown lease payments made annually to federal, provincial, and municipal governments.
They include:
- Federal and provincial personal income taxes or direct taxes from persons paid by employees who work within Canada’s oil and gas sector and the broader energy sector;
- Federal and provincial corporate income taxes or direct taxes from corporations paid by corporations and business enterprises in Canada’s oil and gas sector and the broader energy sector;
Federal, provincial, and municipal indirect taxes on production and products, such as GST, excise taxes, duties, import taxes, gasoline and motive fuel taxes, and others paid by Canada’s oil and gas sector and the broader energy sector;
- Rents and royalties on the production of conventional oil and gas, oil sands, and hydro paid by Canada’s oil and gas sector and broader energy sector; and
- Crown lease payments for the leasing of rights that enable companies to explore for and develop petroleum and natural gas resources.
Sources: Statistics Canada, 2020 (a, b, d, e, f, g) and CAPP, 2020.
Sources: Statistics Canada, 2020 (a, b, d, e, f, g) and CAPP, 2020.
End Notes
1. See CEC’s March 2020 Fact Sheet #1 where we conservatively estimated energy revenues to federal and provincial and municipal governments at $359 billion between 2000 and 2018 before inflation adjustments and absent data that is now included in this report.
2. In making these broad types of sectoral comparisons, Statistics Canada uses the North American Industry Classification (NAICS) system to establish the boundaries for various sectors. Under NAICS, sectors are broken down by two-number NAICS (i.e., 23 is construction), three-number NAICS (i.e., 531 is real estate), four-number NAICS (i.e., 3361 is motor vehicle manufacturing) and five-number NAICS (i.e., 33612 is heavy-duty truck manufacturing), and so forth.
3. Manufacturing has a broad NAICS (i.e., 31, 32, and 33), and there are close interactions between energy, oil and gas, and broad manufacturing, i.e., how, as noted, petroleum refining is part of both the energy and manufacturing sectors.
4. In technical terms, since the broad energy sector and oil and gas sector are composed of two- and three-number NAICS, we limit our comparisons, as much as possible, to other two- and three-number NAICS, such as construction (23) and real estate (531).
5. By “income effects,” we mean income generated by the broad energy industry and its agents or suppliers, which gives rise to various types of personal consumer spending across the entire economy. Such consumer spending stimulates GDP, output, and employment in other sectors such as retail, service, and leisure, which then bolsters federal, provincial, and municipal revenues.
6. The nominal figure is $562.4 billion. Constant dollars (i.e., inflation-adjusted to 2020) is a more accurate way of comparing revenues (or any other number) over the years. This is because, for example, $10 billion in revenues in 1950 would be very different than $10 billion in 2020 given the erosion of the dollar’s value over 70 years. In this study, we thus use inflation-adjusted 2020 dollars.
References (as of October 27, 2020)
Canadian Association of Petroleum Producers (2020). CAPP Statistical Handbook for Canada’s Upstream Petroleum Industry. <https://bit.ly/36LFHR3>.
Finance Canada (2020a). Economic and Fiscal Snapshot. <https://bit.ly/3kBaDav>.
Finance Canada (2020b). Fiscal Reference Tables 2019. <https://bit.ly/36SvzWy>.
Government of Ontario (2020). Public Accounts. <https://bit.ly/34zEpHf>.
Kneebone, Ronald, and Margarita Wilkins (2020). Canadian Provincial Government Budget Data – Newly Updated to 2018/19 <https://bit.ly/3lIbhDl>.
Statistics Canada (2020a). Table 10-10-0016-01: Canadian Government Finance Statistics for the Federal Government <https://bit.ly/2GPmmDt>.
Statistics Canada (2020b). Table 10-10-0017-01: Canadian Government Finance Statistics for the Provincial and Territorial Governments <https://bit.ly/3lwJhCI>.
Statistics Canada (2020c). Table 33-10-0006-01: Financial and Taxation Statistics for Enterprises, by Industry Type <https://bit.ly/33Mkzba>.
Statistics Canada (2020d). Financial and Taxation Statistics for Enterprises, by Industry Type (x 1,000,000). Custom tabulation.
Statistics Canada (2020e). T1 Family File of the Centre for Income and Socio-Economic Well-Being. Annual Income Estimates for Census Families and Individuals (T1 Family File). Custom Tabulation.
Statistics Canada (2020f). Table 11-10-0073-01: Wages, Salaries and Commissions of Tax Filers Aged 15 years and over by Main Industry Sector and Sex. <https://bit.ly/2SEsO2X>.
CEC Research Briefs
Canadian Energy Centre (CEC) Research Briefs are contextual explanations of data as they relate to Canadian energy. They are statistical analyses released periodically to provide context on energy issues for investors, policymakers and the public. The source of profiled data depends on the specific issue.
About the authors
This CEC Research Brief was compiled by Lennie Kaplan, Chief Research Analyst at the Canadian Energy Centre and Mark Milke, Executive Director of Research for the Canadian Energy Centre.
Acknowledgements
The authors and the Canadian Energy Centre would like to thank and acknowledge the assistance of Philip Cross for his review of this paper
Creative Commons Copyright
Research and data from the Canadian Energy Centre (CEC) is available for public usage under creative commons copyright terms with attribution to the Canadian Energy Centre. Attribution and specific restrictions on usage including non-commercial use only and no changes to material should follow guidelines enunciated by Creative Commons here: Attribution-NonCommercial-NoDerivs CC BY-NC-ND.